Free Statistics

of Irreproducible Research!

Author's title

Author*The author of this computation has been verified*
R Software Modulerwasp_multipleregression.wasp
Title produced by softwareMultiple Regression
Date of computationTue, 06 Dec 2016 19:04:26 +0100
Cite this page as followsStatistical Computations at FreeStatistics.org, Office for Research Development and Education, URL https://freestatistics.org/blog/index.php?v=date/2016/Dec/06/t1481050676xepm8sk613avrrp.htm/, Retrieved Fri, 17 May 2024 18:09:15 +0000
Statistical Computations at FreeStatistics.org, Office for Research Development and Education, URL https://freestatistics.org/blog/index.php?pk=297906, Retrieved Fri, 17 May 2024 18:09:15 +0000
QR Codes:

Original text written by user:
IsPrivate?No (this computation is public)
User-defined keywords
Estimated Impact156
Family? (F = Feedback message, R = changed R code, M = changed R Module, P = changed Parameters, D = changed Data)
-       [Multiple Regression] [Multiple Regression] [2016-12-06 18:04:26] [153c3207812fd13fe5ceee3276565119] [Current]
Feedback Forum

Post a new message
Dataseries X:
13	5	5	4	1
16	3	3	2	5
17	5	5	3	1
15	5	4	2	2
16	5	4	2	1
16	5	5	3	4
18	5	3	3	1
16	5	5	2	1
17	5	5	2	1
17	5	5	4	2
17	4	5	2	1
15	2	4	2	4
16	5	4	3	1
14	4	5	2	5
16	5	5	3	2
17	4	5	2	1
16	5	4	2	2
15	5	5	3	2
17	4	5	2	1
16	4	5	2	4
15	3	4	3	1
16	5	5	1	2
15	4	4	2	3
17	5	5	3	1
14	4	4	2	4
16	5	5	2	2
15	5	4	3	3
16	5	5	5	1
16	5	5	2	4
13	5	5	5	1
15	5	5	2	1
17	5	5	2	1
15	5	4	4	1
13	5	4	1	3
17	4	4	2	4
15	4	4	2	2
14	5	5	3	4
14	5	5	2	2
18	5	5	3	2
15	5	5	2	1
17	5	5	3	1
13	5	5	4	1
16	5	5	4	5
15	5	5	3	1
15	5	5	2	1
16	5	4	2	1
13	4	5	4	1
17	5	5	3	2
18	4	4	2	2
18	5	5	2	2
11	3	4	2	2
14	4	3	2	3
13	3	3	3	1
15	5	4	2	2
17	5	5	2	2
16	5	5	3	1
15	5	4	3	3
17	5	5	2	3
16	5	5	2	1
16	5	5	4	1
16	5	5	4	2
15	4	4	3	1
12	5	5	4	3
17	4	4	4	3
14	5	5	4	4
14	2	2	4	4
16	4	3	5	4
15	5	5	3	2
15	5	5	4	1
14	4	3	4	1
13	5	5	2	1
18	2	3	2	3
15	5	4	3	2
16	3	3	4	1
14	4	5	2	1
15	4	4	5	1
17	5	5	1	1
16	5	5	3	1
10	4	4	3	1
16	4	4	2	3
17	5	5	2	1
17	4	5	1	4
20	4	4	2	2
17	5	5	1	4
18	5	5	2	1
15	5	5	2	1
17	4	4	2	1
14	4	4	2	2
15	4	4	3	5
17	3	3	2	3
16	4	4	1	4
17	5	5	1	1
15	5	5	3	4
16	4	4	2	4
18	5	5	3	2
18	2	2	1	3
16	5	5	2	1
17	4	4	3	4
15	3	5	2	4
13	5	5	2	1
15	4	4	3	3
17	5	5	1	1
16	5	5	4	5
16	5	5	3	2
15	5	5	2	2
16	5	5	3	1
16	4	5	3	3
14	5	4	3	1
15	5	5	4	1
12	5	3	3	3
19	4	4	2	1
16	5	5	3	4
16	5	5	2	1
17	2	1	1	5
16	5	5	1	1
14	5	5	2	1
15	5	4	4	4
14	5	4	3	2
16	5	5	2	1
15	5	5	2	4
17	5	5	3	1
15	5	5	3	1
16	4	5	3	2
16	3	3	2	2
15	5	4	2	1
15	5	5	2	1
11	5	5	3	1
16	5	5	4	4
18	4	4	2	4
13	4	5	2	3
11	4	4	1	4
16	5	4	3	1
18	4	4	3	5
15	4	4	3	2
19	5	5	1	3
17	2	2	1	3
13	5	5	2	1
14	4	4	1	4
16	5	5	5	1
13	5	5	3	1
17	4	4	2	3
14	5	4	2	3
19	4	2	4	2
14	5	5	2	4
16	5	5	4	4
12	5	5	4	2
16	4	4	3	4
16	5	5	4	4
15	5	5	3	2
12	5	4	4	1
15	5	5	3	1
17	5	5	4	1
14	2	2	2	3
15	5	5	4	3
18	3	3	1	4
15	5	5	4	1
18	5	4	3	3
15	5	5	2	3
15	4	4	2	3
16	5	5	2	2
13	5	5	4	1
16	5	5	3	2
14	5	4	3	2
16	5	2	2	4


Summary of computational transaction
Raw Input view raw input (R code)
Raw Outputview raw output of R engine
Computing time7 seconds
R ServerBig Analytics Cloud Computing Center
R Framework error message
The field 'Names of X columns' contains a hard return which cannot be interpreted.
Please, resubmit your request without hard returns in the 'Names of X columns'.

\begin{tabular}{lllllllll}
\hline
Summary of computational transaction \tabularnewline
Raw Input view raw input (R code)  \tabularnewline
Raw Outputview raw output of R engine  \tabularnewline
Computing time7 seconds \tabularnewline
R ServerBig Analytics Cloud Computing Center \tabularnewline
R Framework error message & 
The field 'Names of X columns' contains a hard return which cannot be interpreted.
Please, resubmit your request without hard returns in the 'Names of X columns'.
\tabularnewline \hline \end{tabular} %Source: https://freestatistics.org/blog/index.php?pk=297906&T=0

[TABLE]
[ROW]
Summary of computational transaction[/C][/ROW] [ROW]Raw Input[/C] view raw input (R code) [/C][/ROW] [ROW]Raw Output[/C]view raw output of R engine [/C][/ROW] [ROW]Computing time[/C]7 seconds[/C][/ROW] [ROW]R Server[/C]Big Analytics Cloud Computing Center[/C][/ROW] [ROW]R Framework error message[/C][C]
The field 'Names of X columns' contains a hard return which cannot be interpreted.
Please, resubmit your request without hard returns in the 'Names of X columns'.
[/C][/ROW] [/TABLE] Source: https://freestatistics.org/blog/index.php?pk=297906&T=0

Globally Unique Identifier (entire table): ba.freestatistics.org/blog/index.php?pk=297906&T=0

As an alternative you can also use a QR Code:  

The GUIDs for individual cells are displayed in the table below:

Summary of computational transaction
Raw Input view raw input (R code)
Raw Outputview raw output of R engine
Computing time7 seconds
R ServerBig Analytics Cloud Computing Center
R Framework error message
The field 'Names of X columns' contains a hard return which cannot be interpreted.
Please, resubmit your request without hard returns in the 'Names of X columns'.


Multiple Linear Regression - Estimated Regression Equation
TVDCSUM[t] = + 16.4836 + 0.0254131EP1[t] -0.0829008EP2[t] -0.32382EP3[t] + 0.0532448`EP4\r`[t] + e[t]

\begin{tabular}{lllllllll}
\hline
Multiple Linear Regression - Estimated Regression Equation \tabularnewline
TVDCSUM[t] =  +  16.4836 +  0.0254131EP1[t] -0.0829008EP2[t] -0.32382EP3[t] +  0.0532448`EP4\r`[t]  + e[t] \tabularnewline
 \tabularnewline
\hline
\end{tabular}
%Source: https://freestatistics.org/blog/index.php?pk=297906&T=1

[TABLE]
[ROW][C]Multiple Linear Regression - Estimated Regression Equation[/C][/ROW]
[ROW][C]TVDCSUM[t] =  +  16.4836 +  0.0254131EP1[t] -0.0829008EP2[t] -0.32382EP3[t] +  0.0532448`EP4\r`[t]  + e[t][/C][/ROW]
[ROW][C][/C][/ROW]
[/TABLE]
Source: https://freestatistics.org/blog/index.php?pk=297906&T=1

Globally Unique Identifier (entire table): ba.freestatistics.org/blog/index.php?pk=297906&T=1

As an alternative you can also use a QR Code:  

The GUIDs for individual cells are displayed in the table below:

Multiple Linear Regression - Estimated Regression Equation
TVDCSUM[t] = + 16.4836 + 0.0254131EP1[t] -0.0829008EP2[t] -0.32382EP3[t] + 0.0532448`EP4\r`[t] + e[t]


Multiple Linear Regression - Ordinary Least Squares
VariableParameterS.D.T-STATH0: parameter = 02-tail p-value1-tail p-value
(Intercept)+16.48 0.9971+1.6530e+01 2.317e-36 1.159e-36
EP1+0.02541 0.2413+1.0530e-01 0.9163 0.4581
EP2-0.0829 0.2221-3.7330e-01 0.7094 0.3547
EP3-0.3238 0.1387-2.3350e+00 0.02081 0.0104
`EP4\r`+0.05325 0.11+4.8390e-01 0.6291 0.3146

\begin{tabular}{lllllllll}
\hline
Multiple Linear Regression - Ordinary Least Squares \tabularnewline
Variable & Parameter & S.D. & T-STATH0: parameter = 0 & 2-tail p-value & 1-tail p-value \tabularnewline
(Intercept) & +16.48 &  0.9971 & +1.6530e+01 &  2.317e-36 &  1.159e-36 \tabularnewline
EP1 & +0.02541 &  0.2413 & +1.0530e-01 &  0.9163 &  0.4581 \tabularnewline
EP2 & -0.0829 &  0.2221 & -3.7330e-01 &  0.7094 &  0.3547 \tabularnewline
EP3 & -0.3238 &  0.1387 & -2.3350e+00 &  0.02081 &  0.0104 \tabularnewline
`EP4\r` & +0.05325 &  0.11 & +4.8390e-01 &  0.6291 &  0.3146 \tabularnewline
\hline
\end{tabular}
%Source: https://freestatistics.org/blog/index.php?pk=297906&T=2

[TABLE]
[ROW][C]Multiple Linear Regression - Ordinary Least Squares[/C][/ROW]
[ROW][C]Variable[/C][C]Parameter[/C][C]S.D.[/C][C]T-STATH0: parameter = 0[/C][C]2-tail p-value[/C][C]1-tail p-value[/C][/ROW]
[ROW][C](Intercept)[/C][C]+16.48[/C][C] 0.9971[/C][C]+1.6530e+01[/C][C] 2.317e-36[/C][C] 1.159e-36[/C][/ROW]
[ROW][C]EP1[/C][C]+0.02541[/C][C] 0.2413[/C][C]+1.0530e-01[/C][C] 0.9163[/C][C] 0.4581[/C][/ROW]
[ROW][C]EP2[/C][C]-0.0829[/C][C] 0.2221[/C][C]-3.7330e-01[/C][C] 0.7094[/C][C] 0.3547[/C][/ROW]
[ROW][C]EP3[/C][C]-0.3238[/C][C] 0.1387[/C][C]-2.3350e+00[/C][C] 0.02081[/C][C] 0.0104[/C][/ROW]
[ROW][C]`EP4\r`[/C][C]+0.05325[/C][C] 0.11[/C][C]+4.8390e-01[/C][C] 0.6291[/C][C] 0.3146[/C][/ROW]
[/TABLE]
Source: https://freestatistics.org/blog/index.php?pk=297906&T=2

Globally Unique Identifier (entire table): ba.freestatistics.org/blog/index.php?pk=297906&T=2

As an alternative you can also use a QR Code:  

The GUIDs for individual cells are displayed in the table below:

Multiple Linear Regression - Ordinary Least Squares
VariableParameterS.D.T-STATH0: parameter = 02-tail p-value1-tail p-value
(Intercept)+16.48 0.9971+1.6530e+01 2.317e-36 1.159e-36
EP1+0.02541 0.2413+1.0530e-01 0.9163 0.4581
EP2-0.0829 0.2221-3.7330e-01 0.7094 0.3547
EP3-0.3238 0.1387-2.3350e+00 0.02081 0.0104
`EP4\r`+0.05325 0.11+4.8390e-01 0.6291 0.3146


Multiple Linear Regression - Regression Statistics
Multiple R 0.2018
R-squared 0.04072
Adjusted R-squared 0.01659
F-TEST (value) 1.688
F-TEST (DF numerator)4
F-TEST (DF denominator)159
p-value 0.1555
Multiple Linear Regression - Residual Statistics
Residual Standard Deviation 1.686
Sum Squared Residuals 451.8

\begin{tabular}{lllllllll}
\hline
Multiple Linear Regression - Regression Statistics \tabularnewline
Multiple R &  0.2018 \tabularnewline
R-squared &  0.04072 \tabularnewline
Adjusted R-squared &  0.01659 \tabularnewline
F-TEST (value) &  1.688 \tabularnewline
F-TEST (DF numerator) & 4 \tabularnewline
F-TEST (DF denominator) & 159 \tabularnewline
p-value &  0.1555 \tabularnewline
Multiple Linear Regression - Residual Statistics \tabularnewline
Residual Standard Deviation &  1.686 \tabularnewline
Sum Squared Residuals &  451.8 \tabularnewline
\hline
\end{tabular}
%Source: https://freestatistics.org/blog/index.php?pk=297906&T=3

[TABLE]
[ROW][C]Multiple Linear Regression - Regression Statistics[/C][/ROW]
[ROW][C]Multiple R[/C][C] 0.2018[/C][/ROW]
[ROW][C]R-squared[/C][C] 0.04072[/C][/ROW]
[ROW][C]Adjusted R-squared[/C][C] 0.01659[/C][/ROW]
[ROW][C]F-TEST (value)[/C][C] 1.688[/C][/ROW]
[ROW][C]F-TEST (DF numerator)[/C][C]4[/C][/ROW]
[ROW][C]F-TEST (DF denominator)[/C][C]159[/C][/ROW]
[ROW][C]p-value[/C][C] 0.1555[/C][/ROW]
[ROW][C]Multiple Linear Regression - Residual Statistics[/C][/ROW]
[ROW][C]Residual Standard Deviation[/C][C] 1.686[/C][/ROW]
[ROW][C]Sum Squared Residuals[/C][C] 451.8[/C][/ROW]
[/TABLE]
Source: https://freestatistics.org/blog/index.php?pk=297906&T=3

Globally Unique Identifier (entire table): ba.freestatistics.org/blog/index.php?pk=297906&T=3

As an alternative you can also use a QR Code:  

The GUIDs for individual cells are displayed in the table below:

Multiple Linear Regression - Regression Statistics
Multiple R 0.2018
R-squared 0.04072
Adjusted R-squared 0.01659
F-TEST (value) 1.688
F-TEST (DF numerator)4
F-TEST (DF denominator)159
p-value 0.1555
Multiple Linear Regression - Residual Statistics
Residual Standard Deviation 1.686
Sum Squared Residuals 451.8


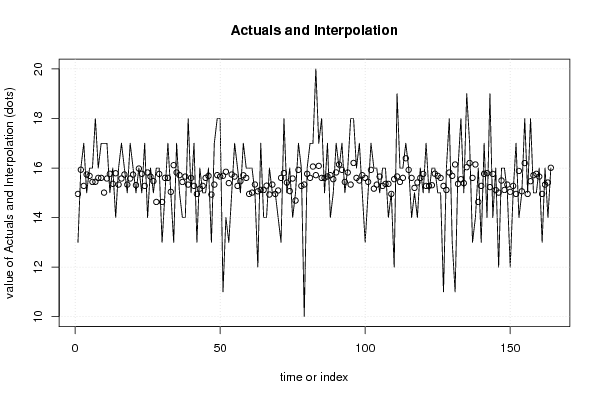
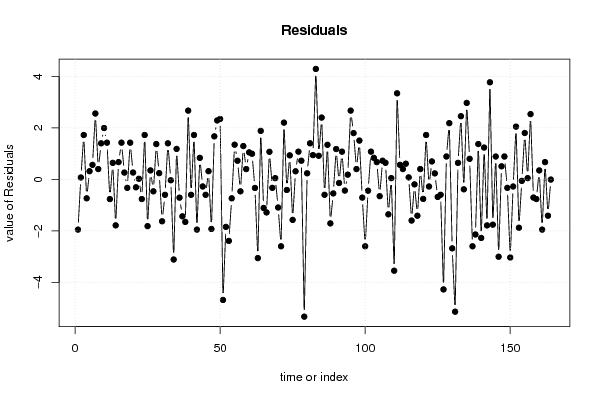
Multiple Linear Regression - Actuals, Interpolation, and Residuals
Time or IndexActualsInterpolationForecastResidualsPrediction Error
1 13 14.95-1.954
2 16 15.93 0.07023
3 17 15.28 1.722
4 15 15.74-0.738
5 16 15.68 0.3153
6 16 15.44 0.5623
7 18 15.44 2.556
8 16 15.6 0.3982
9 17 15.6 1.398
10 17 15.01 1.993
11 17 15.58 1.424
12 15 15.77-0.7682
13 16 15.36 0.6391
14 14 15.79-1.789
15 16 15.33 0.6688
16 17 15.58 1.424
17 16 15.74 0.262
18 15 15.33-0.3312
19 17 15.58 1.424
20 16 15.74 0.2639
21 15 15.31-0.3101
22 16 15.98 0.02112
23 15 15.77-0.7658
24 17 15.28 1.722
25 14 15.82-1.819
26 16 15.66 0.3449
27 15 15.47-0.4674
28 16 14.63 1.37
29 16 15.76 0.2384
30 13 14.63-1.63
31 15 15.6-0.6018
32 17 15.6 1.398
33 15 15.04-0.03708
34 13 16.11-3.115
35 17 15.82 1.181
36 15 15.71-0.7125
37 14 15.44-1.438
38 14 15.66-1.655
39 18 15.33 2.669
40 15 15.6-0.6018
41 17 15.28 1.722
42 13 14.95-1.954
43 16 15.17 0.8328
44 15 15.28-0.278
45 15 15.6-0.6018
46 16 15.68 0.3153
47 13 14.93-1.929
48 17 15.33 1.669
49 18 15.71 2.287
50 18 15.66 2.345
51 11 15.69-4.687
52 14 15.85-1.849
53 13 15.39-2.393
54 15 15.74-0.738
55 17 15.66 1.345
56 16 15.28 0.722
57 15 15.47-0.4674
58 17 15.71 1.292
59 16 15.6 0.3982
60 16 14.95 1.046
61 16 15.01 0.9926
62 15 15.34-0.3355
63 12 15.06-3.061
64 17 15.12 1.882
65 14 15.11-1.114
66 14 15.29-1.286
67 16 14.93 1.07
68 15 15.33-0.3312
69 15 14.95 0.04582
70 14 15.09-1.095
71 13 15.6-2.602
72 18 15.8 2.202
73 15 15.41-0.4141
74 16 15.07 0.9308
75 14 15.58-1.576
76 15 14.69 0.3122
77 17 15.93 1.074
78 16 15.28 0.722
79 10 15.34-5.335
80 16 15.77 0.2342
81 17 15.6 1.398
82 17 16.06 0.94
83 20 15.71 4.287
84 17 16.09 0.9146
85 18 15.6 2.398
86 15 15.6-0.6018
87 17 15.66 1.341
88 14 15.71-1.713
89 15 15.55-0.5485
90 17 15.82 1.177
91 16 16.14-0.1429
92 17 15.93 1.074
93 15 15.44-0.4377
94 16 15.82 0.181
95 18 15.33 2.669
96 18 16.2 1.795
97 16 15.6 0.3982
98 17 15.5 1.505
99 15 15.71-0.7107
100 13 15.6-2.602
101 15 15.44-0.442
102 17 15.93 1.074
103 16 15.17 0.8328
104 16 15.33 0.6688
105 15 15.66-0.6551
106 16 15.28 0.722
107 16 15.36 0.6409
108 14 15.36-1.361
109 15 14.95 0.04582
110 12 15.55-3.55
111 19 15.66 3.341
112 16 15.44 0.5623
113 16 15.6 0.3982
114 17 16.39 0.606
115 16 15.93 0.07436
116 14 15.6-1.602
117 15 15.2-0.1968
118 14 15.41-1.414
119 16 15.6 0.3982
120 15 15.76-0.7616
121 17 15.28 1.722
122 15 15.28-0.278
123 16 15.31 0.6942
124 16 15.77 0.23
125 15 15.68-0.6847
126 15 15.6-0.6018
127 11 15.28-4.278
128 16 15.11 0.8861
129 18 15.82 2.181
130 13 15.68-2.683
131 11 16.14-5.143
132 16 15.36 0.6391
133 18 15.55 2.452
134 15 15.39-0.3887
135 19 16.03 2.968
136 17 16.2 0.7954
137 13 15.6-2.602
138 14 16.14-2.143
139 16 14.63 1.37
140 13 15.28-2.278
141 17 15.77 1.234
142 14 15.79-1.791
143 19 15.23 3.769
144 14 15.76-1.762
145 16 15.11 0.8861
146 12 15.01-3.007
147 16 15.5 0.5048
148 16 15.11 0.8861
149 15 15.33-0.3312
150 12 15.04-3.037
151 15 15.28-0.278
152 17 14.95 2.046
153 14 15.88-1.881
154 15 15.06-0.06067
155 18 16.2 1.8
156 15 14.95 0.04582
157 18 15.47 2.533
158 15 15.71-0.7083
159 15 15.77-0.7658
160 16 15.66 0.3449
161 13 14.95-1.954
162 16 15.33 0.6688
163 14 15.41-1.414
164 16 16.01-0.01025

\begin{tabular}{lllllllll}
\hline
Multiple Linear Regression - Actuals, Interpolation, and Residuals \tabularnewline
Time or Index & Actuals & InterpolationForecast & ResidualsPrediction Error \tabularnewline
1 &  13 &  14.95 & -1.954 \tabularnewline
2 &  16 &  15.93 &  0.07023 \tabularnewline
3 &  17 &  15.28 &  1.722 \tabularnewline
4 &  15 &  15.74 & -0.738 \tabularnewline
5 &  16 &  15.68 &  0.3153 \tabularnewline
6 &  16 &  15.44 &  0.5623 \tabularnewline
7 &  18 &  15.44 &  2.556 \tabularnewline
8 &  16 &  15.6 &  0.3982 \tabularnewline
9 &  17 &  15.6 &  1.398 \tabularnewline
10 &  17 &  15.01 &  1.993 \tabularnewline
11 &  17 &  15.58 &  1.424 \tabularnewline
12 &  15 &  15.77 & -0.7682 \tabularnewline
13 &  16 &  15.36 &  0.6391 \tabularnewline
14 &  14 &  15.79 & -1.789 \tabularnewline
15 &  16 &  15.33 &  0.6688 \tabularnewline
16 &  17 &  15.58 &  1.424 \tabularnewline
17 &  16 &  15.74 &  0.262 \tabularnewline
18 &  15 &  15.33 & -0.3312 \tabularnewline
19 &  17 &  15.58 &  1.424 \tabularnewline
20 &  16 &  15.74 &  0.2639 \tabularnewline
21 &  15 &  15.31 & -0.3101 \tabularnewline
22 &  16 &  15.98 &  0.02112 \tabularnewline
23 &  15 &  15.77 & -0.7658 \tabularnewline
24 &  17 &  15.28 &  1.722 \tabularnewline
25 &  14 &  15.82 & -1.819 \tabularnewline
26 &  16 &  15.66 &  0.3449 \tabularnewline
27 &  15 &  15.47 & -0.4674 \tabularnewline
28 &  16 &  14.63 &  1.37 \tabularnewline
29 &  16 &  15.76 &  0.2384 \tabularnewline
30 &  13 &  14.63 & -1.63 \tabularnewline
31 &  15 &  15.6 & -0.6018 \tabularnewline
32 &  17 &  15.6 &  1.398 \tabularnewline
33 &  15 &  15.04 & -0.03708 \tabularnewline
34 &  13 &  16.11 & -3.115 \tabularnewline
35 &  17 &  15.82 &  1.181 \tabularnewline
36 &  15 &  15.71 & -0.7125 \tabularnewline
37 &  14 &  15.44 & -1.438 \tabularnewline
38 &  14 &  15.66 & -1.655 \tabularnewline
39 &  18 &  15.33 &  2.669 \tabularnewline
40 &  15 &  15.6 & -0.6018 \tabularnewline
41 &  17 &  15.28 &  1.722 \tabularnewline
42 &  13 &  14.95 & -1.954 \tabularnewline
43 &  16 &  15.17 &  0.8328 \tabularnewline
44 &  15 &  15.28 & -0.278 \tabularnewline
45 &  15 &  15.6 & -0.6018 \tabularnewline
46 &  16 &  15.68 &  0.3153 \tabularnewline
47 &  13 &  14.93 & -1.929 \tabularnewline
48 &  17 &  15.33 &  1.669 \tabularnewline
49 &  18 &  15.71 &  2.287 \tabularnewline
50 &  18 &  15.66 &  2.345 \tabularnewline
51 &  11 &  15.69 & -4.687 \tabularnewline
52 &  14 &  15.85 & -1.849 \tabularnewline
53 &  13 &  15.39 & -2.393 \tabularnewline
54 &  15 &  15.74 & -0.738 \tabularnewline
55 &  17 &  15.66 &  1.345 \tabularnewline
56 &  16 &  15.28 &  0.722 \tabularnewline
57 &  15 &  15.47 & -0.4674 \tabularnewline
58 &  17 &  15.71 &  1.292 \tabularnewline
59 &  16 &  15.6 &  0.3982 \tabularnewline
60 &  16 &  14.95 &  1.046 \tabularnewline
61 &  16 &  15.01 &  0.9926 \tabularnewline
62 &  15 &  15.34 & -0.3355 \tabularnewline
63 &  12 &  15.06 & -3.061 \tabularnewline
64 &  17 &  15.12 &  1.882 \tabularnewline
65 &  14 &  15.11 & -1.114 \tabularnewline
66 &  14 &  15.29 & -1.286 \tabularnewline
67 &  16 &  14.93 &  1.07 \tabularnewline
68 &  15 &  15.33 & -0.3312 \tabularnewline
69 &  15 &  14.95 &  0.04582 \tabularnewline
70 &  14 &  15.09 & -1.095 \tabularnewline
71 &  13 &  15.6 & -2.602 \tabularnewline
72 &  18 &  15.8 &  2.202 \tabularnewline
73 &  15 &  15.41 & -0.4141 \tabularnewline
74 &  16 &  15.07 &  0.9308 \tabularnewline
75 &  14 &  15.58 & -1.576 \tabularnewline
76 &  15 &  14.69 &  0.3122 \tabularnewline
77 &  17 &  15.93 &  1.074 \tabularnewline
78 &  16 &  15.28 &  0.722 \tabularnewline
79 &  10 &  15.34 & -5.335 \tabularnewline
80 &  16 &  15.77 &  0.2342 \tabularnewline
81 &  17 &  15.6 &  1.398 \tabularnewline
82 &  17 &  16.06 &  0.94 \tabularnewline
83 &  20 &  15.71 &  4.287 \tabularnewline
84 &  17 &  16.09 &  0.9146 \tabularnewline
85 &  18 &  15.6 &  2.398 \tabularnewline
86 &  15 &  15.6 & -0.6018 \tabularnewline
87 &  17 &  15.66 &  1.341 \tabularnewline
88 &  14 &  15.71 & -1.713 \tabularnewline
89 &  15 &  15.55 & -0.5485 \tabularnewline
90 &  17 &  15.82 &  1.177 \tabularnewline
91 &  16 &  16.14 & -0.1429 \tabularnewline
92 &  17 &  15.93 &  1.074 \tabularnewline
93 &  15 &  15.44 & -0.4377 \tabularnewline
94 &  16 &  15.82 &  0.181 \tabularnewline
95 &  18 &  15.33 &  2.669 \tabularnewline
96 &  18 &  16.2 &  1.795 \tabularnewline
97 &  16 &  15.6 &  0.3982 \tabularnewline
98 &  17 &  15.5 &  1.505 \tabularnewline
99 &  15 &  15.71 & -0.7107 \tabularnewline
100 &  13 &  15.6 & -2.602 \tabularnewline
101 &  15 &  15.44 & -0.442 \tabularnewline
102 &  17 &  15.93 &  1.074 \tabularnewline
103 &  16 &  15.17 &  0.8328 \tabularnewline
104 &  16 &  15.33 &  0.6688 \tabularnewline
105 &  15 &  15.66 & -0.6551 \tabularnewline
106 &  16 &  15.28 &  0.722 \tabularnewline
107 &  16 &  15.36 &  0.6409 \tabularnewline
108 &  14 &  15.36 & -1.361 \tabularnewline
109 &  15 &  14.95 &  0.04582 \tabularnewline
110 &  12 &  15.55 & -3.55 \tabularnewline
111 &  19 &  15.66 &  3.341 \tabularnewline
112 &  16 &  15.44 &  0.5623 \tabularnewline
113 &  16 &  15.6 &  0.3982 \tabularnewline
114 &  17 &  16.39 &  0.606 \tabularnewline
115 &  16 &  15.93 &  0.07436 \tabularnewline
116 &  14 &  15.6 & -1.602 \tabularnewline
117 &  15 &  15.2 & -0.1968 \tabularnewline
118 &  14 &  15.41 & -1.414 \tabularnewline
119 &  16 &  15.6 &  0.3982 \tabularnewline
120 &  15 &  15.76 & -0.7616 \tabularnewline
121 &  17 &  15.28 &  1.722 \tabularnewline
122 &  15 &  15.28 & -0.278 \tabularnewline
123 &  16 &  15.31 &  0.6942 \tabularnewline
124 &  16 &  15.77 &  0.23 \tabularnewline
125 &  15 &  15.68 & -0.6847 \tabularnewline
126 &  15 &  15.6 & -0.6018 \tabularnewline
127 &  11 &  15.28 & -4.278 \tabularnewline
128 &  16 &  15.11 &  0.8861 \tabularnewline
129 &  18 &  15.82 &  2.181 \tabularnewline
130 &  13 &  15.68 & -2.683 \tabularnewline
131 &  11 &  16.14 & -5.143 \tabularnewline
132 &  16 &  15.36 &  0.6391 \tabularnewline
133 &  18 &  15.55 &  2.452 \tabularnewline
134 &  15 &  15.39 & -0.3887 \tabularnewline
135 &  19 &  16.03 &  2.968 \tabularnewline
136 &  17 &  16.2 &  0.7954 \tabularnewline
137 &  13 &  15.6 & -2.602 \tabularnewline
138 &  14 &  16.14 & -2.143 \tabularnewline
139 &  16 &  14.63 &  1.37 \tabularnewline
140 &  13 &  15.28 & -2.278 \tabularnewline
141 &  17 &  15.77 &  1.234 \tabularnewline
142 &  14 &  15.79 & -1.791 \tabularnewline
143 &  19 &  15.23 &  3.769 \tabularnewline
144 &  14 &  15.76 & -1.762 \tabularnewline
145 &  16 &  15.11 &  0.8861 \tabularnewline
146 &  12 &  15.01 & -3.007 \tabularnewline
147 &  16 &  15.5 &  0.5048 \tabularnewline
148 &  16 &  15.11 &  0.8861 \tabularnewline
149 &  15 &  15.33 & -0.3312 \tabularnewline
150 &  12 &  15.04 & -3.037 \tabularnewline
151 &  15 &  15.28 & -0.278 \tabularnewline
152 &  17 &  14.95 &  2.046 \tabularnewline
153 &  14 &  15.88 & -1.881 \tabularnewline
154 &  15 &  15.06 & -0.06067 \tabularnewline
155 &  18 &  16.2 &  1.8 \tabularnewline
156 &  15 &  14.95 &  0.04582 \tabularnewline
157 &  18 &  15.47 &  2.533 \tabularnewline
158 &  15 &  15.71 & -0.7083 \tabularnewline
159 &  15 &  15.77 & -0.7658 \tabularnewline
160 &  16 &  15.66 &  0.3449 \tabularnewline
161 &  13 &  14.95 & -1.954 \tabularnewline
162 &  16 &  15.33 &  0.6688 \tabularnewline
163 &  14 &  15.41 & -1.414 \tabularnewline
164 &  16 &  16.01 & -0.01025 \tabularnewline
\hline
\end{tabular}
%Source: https://freestatistics.org/blog/index.php?pk=297906&T=4

[TABLE]
[ROW][C]Multiple Linear Regression - Actuals, Interpolation, and Residuals[/C][/ROW]
[ROW][C]Time or Index[/C][C]Actuals[/C][C]InterpolationForecast[/C][C]ResidualsPrediction Error[/C][/ROW]
[ROW][C]1[/C][C] 13[/C][C] 14.95[/C][C]-1.954[/C][/ROW]
[ROW][C]2[/C][C] 16[/C][C] 15.93[/C][C] 0.07023[/C][/ROW]
[ROW][C]3[/C][C] 17[/C][C] 15.28[/C][C] 1.722[/C][/ROW]
[ROW][C]4[/C][C] 15[/C][C] 15.74[/C][C]-0.738[/C][/ROW]
[ROW][C]5[/C][C] 16[/C][C] 15.68[/C][C] 0.3153[/C][/ROW]
[ROW][C]6[/C][C] 16[/C][C] 15.44[/C][C] 0.5623[/C][/ROW]
[ROW][C]7[/C][C] 18[/C][C] 15.44[/C][C] 2.556[/C][/ROW]
[ROW][C]8[/C][C] 16[/C][C] 15.6[/C][C] 0.3982[/C][/ROW]
[ROW][C]9[/C][C] 17[/C][C] 15.6[/C][C] 1.398[/C][/ROW]
[ROW][C]10[/C][C] 17[/C][C] 15.01[/C][C] 1.993[/C][/ROW]
[ROW][C]11[/C][C] 17[/C][C] 15.58[/C][C] 1.424[/C][/ROW]
[ROW][C]12[/C][C] 15[/C][C] 15.77[/C][C]-0.7682[/C][/ROW]
[ROW][C]13[/C][C] 16[/C][C] 15.36[/C][C] 0.6391[/C][/ROW]
[ROW][C]14[/C][C] 14[/C][C] 15.79[/C][C]-1.789[/C][/ROW]
[ROW][C]15[/C][C] 16[/C][C] 15.33[/C][C] 0.6688[/C][/ROW]
[ROW][C]16[/C][C] 17[/C][C] 15.58[/C][C] 1.424[/C][/ROW]
[ROW][C]17[/C][C] 16[/C][C] 15.74[/C][C] 0.262[/C][/ROW]
[ROW][C]18[/C][C] 15[/C][C] 15.33[/C][C]-0.3312[/C][/ROW]
[ROW][C]19[/C][C] 17[/C][C] 15.58[/C][C] 1.424[/C][/ROW]
[ROW][C]20[/C][C] 16[/C][C] 15.74[/C][C] 0.2639[/C][/ROW]
[ROW][C]21[/C][C] 15[/C][C] 15.31[/C][C]-0.3101[/C][/ROW]
[ROW][C]22[/C][C] 16[/C][C] 15.98[/C][C] 0.02112[/C][/ROW]
[ROW][C]23[/C][C] 15[/C][C] 15.77[/C][C]-0.7658[/C][/ROW]
[ROW][C]24[/C][C] 17[/C][C] 15.28[/C][C] 1.722[/C][/ROW]
[ROW][C]25[/C][C] 14[/C][C] 15.82[/C][C]-1.819[/C][/ROW]
[ROW][C]26[/C][C] 16[/C][C] 15.66[/C][C] 0.3449[/C][/ROW]
[ROW][C]27[/C][C] 15[/C][C] 15.47[/C][C]-0.4674[/C][/ROW]
[ROW][C]28[/C][C] 16[/C][C] 14.63[/C][C] 1.37[/C][/ROW]
[ROW][C]29[/C][C] 16[/C][C] 15.76[/C][C] 0.2384[/C][/ROW]
[ROW][C]30[/C][C] 13[/C][C] 14.63[/C][C]-1.63[/C][/ROW]
[ROW][C]31[/C][C] 15[/C][C] 15.6[/C][C]-0.6018[/C][/ROW]
[ROW][C]32[/C][C] 17[/C][C] 15.6[/C][C] 1.398[/C][/ROW]
[ROW][C]33[/C][C] 15[/C][C] 15.04[/C][C]-0.03708[/C][/ROW]
[ROW][C]34[/C][C] 13[/C][C] 16.11[/C][C]-3.115[/C][/ROW]
[ROW][C]35[/C][C] 17[/C][C] 15.82[/C][C] 1.181[/C][/ROW]
[ROW][C]36[/C][C] 15[/C][C] 15.71[/C][C]-0.7125[/C][/ROW]
[ROW][C]37[/C][C] 14[/C][C] 15.44[/C][C]-1.438[/C][/ROW]
[ROW][C]38[/C][C] 14[/C][C] 15.66[/C][C]-1.655[/C][/ROW]
[ROW][C]39[/C][C] 18[/C][C] 15.33[/C][C] 2.669[/C][/ROW]
[ROW][C]40[/C][C] 15[/C][C] 15.6[/C][C]-0.6018[/C][/ROW]
[ROW][C]41[/C][C] 17[/C][C] 15.28[/C][C] 1.722[/C][/ROW]
[ROW][C]42[/C][C] 13[/C][C] 14.95[/C][C]-1.954[/C][/ROW]
[ROW][C]43[/C][C] 16[/C][C] 15.17[/C][C] 0.8328[/C][/ROW]
[ROW][C]44[/C][C] 15[/C][C] 15.28[/C][C]-0.278[/C][/ROW]
[ROW][C]45[/C][C] 15[/C][C] 15.6[/C][C]-0.6018[/C][/ROW]
[ROW][C]46[/C][C] 16[/C][C] 15.68[/C][C] 0.3153[/C][/ROW]
[ROW][C]47[/C][C] 13[/C][C] 14.93[/C][C]-1.929[/C][/ROW]
[ROW][C]48[/C][C] 17[/C][C] 15.33[/C][C] 1.669[/C][/ROW]
[ROW][C]49[/C][C] 18[/C][C] 15.71[/C][C] 2.287[/C][/ROW]
[ROW][C]50[/C][C] 18[/C][C] 15.66[/C][C] 2.345[/C][/ROW]
[ROW][C]51[/C][C] 11[/C][C] 15.69[/C][C]-4.687[/C][/ROW]
[ROW][C]52[/C][C] 14[/C][C] 15.85[/C][C]-1.849[/C][/ROW]
[ROW][C]53[/C][C] 13[/C][C] 15.39[/C][C]-2.393[/C][/ROW]
[ROW][C]54[/C][C] 15[/C][C] 15.74[/C][C]-0.738[/C][/ROW]
[ROW][C]55[/C][C] 17[/C][C] 15.66[/C][C] 1.345[/C][/ROW]
[ROW][C]56[/C][C] 16[/C][C] 15.28[/C][C] 0.722[/C][/ROW]
[ROW][C]57[/C][C] 15[/C][C] 15.47[/C][C]-0.4674[/C][/ROW]
[ROW][C]58[/C][C] 17[/C][C] 15.71[/C][C] 1.292[/C][/ROW]
[ROW][C]59[/C][C] 16[/C][C] 15.6[/C][C] 0.3982[/C][/ROW]
[ROW][C]60[/C][C] 16[/C][C] 14.95[/C][C] 1.046[/C][/ROW]
[ROW][C]61[/C][C] 16[/C][C] 15.01[/C][C] 0.9926[/C][/ROW]
[ROW][C]62[/C][C] 15[/C][C] 15.34[/C][C]-0.3355[/C][/ROW]
[ROW][C]63[/C][C] 12[/C][C] 15.06[/C][C]-3.061[/C][/ROW]
[ROW][C]64[/C][C] 17[/C][C] 15.12[/C][C] 1.882[/C][/ROW]
[ROW][C]65[/C][C] 14[/C][C] 15.11[/C][C]-1.114[/C][/ROW]
[ROW][C]66[/C][C] 14[/C][C] 15.29[/C][C]-1.286[/C][/ROW]
[ROW][C]67[/C][C] 16[/C][C] 14.93[/C][C] 1.07[/C][/ROW]
[ROW][C]68[/C][C] 15[/C][C] 15.33[/C][C]-0.3312[/C][/ROW]
[ROW][C]69[/C][C] 15[/C][C] 14.95[/C][C] 0.04582[/C][/ROW]
[ROW][C]70[/C][C] 14[/C][C] 15.09[/C][C]-1.095[/C][/ROW]
[ROW][C]71[/C][C] 13[/C][C] 15.6[/C][C]-2.602[/C][/ROW]
[ROW][C]72[/C][C] 18[/C][C] 15.8[/C][C] 2.202[/C][/ROW]
[ROW][C]73[/C][C] 15[/C][C] 15.41[/C][C]-0.4141[/C][/ROW]
[ROW][C]74[/C][C] 16[/C][C] 15.07[/C][C] 0.9308[/C][/ROW]
[ROW][C]75[/C][C] 14[/C][C] 15.58[/C][C]-1.576[/C][/ROW]
[ROW][C]76[/C][C] 15[/C][C] 14.69[/C][C] 0.3122[/C][/ROW]
[ROW][C]77[/C][C] 17[/C][C] 15.93[/C][C] 1.074[/C][/ROW]
[ROW][C]78[/C][C] 16[/C][C] 15.28[/C][C] 0.722[/C][/ROW]
[ROW][C]79[/C][C] 10[/C][C] 15.34[/C][C]-5.335[/C][/ROW]
[ROW][C]80[/C][C] 16[/C][C] 15.77[/C][C] 0.2342[/C][/ROW]
[ROW][C]81[/C][C] 17[/C][C] 15.6[/C][C] 1.398[/C][/ROW]
[ROW][C]82[/C][C] 17[/C][C] 16.06[/C][C] 0.94[/C][/ROW]
[ROW][C]83[/C][C] 20[/C][C] 15.71[/C][C] 4.287[/C][/ROW]
[ROW][C]84[/C][C] 17[/C][C] 16.09[/C][C] 0.9146[/C][/ROW]
[ROW][C]85[/C][C] 18[/C][C] 15.6[/C][C] 2.398[/C][/ROW]
[ROW][C]86[/C][C] 15[/C][C] 15.6[/C][C]-0.6018[/C][/ROW]
[ROW][C]87[/C][C] 17[/C][C] 15.66[/C][C] 1.341[/C][/ROW]
[ROW][C]88[/C][C] 14[/C][C] 15.71[/C][C]-1.713[/C][/ROW]
[ROW][C]89[/C][C] 15[/C][C] 15.55[/C][C]-0.5485[/C][/ROW]
[ROW][C]90[/C][C] 17[/C][C] 15.82[/C][C] 1.177[/C][/ROW]
[ROW][C]91[/C][C] 16[/C][C] 16.14[/C][C]-0.1429[/C][/ROW]
[ROW][C]92[/C][C] 17[/C][C] 15.93[/C][C] 1.074[/C][/ROW]
[ROW][C]93[/C][C] 15[/C][C] 15.44[/C][C]-0.4377[/C][/ROW]
[ROW][C]94[/C][C] 16[/C][C] 15.82[/C][C] 0.181[/C][/ROW]
[ROW][C]95[/C][C] 18[/C][C] 15.33[/C][C] 2.669[/C][/ROW]
[ROW][C]96[/C][C] 18[/C][C] 16.2[/C][C] 1.795[/C][/ROW]
[ROW][C]97[/C][C] 16[/C][C] 15.6[/C][C] 0.3982[/C][/ROW]
[ROW][C]98[/C][C] 17[/C][C] 15.5[/C][C] 1.505[/C][/ROW]
[ROW][C]99[/C][C] 15[/C][C] 15.71[/C][C]-0.7107[/C][/ROW]
[ROW][C]100[/C][C] 13[/C][C] 15.6[/C][C]-2.602[/C][/ROW]
[ROW][C]101[/C][C] 15[/C][C] 15.44[/C][C]-0.442[/C][/ROW]
[ROW][C]102[/C][C] 17[/C][C] 15.93[/C][C] 1.074[/C][/ROW]
[ROW][C]103[/C][C] 16[/C][C] 15.17[/C][C] 0.8328[/C][/ROW]
[ROW][C]104[/C][C] 16[/C][C] 15.33[/C][C] 0.6688[/C][/ROW]
[ROW][C]105[/C][C] 15[/C][C] 15.66[/C][C]-0.6551[/C][/ROW]
[ROW][C]106[/C][C] 16[/C][C] 15.28[/C][C] 0.722[/C][/ROW]
[ROW][C]107[/C][C] 16[/C][C] 15.36[/C][C] 0.6409[/C][/ROW]
[ROW][C]108[/C][C] 14[/C][C] 15.36[/C][C]-1.361[/C][/ROW]
[ROW][C]109[/C][C] 15[/C][C] 14.95[/C][C] 0.04582[/C][/ROW]
[ROW][C]110[/C][C] 12[/C][C] 15.55[/C][C]-3.55[/C][/ROW]
[ROW][C]111[/C][C] 19[/C][C] 15.66[/C][C] 3.341[/C][/ROW]
[ROW][C]112[/C][C] 16[/C][C] 15.44[/C][C] 0.5623[/C][/ROW]
[ROW][C]113[/C][C] 16[/C][C] 15.6[/C][C] 0.3982[/C][/ROW]
[ROW][C]114[/C][C] 17[/C][C] 16.39[/C][C] 0.606[/C][/ROW]
[ROW][C]115[/C][C] 16[/C][C] 15.93[/C][C] 0.07436[/C][/ROW]
[ROW][C]116[/C][C] 14[/C][C] 15.6[/C][C]-1.602[/C][/ROW]
[ROW][C]117[/C][C] 15[/C][C] 15.2[/C][C]-0.1968[/C][/ROW]
[ROW][C]118[/C][C] 14[/C][C] 15.41[/C][C]-1.414[/C][/ROW]
[ROW][C]119[/C][C] 16[/C][C] 15.6[/C][C] 0.3982[/C][/ROW]
[ROW][C]120[/C][C] 15[/C][C] 15.76[/C][C]-0.7616[/C][/ROW]
[ROW][C]121[/C][C] 17[/C][C] 15.28[/C][C] 1.722[/C][/ROW]
[ROW][C]122[/C][C] 15[/C][C] 15.28[/C][C]-0.278[/C][/ROW]
[ROW][C]123[/C][C] 16[/C][C] 15.31[/C][C] 0.6942[/C][/ROW]
[ROW][C]124[/C][C] 16[/C][C] 15.77[/C][C] 0.23[/C][/ROW]
[ROW][C]125[/C][C] 15[/C][C] 15.68[/C][C]-0.6847[/C][/ROW]
[ROW][C]126[/C][C] 15[/C][C] 15.6[/C][C]-0.6018[/C][/ROW]
[ROW][C]127[/C][C] 11[/C][C] 15.28[/C][C]-4.278[/C][/ROW]
[ROW][C]128[/C][C] 16[/C][C] 15.11[/C][C] 0.8861[/C][/ROW]
[ROW][C]129[/C][C] 18[/C][C] 15.82[/C][C] 2.181[/C][/ROW]
[ROW][C]130[/C][C] 13[/C][C] 15.68[/C][C]-2.683[/C][/ROW]
[ROW][C]131[/C][C] 11[/C][C] 16.14[/C][C]-5.143[/C][/ROW]
[ROW][C]132[/C][C] 16[/C][C] 15.36[/C][C] 0.6391[/C][/ROW]
[ROW][C]133[/C][C] 18[/C][C] 15.55[/C][C] 2.452[/C][/ROW]
[ROW][C]134[/C][C] 15[/C][C] 15.39[/C][C]-0.3887[/C][/ROW]
[ROW][C]135[/C][C] 19[/C][C] 16.03[/C][C] 2.968[/C][/ROW]
[ROW][C]136[/C][C] 17[/C][C] 16.2[/C][C] 0.7954[/C][/ROW]
[ROW][C]137[/C][C] 13[/C][C] 15.6[/C][C]-2.602[/C][/ROW]
[ROW][C]138[/C][C] 14[/C][C] 16.14[/C][C]-2.143[/C][/ROW]
[ROW][C]139[/C][C] 16[/C][C] 14.63[/C][C] 1.37[/C][/ROW]
[ROW][C]140[/C][C] 13[/C][C] 15.28[/C][C]-2.278[/C][/ROW]
[ROW][C]141[/C][C] 17[/C][C] 15.77[/C][C] 1.234[/C][/ROW]
[ROW][C]142[/C][C] 14[/C][C] 15.79[/C][C]-1.791[/C][/ROW]
[ROW][C]143[/C][C] 19[/C][C] 15.23[/C][C] 3.769[/C][/ROW]
[ROW][C]144[/C][C] 14[/C][C] 15.76[/C][C]-1.762[/C][/ROW]
[ROW][C]145[/C][C] 16[/C][C] 15.11[/C][C] 0.8861[/C][/ROW]
[ROW][C]146[/C][C] 12[/C][C] 15.01[/C][C]-3.007[/C][/ROW]
[ROW][C]147[/C][C] 16[/C][C] 15.5[/C][C] 0.5048[/C][/ROW]
[ROW][C]148[/C][C] 16[/C][C] 15.11[/C][C] 0.8861[/C][/ROW]
[ROW][C]149[/C][C] 15[/C][C] 15.33[/C][C]-0.3312[/C][/ROW]
[ROW][C]150[/C][C] 12[/C][C] 15.04[/C][C]-3.037[/C][/ROW]
[ROW][C]151[/C][C] 15[/C][C] 15.28[/C][C]-0.278[/C][/ROW]
[ROW][C]152[/C][C] 17[/C][C] 14.95[/C][C] 2.046[/C][/ROW]
[ROW][C]153[/C][C] 14[/C][C] 15.88[/C][C]-1.881[/C][/ROW]
[ROW][C]154[/C][C] 15[/C][C] 15.06[/C][C]-0.06067[/C][/ROW]
[ROW][C]155[/C][C] 18[/C][C] 16.2[/C][C] 1.8[/C][/ROW]
[ROW][C]156[/C][C] 15[/C][C] 14.95[/C][C] 0.04582[/C][/ROW]
[ROW][C]157[/C][C] 18[/C][C] 15.47[/C][C] 2.533[/C][/ROW]
[ROW][C]158[/C][C] 15[/C][C] 15.71[/C][C]-0.7083[/C][/ROW]
[ROW][C]159[/C][C] 15[/C][C] 15.77[/C][C]-0.7658[/C][/ROW]
[ROW][C]160[/C][C] 16[/C][C] 15.66[/C][C] 0.3449[/C][/ROW]
[ROW][C]161[/C][C] 13[/C][C] 14.95[/C][C]-1.954[/C][/ROW]
[ROW][C]162[/C][C] 16[/C][C] 15.33[/C][C] 0.6688[/C][/ROW]
[ROW][C]163[/C][C] 14[/C][C] 15.41[/C][C]-1.414[/C][/ROW]
[ROW][C]164[/C][C] 16[/C][C] 16.01[/C][C]-0.01025[/C][/ROW]
[/TABLE]
Source: https://freestatistics.org/blog/index.php?pk=297906&T=4

Globally Unique Identifier (entire table): ba.freestatistics.org/blog/index.php?pk=297906&T=4

As an alternative you can also use a QR Code:  

The GUIDs for individual cells are displayed in the table below:

Multiple Linear Regression - Actuals, Interpolation, and Residuals
Time or IndexActualsInterpolationForecastResidualsPrediction Error
1 13 14.95-1.954
2 16 15.93 0.07023
3 17 15.28 1.722
4 15 15.74-0.738
5 16 15.68 0.3153
6 16 15.44 0.5623
7 18 15.44 2.556
8 16 15.6 0.3982
9 17 15.6 1.398
10 17 15.01 1.993
11 17 15.58 1.424
12 15 15.77-0.7682
13 16 15.36 0.6391
14 14 15.79-1.789
15 16 15.33 0.6688
16 17 15.58 1.424
17 16 15.74 0.262
18 15 15.33-0.3312
19 17 15.58 1.424
20 16 15.74 0.2639
21 15 15.31-0.3101
22 16 15.98 0.02112
23 15 15.77-0.7658
24 17 15.28 1.722
25 14 15.82-1.819
26 16 15.66 0.3449
27 15 15.47-0.4674
28 16 14.63 1.37
29 16 15.76 0.2384
30 13 14.63-1.63
31 15 15.6-0.6018
32 17 15.6 1.398
33 15 15.04-0.03708
34 13 16.11-3.115
35 17 15.82 1.181
36 15 15.71-0.7125
37 14 15.44-1.438
38 14 15.66-1.655
39 18 15.33 2.669
40 15 15.6-0.6018
41 17 15.28 1.722
42 13 14.95-1.954
43 16 15.17 0.8328
44 15 15.28-0.278
45 15 15.6-0.6018
46 16 15.68 0.3153
47 13 14.93-1.929
48 17 15.33 1.669
49 18 15.71 2.287
50 18 15.66 2.345
51 11 15.69-4.687
52 14 15.85-1.849
53 13 15.39-2.393
54 15 15.74-0.738
55 17 15.66 1.345
56 16 15.28 0.722
57 15 15.47-0.4674
58 17 15.71 1.292
59 16 15.6 0.3982
60 16 14.95 1.046
61 16 15.01 0.9926
62 15 15.34-0.3355
63 12 15.06-3.061
64 17 15.12 1.882
65 14 15.11-1.114
66 14 15.29-1.286
67 16 14.93 1.07
68 15 15.33-0.3312
69 15 14.95 0.04582
70 14 15.09-1.095
71 13 15.6-2.602
72 18 15.8 2.202
73 15 15.41-0.4141
74 16 15.07 0.9308
75 14 15.58-1.576
76 15 14.69 0.3122
77 17 15.93 1.074
78 16 15.28 0.722
79 10 15.34-5.335
80 16 15.77 0.2342
81 17 15.6 1.398
82 17 16.06 0.94
83 20 15.71 4.287
84 17 16.09 0.9146
85 18 15.6 2.398
86 15 15.6-0.6018
87 17 15.66 1.341
88 14 15.71-1.713
89 15 15.55-0.5485
90 17 15.82 1.177
91 16 16.14-0.1429
92 17 15.93 1.074
93 15 15.44-0.4377
94 16 15.82 0.181
95 18 15.33 2.669
96 18 16.2 1.795
97 16 15.6 0.3982
98 17 15.5 1.505
99 15 15.71-0.7107
100 13 15.6-2.602
101 15 15.44-0.442
102 17 15.93 1.074
103 16 15.17 0.8328
104 16 15.33 0.6688
105 15 15.66-0.6551
106 16 15.28 0.722
107 16 15.36 0.6409
108 14 15.36-1.361
109 15 14.95 0.04582
110 12 15.55-3.55
111 19 15.66 3.341
112 16 15.44 0.5623
113 16 15.6 0.3982
114 17 16.39 0.606
115 16 15.93 0.07436
116 14 15.6-1.602
117 15 15.2-0.1968
118 14 15.41-1.414
119 16 15.6 0.3982
120 15 15.76-0.7616
121 17 15.28 1.722
122 15 15.28-0.278
123 16 15.31 0.6942
124 16 15.77 0.23
125 15 15.68-0.6847
126 15 15.6-0.6018
127 11 15.28-4.278
128 16 15.11 0.8861
129 18 15.82 2.181
130 13 15.68-2.683
131 11 16.14-5.143
132 16 15.36 0.6391
133 18 15.55 2.452
134 15 15.39-0.3887
135 19 16.03 2.968
136 17 16.2 0.7954
137 13 15.6-2.602
138 14 16.14-2.143
139 16 14.63 1.37
140 13 15.28-2.278
141 17 15.77 1.234
142 14 15.79-1.791
143 19 15.23 3.769
144 14 15.76-1.762
145 16 15.11 0.8861
146 12 15.01-3.007
147 16 15.5 0.5048
148 16 15.11 0.8861
149 15 15.33-0.3312
150 12 15.04-3.037
151 15 15.28-0.278
152 17 14.95 2.046
153 14 15.88-1.881
154 15 15.06-0.06067
155 18 16.2 1.8
156 15 14.95 0.04582
157 18 15.47 2.533
158 15 15.71-0.7083
159 15 15.77-0.7658
160 16 15.66 0.3449
161 13 14.95-1.954
162 16 15.33 0.6688
163 14 15.41-1.414
164 16 16.01-0.01025


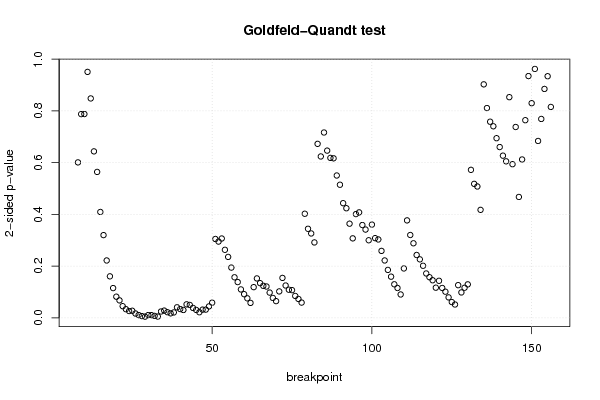
Goldfeld-Quandt test for Heteroskedasticity
p-valuesAlternative Hypothesis
breakpoint indexgreater2-sidedless
8 0.6995 0.601 0.3005
9 0.6062 0.7877 0.3938
10 0.606 0.788 0.394
11 0.5245 0.951 0.4755
12 0.4242 0.8483 0.5758
13 0.3218 0.6436 0.6782
14 0.282 0.564 0.718
15 0.2046 0.4091 0.7954
16 0.1598 0.3196 0.8402
17 0.1108 0.2216 0.8892
18 0.08011 0.1602 0.9199
19 0.05742 0.1148 0.9426
20 0.04073 0.08146 0.9593
21 0.03369 0.06738 0.9663
22 0.0224 0.04479 0.9776
23 0.01657 0.03314 0.9834
24 0.01301 0.02601 0.987
25 0.01354 0.02709 0.9865
26 0.008228 0.01646 0.9918
27 0.005209 0.01042 0.9948
28 0.003284 0.006569 0.9967
29 0.002147 0.004295 0.9979
30 0.005238 0.01048 0.9948
31 0.005136 0.01027 0.9949
32 0.003586 0.007172 0.9964
33 0.002319 0.004638 0.9977
34 0.01208 0.02417 0.9879
35 0.01387 0.02774 0.9861
36 0.01072 0.02144 0.9893
37 0.00858 0.01716 0.9914
38 0.01031 0.02062 0.9897
39 0.02022 0.04045 0.9798
40 0.01684 0.03368 0.9832
41 0.01504 0.03008 0.985
42 0.02598 0.05196 0.974
43 0.02477 0.04954 0.9752
44 0.01899 0.03799 0.981
45 0.01512 0.03024 0.9849
46 0.01066 0.02133 0.9893
47 0.01572 0.03143 0.9843
48 0.01572 0.03144 0.9843
49 0.02196 0.04392 0.978
50 0.02914 0.05828 0.9709
51 0.1524 0.3048 0.8476
52 0.1474 0.2947 0.8526
53 0.1533 0.3066 0.8467
54 0.1314 0.2628 0.8686
55 0.1177 0.2353 0.8823
56 0.09702 0.194 0.903
57 0.07828 0.1566 0.9217
58 0.06902 0.138 0.931
59 0.05481 0.1096 0.9452
60 0.04563 0.09127 0.9544
61 0.03764 0.07527 0.9624
62 0.02876 0.05752 0.9712
63 0.05921 0.1184 0.9408
64 0.07606 0.1521 0.9239
65 0.06702 0.134 0.933
66 0.06177 0.1235 0.9382
67 0.06043 0.1209 0.9396
68 0.04871 0.09741 0.9513
69 0.03832 0.07663 0.9617
70 0.03221 0.06442 0.9678
71 0.051 0.102 0.949
72 0.07707 0.1541 0.9229
73 0.0624 0.1248 0.9376
74 0.0542 0.1084 0.9458
75 0.05343 0.1069 0.9466
76 0.04215 0.0843 0.9578
77 0.03642 0.07284 0.9636
78 0.02932 0.05864 0.9707
79 0.2011 0.4023 0.7989
80 0.1721 0.3441 0.8279
81 0.163 0.3261 0.837
82 0.1457 0.2914 0.8543
83 0.3363 0.6727 0.6637
84 0.3119 0.6239 0.6881
85 0.3583 0.7166 0.6417
86 0.3233 0.6465 0.6767
87 0.3092 0.6183 0.6908
88 0.3084 0.6167 0.6916
89 0.2751 0.5503 0.7249
90 0.2572 0.5144 0.7428
91 0.2216 0.4432 0.7784
92 0.2118 0.4236 0.7882
93 0.1819 0.3638 0.8181
94 0.1536 0.3072 0.8464
95 0.2005 0.401 0.7995
96 0.2038 0.4076 0.7962
97 0.1793 0.3587 0.8207
98 0.1706 0.3412 0.8294
99 0.1499 0.2998 0.8501
100 0.1802 0.3603 0.8198
101 0.154 0.308 0.846
102 0.1514 0.3028 0.8486
103 0.1293 0.2586 0.8707
104 0.1108 0.2217 0.8892
105 0.09249 0.185 0.9075
106 0.07945 0.1589 0.9206
107 0.06474 0.1295 0.9353
108 0.05758 0.1152 0.9424
109 0.04506 0.09012 0.9549
110 0.09536 0.1907 0.9046
111 0.1883 0.3767 0.8117
112 0.1601 0.3201 0.8399
113 0.1441 0.2881 0.8559
114 0.1214 0.2429 0.8786
115 0.113 0.226 0.887
116 0.1005 0.2011 0.8995
117 0.08564 0.1713 0.9144
118 0.07849 0.157 0.9215
119 0.07257 0.1451 0.9274
120 0.05815 0.1163 0.9419
121 0.07148 0.143 0.9285
122 0.05761 0.1152 0.9424
123 0.05041 0.1008 0.9496
124 0.03942 0.07884 0.9606
125 0.03044 0.06088 0.9696
126 0.0256 0.0512 0.9744
127 0.06302 0.126 0.937
128 0.04899 0.09797 0.951
129 0.05807 0.1161 0.9419
130 0.06459 0.1292 0.9354
131 0.286 0.572 0.714
132 0.259 0.5179 0.741
133 0.2539 0.5077 0.7461
134 0.2087 0.4174 0.7913
135 0.4514 0.9029 0.5486
136 0.4056 0.8112 0.5944
137 0.3791 0.7582 0.6209
138 0.3703 0.7407 0.6297
139 0.3472 0.6945 0.6528
140 0.3302 0.6603 0.6698
141 0.3135 0.627 0.6865
142 0.3025 0.6051 0.6975
143 0.5734 0.8532 0.4266
144 0.703 0.5939 0.2969
145 0.6311 0.7378 0.3689
146 0.7664 0.4672 0.2336
147 0.6939 0.6122 0.3061
148 0.6179 0.7641 0.3821
149 0.5326 0.9348 0.4674
150 0.585 0.8299 0.415
151 0.4812 0.9624 0.5188
152 0.6581 0.6838 0.3419
153 0.6155 0.7689 0.3845
154 0.5575 0.885 0.4425
155 0.5329 0.9342 0.4671
156 0.4077 0.8154 0.5923

\begin{tabular}{lllllllll}
\hline
Goldfeld-Quandt test for Heteroskedasticity \tabularnewline
p-values & Alternative Hypothesis \tabularnewline
breakpoint index & greater & 2-sided & less \tabularnewline
8 &  0.6995 &  0.601 &  0.3005 \tabularnewline
9 &  0.6062 &  0.7877 &  0.3938 \tabularnewline
10 &  0.606 &  0.788 &  0.394 \tabularnewline
11 &  0.5245 &  0.951 &  0.4755 \tabularnewline
12 &  0.4242 &  0.8483 &  0.5758 \tabularnewline
13 &  0.3218 &  0.6436 &  0.6782 \tabularnewline
14 &  0.282 &  0.564 &  0.718 \tabularnewline
15 &  0.2046 &  0.4091 &  0.7954 \tabularnewline
16 &  0.1598 &  0.3196 &  0.8402 \tabularnewline
17 &  0.1108 &  0.2216 &  0.8892 \tabularnewline
18 &  0.08011 &  0.1602 &  0.9199 \tabularnewline
19 &  0.05742 &  0.1148 &  0.9426 \tabularnewline
20 &  0.04073 &  0.08146 &  0.9593 \tabularnewline
21 &  0.03369 &  0.06738 &  0.9663 \tabularnewline
22 &  0.0224 &  0.04479 &  0.9776 \tabularnewline
23 &  0.01657 &  0.03314 &  0.9834 \tabularnewline
24 &  0.01301 &  0.02601 &  0.987 \tabularnewline
25 &  0.01354 &  0.02709 &  0.9865 \tabularnewline
26 &  0.008228 &  0.01646 &  0.9918 \tabularnewline
27 &  0.005209 &  0.01042 &  0.9948 \tabularnewline
28 &  0.003284 &  0.006569 &  0.9967 \tabularnewline
29 &  0.002147 &  0.004295 &  0.9979 \tabularnewline
30 &  0.005238 &  0.01048 &  0.9948 \tabularnewline
31 &  0.005136 &  0.01027 &  0.9949 \tabularnewline
32 &  0.003586 &  0.007172 &  0.9964 \tabularnewline
33 &  0.002319 &  0.004638 &  0.9977 \tabularnewline
34 &  0.01208 &  0.02417 &  0.9879 \tabularnewline
35 &  0.01387 &  0.02774 &  0.9861 \tabularnewline
36 &  0.01072 &  0.02144 &  0.9893 \tabularnewline
37 &  0.00858 &  0.01716 &  0.9914 \tabularnewline
38 &  0.01031 &  0.02062 &  0.9897 \tabularnewline
39 &  0.02022 &  0.04045 &  0.9798 \tabularnewline
40 &  0.01684 &  0.03368 &  0.9832 \tabularnewline
41 &  0.01504 &  0.03008 &  0.985 \tabularnewline
42 &  0.02598 &  0.05196 &  0.974 \tabularnewline
43 &  0.02477 &  0.04954 &  0.9752 \tabularnewline
44 &  0.01899 &  0.03799 &  0.981 \tabularnewline
45 &  0.01512 &  0.03024 &  0.9849 \tabularnewline
46 &  0.01066 &  0.02133 &  0.9893 \tabularnewline
47 &  0.01572 &  0.03143 &  0.9843 \tabularnewline
48 &  0.01572 &  0.03144 &  0.9843 \tabularnewline
49 &  0.02196 &  0.04392 &  0.978 \tabularnewline
50 &  0.02914 &  0.05828 &  0.9709 \tabularnewline
51 &  0.1524 &  0.3048 &  0.8476 \tabularnewline
52 &  0.1474 &  0.2947 &  0.8526 \tabularnewline
53 &  0.1533 &  0.3066 &  0.8467 \tabularnewline
54 &  0.1314 &  0.2628 &  0.8686 \tabularnewline
55 &  0.1177 &  0.2353 &  0.8823 \tabularnewline
56 &  0.09702 &  0.194 &  0.903 \tabularnewline
57 &  0.07828 &  0.1566 &  0.9217 \tabularnewline
58 &  0.06902 &  0.138 &  0.931 \tabularnewline
59 &  0.05481 &  0.1096 &  0.9452 \tabularnewline
60 &  0.04563 &  0.09127 &  0.9544 \tabularnewline
61 &  0.03764 &  0.07527 &  0.9624 \tabularnewline
62 &  0.02876 &  0.05752 &  0.9712 \tabularnewline
63 &  0.05921 &  0.1184 &  0.9408 \tabularnewline
64 &  0.07606 &  0.1521 &  0.9239 \tabularnewline
65 &  0.06702 &  0.134 &  0.933 \tabularnewline
66 &  0.06177 &  0.1235 &  0.9382 \tabularnewline
67 &  0.06043 &  0.1209 &  0.9396 \tabularnewline
68 &  0.04871 &  0.09741 &  0.9513 \tabularnewline
69 &  0.03832 &  0.07663 &  0.9617 \tabularnewline
70 &  0.03221 &  0.06442 &  0.9678 \tabularnewline
71 &  0.051 &  0.102 &  0.949 \tabularnewline
72 &  0.07707 &  0.1541 &  0.9229 \tabularnewline
73 &  0.0624 &  0.1248 &  0.9376 \tabularnewline
74 &  0.0542 &  0.1084 &  0.9458 \tabularnewline
75 &  0.05343 &  0.1069 &  0.9466 \tabularnewline
76 &  0.04215 &  0.0843 &  0.9578 \tabularnewline
77 &  0.03642 &  0.07284 &  0.9636 \tabularnewline
78 &  0.02932 &  0.05864 &  0.9707 \tabularnewline
79 &  0.2011 &  0.4023 &  0.7989 \tabularnewline
80 &  0.1721 &  0.3441 &  0.8279 \tabularnewline
81 &  0.163 &  0.3261 &  0.837 \tabularnewline
82 &  0.1457 &  0.2914 &  0.8543 \tabularnewline
83 &  0.3363 &  0.6727 &  0.6637 \tabularnewline
84 &  0.3119 &  0.6239 &  0.6881 \tabularnewline
85 &  0.3583 &  0.7166 &  0.6417 \tabularnewline
86 &  0.3233 &  0.6465 &  0.6767 \tabularnewline
87 &  0.3092 &  0.6183 &  0.6908 \tabularnewline
88 &  0.3084 &  0.6167 &  0.6916 \tabularnewline
89 &  0.2751 &  0.5503 &  0.7249 \tabularnewline
90 &  0.2572 &  0.5144 &  0.7428 \tabularnewline
91 &  0.2216 &  0.4432 &  0.7784 \tabularnewline
92 &  0.2118 &  0.4236 &  0.7882 \tabularnewline
93 &  0.1819 &  0.3638 &  0.8181 \tabularnewline
94 &  0.1536 &  0.3072 &  0.8464 \tabularnewline
95 &  0.2005 &  0.401 &  0.7995 \tabularnewline
96 &  0.2038 &  0.4076 &  0.7962 \tabularnewline
97 &  0.1793 &  0.3587 &  0.8207 \tabularnewline
98 &  0.1706 &  0.3412 &  0.8294 \tabularnewline
99 &  0.1499 &  0.2998 &  0.8501 \tabularnewline
100 &  0.1802 &  0.3603 &  0.8198 \tabularnewline
101 &  0.154 &  0.308 &  0.846 \tabularnewline
102 &  0.1514 &  0.3028 &  0.8486 \tabularnewline
103 &  0.1293 &  0.2586 &  0.8707 \tabularnewline
104 &  0.1108 &  0.2217 &  0.8892 \tabularnewline
105 &  0.09249 &  0.185 &  0.9075 \tabularnewline
106 &  0.07945 &  0.1589 &  0.9206 \tabularnewline
107 &  0.06474 &  0.1295 &  0.9353 \tabularnewline
108 &  0.05758 &  0.1152 &  0.9424 \tabularnewline
109 &  0.04506 &  0.09012 &  0.9549 \tabularnewline
110 &  0.09536 &  0.1907 &  0.9046 \tabularnewline
111 &  0.1883 &  0.3767 &  0.8117 \tabularnewline
112 &  0.1601 &  0.3201 &  0.8399 \tabularnewline
113 &  0.1441 &  0.2881 &  0.8559 \tabularnewline
114 &  0.1214 &  0.2429 &  0.8786 \tabularnewline
115 &  0.113 &  0.226 &  0.887 \tabularnewline
116 &  0.1005 &  0.2011 &  0.8995 \tabularnewline
117 &  0.08564 &  0.1713 &  0.9144 \tabularnewline
118 &  0.07849 &  0.157 &  0.9215 \tabularnewline
119 &  0.07257 &  0.1451 &  0.9274 \tabularnewline
120 &  0.05815 &  0.1163 &  0.9419 \tabularnewline
121 &  0.07148 &  0.143 &  0.9285 \tabularnewline
122 &  0.05761 &  0.1152 &  0.9424 \tabularnewline
123 &  0.05041 &  0.1008 &  0.9496 \tabularnewline
124 &  0.03942 &  0.07884 &  0.9606 \tabularnewline
125 &  0.03044 &  0.06088 &  0.9696 \tabularnewline
126 &  0.0256 &  0.0512 &  0.9744 \tabularnewline
127 &  0.06302 &  0.126 &  0.937 \tabularnewline
128 &  0.04899 &  0.09797 &  0.951 \tabularnewline
129 &  0.05807 &  0.1161 &  0.9419 \tabularnewline
130 &  0.06459 &  0.1292 &  0.9354 \tabularnewline
131 &  0.286 &  0.572 &  0.714 \tabularnewline
132 &  0.259 &  0.5179 &  0.741 \tabularnewline
133 &  0.2539 &  0.5077 &  0.7461 \tabularnewline
134 &  0.2087 &  0.4174 &  0.7913 \tabularnewline
135 &  0.4514 &  0.9029 &  0.5486 \tabularnewline
136 &  0.4056 &  0.8112 &  0.5944 \tabularnewline
137 &  0.3791 &  0.7582 &  0.6209 \tabularnewline
138 &  0.3703 &  0.7407 &  0.6297 \tabularnewline
139 &  0.3472 &  0.6945 &  0.6528 \tabularnewline
140 &  0.3302 &  0.6603 &  0.6698 \tabularnewline
141 &  0.3135 &  0.627 &  0.6865 \tabularnewline
142 &  0.3025 &  0.6051 &  0.6975 \tabularnewline
143 &  0.5734 &  0.8532 &  0.4266 \tabularnewline
144 &  0.703 &  0.5939 &  0.2969 \tabularnewline
145 &  0.6311 &  0.7378 &  0.3689 \tabularnewline
146 &  0.7664 &  0.4672 &  0.2336 \tabularnewline
147 &  0.6939 &  0.6122 &  0.3061 \tabularnewline
148 &  0.6179 &  0.7641 &  0.3821 \tabularnewline
149 &  0.5326 &  0.9348 &  0.4674 \tabularnewline
150 &  0.585 &  0.8299 &  0.415 \tabularnewline
151 &  0.4812 &  0.9624 &  0.5188 \tabularnewline
152 &  0.6581 &  0.6838 &  0.3419 \tabularnewline
153 &  0.6155 &  0.7689 &  0.3845 \tabularnewline
154 &  0.5575 &  0.885 &  0.4425 \tabularnewline
155 &  0.5329 &  0.9342 &  0.4671 \tabularnewline
156 &  0.4077 &  0.8154 &  0.5923 \tabularnewline
\hline
\end{tabular}
%Source: https://freestatistics.org/blog/index.php?pk=297906&T=5

[TABLE]
[ROW][C]Goldfeld-Quandt test for Heteroskedasticity[/C][/ROW]
[ROW][C]p-values[/C][C]Alternative Hypothesis[/C][/ROW]
[ROW][C]breakpoint index[/C][C]greater[/C][C]2-sided[/C][C]less[/C][/ROW]
[ROW][C]8[/C][C] 0.6995[/C][C] 0.601[/C][C] 0.3005[/C][/ROW]
[ROW][C]9[/C][C] 0.6062[/C][C] 0.7877[/C][C] 0.3938[/C][/ROW]
[ROW][C]10[/C][C] 0.606[/C][C] 0.788[/C][C] 0.394[/C][/ROW]
[ROW][C]11[/C][C] 0.5245[/C][C] 0.951[/C][C] 0.4755[/C][/ROW]
[ROW][C]12[/C][C] 0.4242[/C][C] 0.8483[/C][C] 0.5758[/C][/ROW]
[ROW][C]13[/C][C] 0.3218[/C][C] 0.6436[/C][C] 0.6782[/C][/ROW]
[ROW][C]14[/C][C] 0.282[/C][C] 0.564[/C][C] 0.718[/C][/ROW]
[ROW][C]15[/C][C] 0.2046[/C][C] 0.4091[/C][C] 0.7954[/C][/ROW]
[ROW][C]16[/C][C] 0.1598[/C][C] 0.3196[/C][C] 0.8402[/C][/ROW]
[ROW][C]17[/C][C] 0.1108[/C][C] 0.2216[/C][C] 0.8892[/C][/ROW]
[ROW][C]18[/C][C] 0.08011[/C][C] 0.1602[/C][C] 0.9199[/C][/ROW]
[ROW][C]19[/C][C] 0.05742[/C][C] 0.1148[/C][C] 0.9426[/C][/ROW]
[ROW][C]20[/C][C] 0.04073[/C][C] 0.08146[/C][C] 0.9593[/C][/ROW]
[ROW][C]21[/C][C] 0.03369[/C][C] 0.06738[/C][C] 0.9663[/C][/ROW]
[ROW][C]22[/C][C] 0.0224[/C][C] 0.04479[/C][C] 0.9776[/C][/ROW]
[ROW][C]23[/C][C] 0.01657[/C][C] 0.03314[/C][C] 0.9834[/C][/ROW]
[ROW][C]24[/C][C] 0.01301[/C][C] 0.02601[/C][C] 0.987[/C][/ROW]
[ROW][C]25[/C][C] 0.01354[/C][C] 0.02709[/C][C] 0.9865[/C][/ROW]
[ROW][C]26[/C][C] 0.008228[/C][C] 0.01646[/C][C] 0.9918[/C][/ROW]
[ROW][C]27[/C][C] 0.005209[/C][C] 0.01042[/C][C] 0.9948[/C][/ROW]
[ROW][C]28[/C][C] 0.003284[/C][C] 0.006569[/C][C] 0.9967[/C][/ROW]
[ROW][C]29[/C][C] 0.002147[/C][C] 0.004295[/C][C] 0.9979[/C][/ROW]
[ROW][C]30[/C][C] 0.005238[/C][C] 0.01048[/C][C] 0.9948[/C][/ROW]
[ROW][C]31[/C][C] 0.005136[/C][C] 0.01027[/C][C] 0.9949[/C][/ROW]
[ROW][C]32[/C][C] 0.003586[/C][C] 0.007172[/C][C] 0.9964[/C][/ROW]
[ROW][C]33[/C][C] 0.002319[/C][C] 0.004638[/C][C] 0.9977[/C][/ROW]
[ROW][C]34[/C][C] 0.01208[/C][C] 0.02417[/C][C] 0.9879[/C][/ROW]
[ROW][C]35[/C][C] 0.01387[/C][C] 0.02774[/C][C] 0.9861[/C][/ROW]
[ROW][C]36[/C][C] 0.01072[/C][C] 0.02144[/C][C] 0.9893[/C][/ROW]
[ROW][C]37[/C][C] 0.00858[/C][C] 0.01716[/C][C] 0.9914[/C][/ROW]
[ROW][C]38[/C][C] 0.01031[/C][C] 0.02062[/C][C] 0.9897[/C][/ROW]
[ROW][C]39[/C][C] 0.02022[/C][C] 0.04045[/C][C] 0.9798[/C][/ROW]
[ROW][C]40[/C][C] 0.01684[/C][C] 0.03368[/C][C] 0.9832[/C][/ROW]
[ROW][C]41[/C][C] 0.01504[/C][C] 0.03008[/C][C] 0.985[/C][/ROW]
[ROW][C]42[/C][C] 0.02598[/C][C] 0.05196[/C][C] 0.974[/C][/ROW]
[ROW][C]43[/C][C] 0.02477[/C][C] 0.04954[/C][C] 0.9752[/C][/ROW]
[ROW][C]44[/C][C] 0.01899[/C][C] 0.03799[/C][C] 0.981[/C][/ROW]
[ROW][C]45[/C][C] 0.01512[/C][C] 0.03024[/C][C] 0.9849[/C][/ROW]
[ROW][C]46[/C][C] 0.01066[/C][C] 0.02133[/C][C] 0.9893[/C][/ROW]
[ROW][C]47[/C][C] 0.01572[/C][C] 0.03143[/C][C] 0.9843[/C][/ROW]
[ROW][C]48[/C][C] 0.01572[/C][C] 0.03144[/C][C] 0.9843[/C][/ROW]
[ROW][C]49[/C][C] 0.02196[/C][C] 0.04392[/C][C] 0.978[/C][/ROW]
[ROW][C]50[/C][C] 0.02914[/C][C] 0.05828[/C][C] 0.9709[/C][/ROW]
[ROW][C]51[/C][C] 0.1524[/C][C] 0.3048[/C][C] 0.8476[/C][/ROW]
[ROW][C]52[/C][C] 0.1474[/C][C] 0.2947[/C][C] 0.8526[/C][/ROW]
[ROW][C]53[/C][C] 0.1533[/C][C] 0.3066[/C][C] 0.8467[/C][/ROW]
[ROW][C]54[/C][C] 0.1314[/C][C] 0.2628[/C][C] 0.8686[/C][/ROW]
[ROW][C]55[/C][C] 0.1177[/C][C] 0.2353[/C][C] 0.8823[/C][/ROW]
[ROW][C]56[/C][C] 0.09702[/C][C] 0.194[/C][C] 0.903[/C][/ROW]
[ROW][C]57[/C][C] 0.07828[/C][C] 0.1566[/C][C] 0.9217[/C][/ROW]
[ROW][C]58[/C][C] 0.06902[/C][C] 0.138[/C][C] 0.931[/C][/ROW]
[ROW][C]59[/C][C] 0.05481[/C][C] 0.1096[/C][C] 0.9452[/C][/ROW]
[ROW][C]60[/C][C] 0.04563[/C][C] 0.09127[/C][C] 0.9544[/C][/ROW]
[ROW][C]61[/C][C] 0.03764[/C][C] 0.07527[/C][C] 0.9624[/C][/ROW]
[ROW][C]62[/C][C] 0.02876[/C][C] 0.05752[/C][C] 0.9712[/C][/ROW]
[ROW][C]63[/C][C] 0.05921[/C][C] 0.1184[/C][C] 0.9408[/C][/ROW]
[ROW][C]64[/C][C] 0.07606[/C][C] 0.1521[/C][C] 0.9239[/C][/ROW]
[ROW][C]65[/C][C] 0.06702[/C][C] 0.134[/C][C] 0.933[/C][/ROW]
[ROW][C]66[/C][C] 0.06177[/C][C] 0.1235[/C][C] 0.9382[/C][/ROW]
[ROW][C]67[/C][C] 0.06043[/C][C] 0.1209[/C][C] 0.9396[/C][/ROW]
[ROW][C]68[/C][C] 0.04871[/C][C] 0.09741[/C][C] 0.9513[/C][/ROW]
[ROW][C]69[/C][C] 0.03832[/C][C] 0.07663[/C][C] 0.9617[/C][/ROW]
[ROW][C]70[/C][C] 0.03221[/C][C] 0.06442[/C][C] 0.9678[/C][/ROW]
[ROW][C]71[/C][C] 0.051[/C][C] 0.102[/C][C] 0.949[/C][/ROW]
[ROW][C]72[/C][C] 0.07707[/C][C] 0.1541[/C][C] 0.9229[/C][/ROW]
[ROW][C]73[/C][C] 0.0624[/C][C] 0.1248[/C][C] 0.9376[/C][/ROW]
[ROW][C]74[/C][C] 0.0542[/C][C] 0.1084[/C][C] 0.9458[/C][/ROW]
[ROW][C]75[/C][C] 0.05343[/C][C] 0.1069[/C][C] 0.9466[/C][/ROW]
[ROW][C]76[/C][C] 0.04215[/C][C] 0.0843[/C][C] 0.9578[/C][/ROW]
[ROW][C]77[/C][C] 0.03642[/C][C] 0.07284[/C][C] 0.9636[/C][/ROW]
[ROW][C]78[/C][C] 0.02932[/C][C] 0.05864[/C][C] 0.9707[/C][/ROW]
[ROW][C]79[/C][C] 0.2011[/C][C] 0.4023[/C][C] 0.7989[/C][/ROW]
[ROW][C]80[/C][C] 0.1721[/C][C] 0.3441[/C][C] 0.8279[/C][/ROW]
[ROW][C]81[/C][C] 0.163[/C][C] 0.3261[/C][C] 0.837[/C][/ROW]
[ROW][C]82[/C][C] 0.1457[/C][C] 0.2914[/C][C] 0.8543[/C][/ROW]
[ROW][C]83[/C][C] 0.3363[/C][C] 0.6727[/C][C] 0.6637[/C][/ROW]
[ROW][C]84[/C][C] 0.3119[/C][C] 0.6239[/C][C] 0.6881[/C][/ROW]
[ROW][C]85[/C][C] 0.3583[/C][C] 0.7166[/C][C] 0.6417[/C][/ROW]
[ROW][C]86[/C][C] 0.3233[/C][C] 0.6465[/C][C] 0.6767[/C][/ROW]
[ROW][C]87[/C][C] 0.3092[/C][C] 0.6183[/C][C] 0.6908[/C][/ROW]
[ROW][C]88[/C][C] 0.3084[/C][C] 0.6167[/C][C] 0.6916[/C][/ROW]
[ROW][C]89[/C][C] 0.2751[/C][C] 0.5503[/C][C] 0.7249[/C][/ROW]
[ROW][C]90[/C][C] 0.2572[/C][C] 0.5144[/C][C] 0.7428[/C][/ROW]
[ROW][C]91[/C][C] 0.2216[/C][C] 0.4432[/C][C] 0.7784[/C][/ROW]
[ROW][C]92[/C][C] 0.2118[/C][C] 0.4236[/C][C] 0.7882[/C][/ROW]
[ROW][C]93[/C][C] 0.1819[/C][C] 0.3638[/C][C] 0.8181[/C][/ROW]
[ROW][C]94[/C][C] 0.1536[/C][C] 0.3072[/C][C] 0.8464[/C][/ROW]
[ROW][C]95[/C][C] 0.2005[/C][C] 0.401[/C][C] 0.7995[/C][/ROW]
[ROW][C]96[/C][C] 0.2038[/C][C] 0.4076[/C][C] 0.7962[/C][/ROW]
[ROW][C]97[/C][C] 0.1793[/C][C] 0.3587[/C][C] 0.8207[/C][/ROW]
[ROW][C]98[/C][C] 0.1706[/C][C] 0.3412[/C][C] 0.8294[/C][/ROW]
[ROW][C]99[/C][C] 0.1499[/C][C] 0.2998[/C][C] 0.8501[/C][/ROW]
[ROW][C]100[/C][C] 0.1802[/C][C] 0.3603[/C][C] 0.8198[/C][/ROW]
[ROW][C]101[/C][C] 0.154[/C][C] 0.308[/C][C] 0.846[/C][/ROW]
[ROW][C]102[/C][C] 0.1514[/C][C] 0.3028[/C][C] 0.8486[/C][/ROW]
[ROW][C]103[/C][C] 0.1293[/C][C] 0.2586[/C][C] 0.8707[/C][/ROW]
[ROW][C]104[/C][C] 0.1108[/C][C] 0.2217[/C][C] 0.8892[/C][/ROW]
[ROW][C]105[/C][C] 0.09249[/C][C] 0.185[/C][C] 0.9075[/C][/ROW]
[ROW][C]106[/C][C] 0.07945[/C][C] 0.1589[/C][C] 0.9206[/C][/ROW]
[ROW][C]107[/C][C] 0.06474[/C][C] 0.1295[/C][C] 0.9353[/C][/ROW]
[ROW][C]108[/C][C] 0.05758[/C][C] 0.1152[/C][C] 0.9424[/C][/ROW]
[ROW][C]109[/C][C] 0.04506[/C][C] 0.09012[/C][C] 0.9549[/C][/ROW]
[ROW][C]110[/C][C] 0.09536[/C][C] 0.1907[/C][C] 0.9046[/C][/ROW]
[ROW][C]111[/C][C] 0.1883[/C][C] 0.3767[/C][C] 0.8117[/C][/ROW]
[ROW][C]112[/C][C] 0.1601[/C][C] 0.3201[/C][C] 0.8399[/C][/ROW]
[ROW][C]113[/C][C] 0.1441[/C][C] 0.2881[/C][C] 0.8559[/C][/ROW]
[ROW][C]114[/C][C] 0.1214[/C][C] 0.2429[/C][C] 0.8786[/C][/ROW]
[ROW][C]115[/C][C] 0.113[/C][C] 0.226[/C][C] 0.887[/C][/ROW]
[ROW][C]116[/C][C] 0.1005[/C][C] 0.2011[/C][C] 0.8995[/C][/ROW]
[ROW][C]117[/C][C] 0.08564[/C][C] 0.1713[/C][C] 0.9144[/C][/ROW]
[ROW][C]118[/C][C] 0.07849[/C][C] 0.157[/C][C] 0.9215[/C][/ROW]
[ROW][C]119[/C][C] 0.07257[/C][C] 0.1451[/C][C] 0.9274[/C][/ROW]
[ROW][C]120[/C][C] 0.05815[/C][C] 0.1163[/C][C] 0.9419[/C][/ROW]
[ROW][C]121[/C][C] 0.07148[/C][C] 0.143[/C][C] 0.9285[/C][/ROW]
[ROW][C]122[/C][C] 0.05761[/C][C] 0.1152[/C][C] 0.9424[/C][/ROW]
[ROW][C]123[/C][C] 0.05041[/C][C] 0.1008[/C][C] 0.9496[/C][/ROW]
[ROW][C]124[/C][C] 0.03942[/C][C] 0.07884[/C][C] 0.9606[/C][/ROW]
[ROW][C]125[/C][C] 0.03044[/C][C] 0.06088[/C][C] 0.9696[/C][/ROW]
[ROW][C]126[/C][C] 0.0256[/C][C] 0.0512[/C][C] 0.9744[/C][/ROW]
[ROW][C]127[/C][C] 0.06302[/C][C] 0.126[/C][C] 0.937[/C][/ROW]
[ROW][C]128[/C][C] 0.04899[/C][C] 0.09797[/C][C] 0.951[/C][/ROW]
[ROW][C]129[/C][C] 0.05807[/C][C] 0.1161[/C][C] 0.9419[/C][/ROW]
[ROW][C]130[/C][C] 0.06459[/C][C] 0.1292[/C][C] 0.9354[/C][/ROW]
[ROW][C]131[/C][C] 0.286[/C][C] 0.572[/C][C] 0.714[/C][/ROW]
[ROW][C]132[/C][C] 0.259[/C][C] 0.5179[/C][C] 0.741[/C][/ROW]
[ROW][C]133[/C][C] 0.2539[/C][C] 0.5077[/C][C] 0.7461[/C][/ROW]
[ROW][C]134[/C][C] 0.2087[/C][C] 0.4174[/C][C] 0.7913[/C][/ROW]
[ROW][C]135[/C][C] 0.4514[/C][C] 0.9029[/C][C] 0.5486[/C][/ROW]
[ROW][C]136[/C][C] 0.4056[/C][C] 0.8112[/C][C] 0.5944[/C][/ROW]
[ROW][C]137[/C][C] 0.3791[/C][C] 0.7582[/C][C] 0.6209[/C][/ROW]
[ROW][C]138[/C][C] 0.3703[/C][C] 0.7407[/C][C] 0.6297[/C][/ROW]
[ROW][C]139[/C][C] 0.3472[/C][C] 0.6945[/C][C] 0.6528[/C][/ROW]
[ROW][C]140[/C][C] 0.3302[/C][C] 0.6603[/C][C] 0.6698[/C][/ROW]
[ROW][C]141[/C][C] 0.3135[/C][C] 0.627[/C][C] 0.6865[/C][/ROW]
[ROW][C]142[/C][C] 0.3025[/C][C] 0.6051[/C][C] 0.6975[/C][/ROW]
[ROW][C]143[/C][C] 0.5734[/C][C] 0.8532[/C][C] 0.4266[/C][/ROW]
[ROW][C]144[/C][C] 0.703[/C][C] 0.5939[/C][C] 0.2969[/C][/ROW]
[ROW][C]145[/C][C] 0.6311[/C][C] 0.7378[/C][C] 0.3689[/C][/ROW]
[ROW][C]146[/C][C] 0.7664[/C][C] 0.4672[/C][C] 0.2336[/C][/ROW]
[ROW][C]147[/C][C] 0.6939[/C][C] 0.6122[/C][C] 0.3061[/C][/ROW]
[ROW][C]148[/C][C] 0.6179[/C][C] 0.7641[/C][C] 0.3821[/C][/ROW]
[ROW][C]149[/C][C] 0.5326[/C][C] 0.9348[/C][C] 0.4674[/C][/ROW]
[ROW][C]150[/C][C] 0.585[/C][C] 0.8299[/C][C] 0.415[/C][/ROW]
[ROW][C]151[/C][C] 0.4812[/C][C] 0.9624[/C][C] 0.5188[/C][/ROW]
[ROW][C]152[/C][C] 0.6581[/C][C] 0.6838[/C][C] 0.3419[/C][/ROW]
[ROW][C]153[/C][C] 0.6155[/C][C] 0.7689[/C][C] 0.3845[/C][/ROW]
[ROW][C]154[/C][C] 0.5575[/C][C] 0.885[/C][C] 0.4425[/C][/ROW]
[ROW][C]155[/C][C] 0.5329[/C][C] 0.9342[/C][C] 0.4671[/C][/ROW]
[ROW][C]156[/C][C] 0.4077[/C][C] 0.8154[/C][C] 0.5923[/C][/ROW]
[/TABLE]
Source: https://freestatistics.org/blog/index.php?pk=297906&T=5

Globally Unique Identifier (entire table): ba.freestatistics.org/blog/index.php?pk=297906&T=5

As an alternative you can also use a QR Code:  

The GUIDs for individual cells are displayed in the table below:

Goldfeld-Quandt test for Heteroskedasticity
p-valuesAlternative Hypothesis
breakpoint indexgreater2-sidedless
8 0.6995 0.601 0.3005
9 0.6062 0.7877 0.3938
10 0.606 0.788 0.394
11 0.5245 0.951 0.4755
12 0.4242 0.8483 0.5758
13 0.3218 0.6436 0.6782
14 0.282 0.564 0.718
15 0.2046 0.4091 0.7954
16 0.1598 0.3196 0.8402
17 0.1108 0.2216 0.8892
18 0.08011 0.1602 0.9199
19 0.05742 0.1148 0.9426
20 0.04073 0.08146 0.9593
21 0.03369 0.06738 0.9663
22 0.0224 0.04479 0.9776
23 0.01657 0.03314 0.9834
24 0.01301 0.02601 0.987
25 0.01354 0.02709 0.9865
26 0.008228 0.01646 0.9918
27 0.005209 0.01042 0.9948
28 0.003284 0.006569 0.9967
29 0.002147 0.004295 0.9979
30 0.005238 0.01048 0.9948
31 0.005136 0.01027 0.9949
32 0.003586 0.007172 0.9964
33 0.002319 0.004638 0.9977
34 0.01208 0.02417 0.9879
35 0.01387 0.02774 0.9861
36 0.01072 0.02144 0.9893
37 0.00858 0.01716 0.9914
38 0.01031 0.02062 0.9897
39 0.02022 0.04045 0.9798
40 0.01684 0.03368 0.9832
41 0.01504 0.03008 0.985
42 0.02598 0.05196 0.974
43 0.02477 0.04954 0.9752
44 0.01899 0.03799 0.981
45 0.01512 0.03024 0.9849
46 0.01066 0.02133 0.9893
47 0.01572 0.03143 0.9843
48 0.01572 0.03144 0.9843
49 0.02196 0.04392 0.978
50 0.02914 0.05828 0.9709
51 0.1524 0.3048 0.8476
52 0.1474 0.2947 0.8526
53 0.1533 0.3066 0.8467
54 0.1314 0.2628 0.8686
55 0.1177 0.2353 0.8823
56 0.09702 0.194 0.903
57 0.07828 0.1566 0.9217
58 0.06902 0.138 0.931
59 0.05481 0.1096 0.9452
60 0.04563 0.09127 0.9544
61 0.03764 0.07527 0.9624
62 0.02876 0.05752 0.9712
63 0.05921 0.1184 0.9408
64 0.07606 0.1521 0.9239
65 0.06702 0.134 0.933
66 0.06177 0.1235 0.9382
67 0.06043 0.1209 0.9396
68 0.04871 0.09741 0.9513
69 0.03832 0.07663 0.9617
70 0.03221 0.06442 0.9678
71 0.051 0.102 0.949
72 0.07707 0.1541 0.9229
73 0.0624 0.1248 0.9376
74 0.0542 0.1084 0.9458
75 0.05343 0.1069 0.9466
76 0.04215 0.0843 0.9578
77 0.03642 0.07284 0.9636
78 0.02932 0.05864 0.9707
79 0.2011 0.4023 0.7989
80 0.1721 0.3441 0.8279
81 0.163 0.3261 0.837
82 0.1457 0.2914 0.8543
83 0.3363 0.6727 0.6637
84 0.3119 0.6239 0.6881
85 0.3583 0.7166 0.6417
86 0.3233 0.6465 0.6767
87 0.3092 0.6183 0.6908
88 0.3084 0.6167 0.6916
89 0.2751 0.5503 0.7249
90 0.2572 0.5144 0.7428
91 0.2216 0.4432 0.7784
92 0.2118 0.4236 0.7882
93 0.1819 0.3638 0.8181
94 0.1536 0.3072 0.8464
95 0.2005 0.401 0.7995
96 0.2038 0.4076 0.7962
97 0.1793 0.3587 0.8207
98 0.1706 0.3412 0.8294
99 0.1499 0.2998 0.8501
100 0.1802 0.3603 0.8198
101 0.154 0.308 0.846
102 0.1514 0.3028 0.8486
103 0.1293 0.2586 0.8707
104 0.1108 0.2217 0.8892
105 0.09249 0.185 0.9075
106 0.07945 0.1589 0.9206
107 0.06474 0.1295 0.9353
108 0.05758 0.1152 0.9424
109 0.04506 0.09012 0.9549
110 0.09536 0.1907 0.9046
111 0.1883 0.3767 0.8117
112 0.1601 0.3201 0.8399
113 0.1441 0.2881 0.8559
114 0.1214 0.2429 0.8786
115 0.113 0.226 0.887
116 0.1005 0.2011 0.8995
117 0.08564 0.1713 0.9144
118 0.07849 0.157 0.9215
119 0.07257 0.1451 0.9274
120 0.05815 0.1163 0.9419
121 0.07148 0.143 0.9285
122 0.05761 0.1152 0.9424
123 0.05041 0.1008 0.9496
124 0.03942 0.07884 0.9606
125 0.03044 0.06088 0.9696
126 0.0256 0.0512 0.9744
127 0.06302 0.126 0.937
128 0.04899 0.09797 0.951
129 0.05807 0.1161 0.9419
130 0.06459 0.1292 0.9354
131 0.286 0.572 0.714
132 0.259 0.5179 0.741
133 0.2539 0.5077 0.7461
134 0.2087 0.4174 0.7913
135 0.4514 0.9029 0.5486
136 0.4056 0.8112 0.5944
137 0.3791 0.7582 0.6209
138 0.3703 0.7407 0.6297
139 0.3472 0.6945 0.6528
140 0.3302 0.6603 0.6698
141 0.3135 0.627 0.6865
142 0.3025 0.6051 0.6975
143 0.5734 0.8532 0.4266
144 0.703 0.5939 0.2969
145 0.6311 0.7378 0.3689
146 0.7664 0.4672 0.2336
147 0.6939 0.6122 0.3061
148 0.6179 0.7641 0.3821
149 0.5326 0.9348 0.4674
150 0.585 0.8299 0.415
151 0.4812 0.9624 0.5188
152 0.6581 0.6838 0.3419
153 0.6155 0.7689 0.3845
154 0.5575 0.885 0.4425
155 0.5329 0.9342 0.4671
156 0.4077 0.8154 0.5923


Meta Analysis of Goldfeld-Quandt test for Heteroskedasticity
Description# significant tests% significant testsOK/NOK
1% type I error level4 0.02685NOK
5% type I error level270.181208NOK
10% type I error level450.302013NOK

\begin{tabular}{lllllllll}
\hline
Meta Analysis of Goldfeld-Quandt test for Heteroskedasticity \tabularnewline
Description & # significant tests & % significant tests & OK/NOK \tabularnewline
1% type I error level & 4 &  0.02685 & NOK \tabularnewline
5% type I error level & 27 & 0.181208 & NOK \tabularnewline
10% type I error level & 45 & 0.302013 & NOK \tabularnewline
\hline
\end{tabular}
%Source: https://freestatistics.org/blog/index.php?pk=297906&T=6

[TABLE]
[ROW][C]Meta Analysis of Goldfeld-Quandt test for Heteroskedasticity[/C][/ROW]
[ROW][C]Description[/C][C]# significant tests[/C][C]% significant tests[/C][C]OK/NOK[/C][/ROW]
[ROW][C]1% type I error level[/C][C]4[/C][C] 0.02685[/C][C]NOK[/C][/ROW]
[ROW][C]5% type I error level[/C][C]27[/C][C]0.181208[/C][C]NOK[/C][/ROW]
[ROW][C]10% type I error level[/C][C]45[/C][C]0.302013[/C][C]NOK[/C][/ROW]
[/TABLE]
Source: https://freestatistics.org/blog/index.php?pk=297906&T=6

Globally Unique Identifier (entire table): ba.freestatistics.org/blog/index.php?pk=297906&T=6

As an alternative you can also use a QR Code:  

The GUIDs for individual cells are displayed in the table below:

Meta Analysis of Goldfeld-Quandt test for Heteroskedasticity
Description# significant tests% significant testsOK/NOK
1% type I error level4 0.02685NOK
5% type I error level270.181208NOK
10% type I error level450.302013NOK


Ramsey RESET F-Test for powers (2 and 3) of fitted values
> reset_test_fitted
	RESET test
data:  mylm
RESET = 0.0045342, df1 = 2, df2 = 157, p-value = 0.9955
Ramsey RESET F-Test for powers (2 and 3) of regressors
> reset_test_regressors
	RESET test
data:  mylm
RESET = 0.76258, df1 = 8, df2 = 151, p-value = 0.6362
Ramsey RESET F-Test for powers (2 and 3) of principal components
> reset_test_principal_components
	RESET test
data:  mylm
RESET = 0.32503, df1 = 2, df2 = 157, p-value = 0.723

\begin{tabular}{lllllllll}
\hline
Ramsey RESET F-Test for powers (2 and 3) of fitted values \tabularnewline
> reset_test_fitted
	RESET test
data:  mylm
RESET = 0.0045342, df1 = 2, df2 = 157, p-value = 0.9955
\tabularnewline Ramsey RESET F-Test for powers (2 and 3) of regressors \tabularnewline
> reset_test_regressors
	RESET test
data:  mylm
RESET = 0.76258, df1 = 8, df2 = 151, p-value = 0.6362
\tabularnewline Ramsey RESET F-Test for powers (2 and 3) of principal components \tabularnewline
> reset_test_principal_components
	RESET test
data:  mylm
RESET = 0.32503, df1 = 2, df2 = 157, p-value = 0.723
\tabularnewline \hline \end{tabular} %Source: https://freestatistics.org/blog/index.php?pk=297906&T=7

[TABLE]
[ROW][C]Ramsey RESET F-Test for powers (2 and 3) of fitted values[/C][/ROW]
[ROW][C]
> reset_test_fitted
	RESET test
data:  mylm
RESET = 0.0045342, df1 = 2, df2 = 157, p-value = 0.9955
[/C][/ROW] [ROW][C]Ramsey RESET F-Test for powers (2 and 3) of regressors[/C][/ROW] [ROW][C]
> reset_test_regressors
	RESET test
data:  mylm
RESET = 0.76258, df1 = 8, df2 = 151, p-value = 0.6362
[/C][/ROW] [ROW][C]Ramsey RESET F-Test for powers (2 and 3) of principal components[/C][/ROW] [ROW][C]
> reset_test_principal_components
	RESET test
data:  mylm
RESET = 0.32503, df1 = 2, df2 = 157, p-value = 0.723
[/C][/ROW] [/TABLE] Source: https://freestatistics.org/blog/index.php?pk=297906&T=7

Globally Unique Identifier (entire table): ba.freestatistics.org/blog/index.php?pk=297906&T=7

As an alternative you can also use a QR Code:  

The GUIDs for individual cells are displayed in the table below:

Ramsey RESET F-Test for powers (2 and 3) of fitted values
> reset_test_fitted
	RESET test
data:  mylm
RESET = 0.0045342, df1 = 2, df2 = 157, p-value = 0.9955
Ramsey RESET F-Test for powers (2 and 3) of regressors
> reset_test_regressors
	RESET test
data:  mylm
RESET = 0.76258, df1 = 8, df2 = 151, p-value = 0.6362
Ramsey RESET F-Test for powers (2 and 3) of principal components
> reset_test_principal_components
	RESET test
data:  mylm
RESET = 0.32503, df1 = 2, df2 = 157, p-value = 0.723


Variance Inflation Factors (Multicollinearity)
> vif
     EP1      EP2      EP3 `EP4\\r` 
2.069797 1.940688 1.058132 1.138461 

\begin{tabular}{lllllllll}
\hline
Variance Inflation Factors (Multicollinearity) \tabularnewline
> vif
     EP1      EP2      EP3 `EP4\\r` 
2.069797 1.940688 1.058132 1.138461 
\tabularnewline \hline \end{tabular} %Source: https://freestatistics.org/blog/index.php?pk=297906&T=8

[TABLE]
[ROW][C]Variance Inflation Factors (Multicollinearity)[/C][/ROW]
[ROW][C]
> vif
     EP1      EP2      EP3 `EP4\\r` 
2.069797 1.940688 1.058132 1.138461 
[/C][/ROW] [/TABLE] Source: https://freestatistics.org/blog/index.php?pk=297906&T=8

Globally Unique Identifier (entire table): ba.freestatistics.org/blog/index.php?pk=297906&T=8

As an alternative you can also use a QR Code:  

The GUIDs for individual cells are displayed in the table below:

Variance Inflation Factors (Multicollinearity)
> vif
     EP1      EP2      EP3 `EP4\\r` 
2.069797 1.940688 1.058132 1.138461 


Parameters (Session):
Parameters (R input):
par1 = 1 ; par2 = Do not include Seasonal Dummies ; par3 = No Linear Trend ; par4 = 0 ; par5 = 0 ;
R code (references can be found in the software module):
library(lattice)
library(lmtest)
library(car)
library(MASS)
n25 <- 25 #minimum number of obs. for Goldfeld-Quandt test
mywarning <- ''
par1 <- as.numeric(par1)
if(is.na(par1)) {
par1 <- 1
mywarning = 'Warning: you did not specify the column number of the endogenous series! The first column was selected by default.'
}
if (par4=='') par4 <- 0
par4 <- as.numeric(par4)
if (par5=='') par5 <- 0
par5 <- as.numeric(par5)
x <- na.omit(t(y))
k <- length(x[1,])
n <- length(x[,1])
x1 <- cbind(x[,par1], x[,1:k!=par1])
mycolnames <- c(colnames(x)[par1], colnames(x)[1:k!=par1])
colnames(x1) <- mycolnames #colnames(x)[par1]
x <- x1
if (par3 == 'First Differences'){
(n <- n -1)
x2 <- array(0, dim=c(n,k), dimnames=list(1:n, paste('(1-B)',colnames(x),sep='')))
for (i in 1:n) {
for (j in 1:k) {
x2[i,j] <- x[i+1,j] - x[i,j]
}
}
x <- x2
}
if (par3 == 'Seasonal Differences (s=12)'){
(n <- n - 12)
x2 <- array(0, dim=c(n,k), dimnames=list(1:n, paste('(1-B12)',colnames(x),sep='')))
for (i in 1:n) {
for (j in 1:k) {
x2[i,j] <- x[i+12,j] - x[i,j]
}
}
x <- x2
}
if (par3 == 'First and Seasonal Differences (s=12)'){
(n <- n -1)
x2 <- array(0, dim=c(n,k), dimnames=list(1:n, paste('(1-B)',colnames(x),sep='')))
for (i in 1:n) {
for (j in 1:k) {
x2[i,j] <- x[i+1,j] - x[i,j]
}
}
x <- x2
(n <- n - 12)
x2 <- array(0, dim=c(n,k), dimnames=list(1:n, paste('(1-B12)',colnames(x),sep='')))
for (i in 1:n) {
for (j in 1:k) {
x2[i,j] <- x[i+12,j] - x[i,j]
}
}
x <- x2
}
if(par4 > 0) {
x2 <- array(0, dim=c(n-par4,par4), dimnames=list(1:(n-par4), paste(colnames(x)[par1],'(t-',1:par4,')',sep='')))
for (i in 1:(n-par4)) {
for (j in 1:par4) {
x2[i,j] <- x[i+par4-j,par1]
}
}
x <- cbind(x[(par4+1):n,], x2)
n <- n - par4
}
if(par5 > 0) {
x2 <- array(0, dim=c(n-par5*12,par5), dimnames=list(1:(n-par5*12), paste(colnames(x)[par1],'(t-',1:par5,'s)',sep='')))
for (i in 1:(n-par5*12)) {
for (j in 1:par5) {
x2[i,j] <- x[i+par5*12-j*12,par1]
}
}
x <- cbind(x[(par5*12+1):n,], x2)
n <- n - par5*12
}
if (par2 == 'Include Monthly Dummies'){
x2 <- array(0, dim=c(n,11), dimnames=list(1:n, paste('M', seq(1:11), sep ='')))
for (i in 1:11){
x2[seq(i,n,12),i] <- 1
}
x <- cbind(x, x2)
}
if (par2 == 'Include Quarterly Dummies'){
x2 <- array(0, dim=c(n,3), dimnames=list(1:n, paste('Q', seq(1:3), sep ='')))
for (i in 1:3){
x2[seq(i,n,4),i] <- 1
}
x <- cbind(x, x2)
}
(k <- length(x[n,]))
if (par3 == 'Linear Trend'){
x <- cbind(x, c(1:n))
colnames(x)[k+1] <- 't'
}
print(x)
(k <- length(x[n,]))
head(x)
df <- as.data.frame(x)
(mylm <- lm(df))
(mysum <- summary(mylm))
if (n > n25) {
kp3 <- k + 3
nmkm3 <- n - k - 3
gqarr <- array(NA, dim=c(nmkm3-kp3+1,3))
numgqtests <- 0
numsignificant1 <- 0
numsignificant5 <- 0
numsignificant10 <- 0
for (mypoint in kp3:nmkm3) {
j <- 0
numgqtests <- numgqtests + 1
for (myalt in c('greater', 'two.sided', 'less')) {
j <- j + 1
gqarr[mypoint-kp3+1,j] <- gqtest(mylm, point=mypoint, alternative=myalt)$p.value
}
if (gqarr[mypoint-kp3+1,2] < 0.01) numsignificant1 <- numsignificant1 + 1
if (gqarr[mypoint-kp3+1,2] < 0.05) numsignificant5 <- numsignificant5 + 1
if (gqarr[mypoint-kp3+1,2] < 0.10) numsignificant10 <- numsignificant10 + 1
}
gqarr
}
bitmap(file='test0.png')
plot(x[,1], type='l', main='Actuals and Interpolation', ylab='value of Actuals and Interpolation (dots)', xlab='time or index')
points(x[,1]-mysum$resid)
grid()
dev.off()
bitmap(file='test1.png')
plot(mysum$resid, type='b', pch=19, main='Residuals', ylab='value of Residuals', xlab='time or index')
grid()
dev.off()
bitmap(file='test2.png')
sresid <- studres(mylm)
hist(sresid, freq=FALSE, main='Distribution of Studentized Residuals')
xfit<-seq(min(sresid),max(sresid),length=40)
yfit<-dnorm(xfit)
lines(xfit, yfit)
grid()
dev.off()
bitmap(file='test3.png')
densityplot(~mysum$resid,col='black',main='Residual Density Plot', xlab='values of Residuals')
dev.off()
bitmap(file='test4.png')
qqPlot(mylm, main='QQ Plot')
grid()
dev.off()
(myerror <- as.ts(mysum$resid))
bitmap(file='test5.png')
dum <- cbind(lag(myerror,k=1),myerror)
dum
dum1 <- dum[2:length(myerror),]
dum1
z <- as.data.frame(dum1)
print(z)
plot(z,main=paste('Residual Lag plot, lowess, and regression line'), ylab='values of Residuals', xlab='lagged values of Residuals')
lines(lowess(z))
abline(lm(z))
grid()
dev.off()
bitmap(file='test6.png')
acf(mysum$resid, lag.max=length(mysum$resid)/2, main='Residual Autocorrelation Function')
grid()
dev.off()
bitmap(file='test7.png')
pacf(mysum$resid, lag.max=length(mysum$resid)/2, main='Residual Partial Autocorrelation Function')
grid()
dev.off()
bitmap(file='test8.png')
opar <- par(mfrow = c(2,2), oma = c(0, 0, 1.1, 0))
plot(mylm, las = 1, sub='Residual Diagnostics')
par(opar)
dev.off()
if (n > n25) {
bitmap(file='test9.png')
plot(kp3:nmkm3,gqarr[,2], main='Goldfeld-Quandt test',ylab='2-sided p-value',xlab='breakpoint')
grid()
dev.off()
}
load(file='createtable')
a<-table.start()
a<-table.row.start(a)
a<-table.element(a, 'Multiple Linear Regression - Estimated Regression Equation', 1, TRUE)
a<-table.row.end(a)
myeq <- colnames(x)[1]
myeq <- paste(myeq, '[t] = ', sep='')
for (i in 1:k){
if (mysum$coefficients[i,1] > 0) myeq <- paste(myeq, '+', '')
myeq <- paste(myeq, signif(mysum$coefficients[i,1],6), sep=' ')
if (rownames(mysum$coefficients)[i] != '(Intercept)') {
myeq <- paste(myeq, rownames(mysum$coefficients)[i], sep='')
if (rownames(mysum$coefficients)[i] != 't') myeq <- paste(myeq, '[t]', sep='')
}
}
myeq <- paste(myeq, ' + e[t]')
a<-table.row.start(a)
a<-table.element(a, myeq)
a<-table.row.end(a)
a<-table.row.start(a)
a<-table.element(a, mywarning)
a<-table.row.end(a)
a<-table.end(a)
table.save(a,file='mytable1.tab')
a<-table.start()
a<-table.row.start(a)
a<-table.element(a,'Multiple Linear Regression - Ordinary Least Squares', 6, TRUE)
a<-table.row.end(a)
a<-table.row.start(a)
a<-table.element(a,'Variable',header=TRUE)
a<-table.element(a,'Parameter',header=TRUE)
a<-table.element(a,'S.D.',header=TRUE)
a<-table.element(a,'T-STAT
H0: parameter = 0',header=TRUE)
a<-table.element(a,'2-tail p-value',header=TRUE)
a<-table.element(a,'1-tail p-value',header=TRUE)
a<-table.row.end(a)
for (i in 1:k){
a<-table.row.start(a)
a<-table.element(a,rownames(mysum$coefficients)[i],header=TRUE)
a<-table.element(a,formatC(signif(mysum$coefficients[i,1],5),format='g',flag='+'))
a<-table.element(a,formatC(signif(mysum$coefficients[i,2],5),format='g',flag=' '))
a<-table.element(a,formatC(signif(mysum$coefficients[i,3],4),format='e',flag='+'))
a<-table.element(a,formatC(signif(mysum$coefficients[i,4],4),format='g',flag=' '))
a<-table.element(a,formatC(signif(mysum$coefficients[i,4]/2,4),format='g',flag=' '))
a<-table.row.end(a)
}
a<-table.end(a)
table.save(a,file='mytable2.tab')
a<-table.start()
a<-table.row.start(a)
a<-table.element(a, 'Multiple Linear Regression - Regression Statistics', 2, TRUE)
a<-table.row.end(a)
a<-table.row.start(a)
a<-table.element(a, 'Multiple R',1,TRUE)
a<-table.element(a,formatC(signif(sqrt(mysum$r.squared),6),format='g',flag=' '))
a<-table.row.end(a)
a<-table.row.start(a)
a<-table.element(a, 'R-squared',1,TRUE)
a<-table.element(a,formatC(signif(mysum$r.squared,6),format='g',flag=' '))
a<-table.row.end(a)
a<-table.row.start(a)
a<-table.element(a, 'Adjusted R-squared',1,TRUE)
a<-table.element(a,formatC(signif(mysum$adj.r.squared,6),format='g',flag=' '))
a<-table.row.end(a)
a<-table.row.start(a)
a<-table.element(a, 'F-TEST (value)',1,TRUE)
a<-table.element(a,formatC(signif(mysum$fstatistic[1],6),format='g',flag=' '))
a<-table.row.end(a)
a<-table.row.start(a)
a<-table.element(a, 'F-TEST (DF numerator)',1,TRUE)
a<-table.element(a, signif(mysum$fstatistic[2],6))
a<-table.row.end(a)
a<-table.row.start(a)
a<-table.element(a, 'F-TEST (DF denominator)',1,TRUE)
a<-table.element(a, signif(mysum$fstatistic[3],6))
a<-table.row.end(a)
a<-table.row.start(a)
a<-table.element(a, 'p-value',1,TRUE)
a<-table.element(a,formatC(signif(1-pf(mysum$fstatistic[1],mysum$fstatistic[2],mysum$fstatistic[3]),6),format='g',flag=' '))
a<-table.row.end(a)
a<-table.row.start(a)
a<-table.element(a, 'Multiple Linear Regression - Residual Statistics', 2, TRUE)
a<-table.row.end(a)
a<-table.row.start(a)
a<-table.element(a, 'Residual Standard Deviation',1,TRUE)
a<-table.element(a,formatC(signif(mysum$sigma,6),format='g',flag=' '))
a<-table.row.end(a)
a<-table.row.start(a)
a<-table.element(a, 'Sum Squared Residuals',1,TRUE)
a<-table.element(a,formatC(signif(sum(myerror*myerror),6),format='g',flag=' '))
a<-table.row.end(a)
a<-table.end(a)
table.save(a,file='mytable3.tab')
myr <- as.numeric(mysum$resid)
myr
if(n < 200) {
a<-table.start()
a<-table.row.start(a)
a<-table.element(a, 'Multiple Linear Regression - Actuals, Interpolation, and Residuals', 4, TRUE)
a<-table.row.end(a)
a<-table.row.start(a)
a<-table.element(a, 'Time or Index', 1, TRUE)
a<-table.element(a, 'Actuals', 1, TRUE)
a<-table.element(a, 'Interpolation
Forecast', 1, TRUE)
a<-table.element(a, 'Residuals
Prediction Error', 1, TRUE)
a<-table.row.end(a)
for (i in 1:n) {
a<-table.row.start(a)
a<-table.element(a,i, 1, TRUE)
a<-table.element(a,formatC(signif(x[i],6),format='g',flag=' '))
a<-table.element(a,formatC(signif(x[i]-mysum$resid[i],6),format='g',flag=' '))
a<-table.element(a,formatC(signif(mysum$resid[i],6),format='g',flag=' '))
a<-table.row.end(a)
}
a<-table.end(a)
table.save(a,file='mytable4.tab')
if (n > n25) {
a<-table.start()
a<-table.row.start(a)
a<-table.element(a,'Goldfeld-Quandt test for Heteroskedasticity',4,TRUE)
a<-table.row.end(a)
a<-table.row.start(a)
a<-table.element(a,'p-values',header=TRUE)
a<-table.element(a,'Alternative Hypothesis',3,header=TRUE)
a<-table.row.end(a)
a<-table.row.start(a)
a<-table.element(a,'breakpoint index',header=TRUE)
a<-table.element(a,'greater',header=TRUE)
a<-table.element(a,'2-sided',header=TRUE)
a<-table.element(a,'less',header=TRUE)
a<-table.row.end(a)
for (mypoint in kp3:nmkm3) {
a<-table.row.start(a)
a<-table.element(a,mypoint,header=TRUE)
a<-table.element(a,formatC(signif(gqarr[mypoint-kp3+1,1],6),format='g',flag=' '))
a<-table.element(a,formatC(signif(gqarr[mypoint-kp3+1,2],6),format='g',flag=' '))
a<-table.element(a,formatC(signif(gqarr[mypoint-kp3+1,3],6),format='g',flag=' '))
a<-table.row.end(a)
}
a<-table.end(a)
table.save(a,file='mytable5.tab')
a<-table.start()
a<-table.row.start(a)
a<-table.element(a,'Meta Analysis of Goldfeld-Quandt test for Heteroskedasticity',4,TRUE)
a<-table.row.end(a)
a<-table.row.start(a)
a<-table.element(a,'Description',header=TRUE)
a<-table.element(a,'# significant tests',header=TRUE)
a<-table.element(a,'% significant tests',header=TRUE)
a<-table.element(a,'OK/NOK',header=TRUE)
a<-table.row.end(a)
a<-table.row.start(a)
a<-table.element(a,'1% type I error level',header=TRUE)
a<-table.element(a,signif(numsignificant1,6))
a<-table.element(a,formatC(signif(numsignificant1/numgqtests,6),format='g',flag=' '))
if (numsignificant1/numgqtests < 0.01) dum <- 'OK' else dum <- 'NOK'
a<-table.element(a,dum)
a<-table.row.end(a)
a<-table.row.start(a)
a<-table.element(a,'5% type I error level',header=TRUE)
a<-table.element(a,signif(numsignificant5,6))
a<-table.element(a,signif(numsignificant5/numgqtests,6))
if (numsignificant5/numgqtests < 0.05) dum <- 'OK' else dum <- 'NOK'
a<-table.element(a,dum)
a<-table.row.end(a)
a<-table.row.start(a)
a<-table.element(a,'10% type I error level',header=TRUE)
a<-table.element(a,signif(numsignificant10,6))
a<-table.element(a,signif(numsignificant10/numgqtests,6))
if (numsignificant10/numgqtests < 0.1) dum <- 'OK' else dum <- 'NOK'
a<-table.element(a,dum)
a<-table.row.end(a)
a<-table.end(a)
table.save(a,file='mytable6.tab')
}
}
a<-table.start()
a<-table.row.start(a)
a<-table.element(a,'Ramsey RESET F-Test for powers (2 and 3) of fitted values',1,TRUE)
a<-table.row.end(a)
a<-table.row.start(a)
reset_test_fitted <- resettest(mylm,power=2:3,type='fitted')
a<-table.element(a,paste('
',RC.texteval('reset_test_fitted'),'
',sep=''))
a<-table.row.end(a)
a<-table.row.start(a)
a<-table.element(a,'Ramsey RESET F-Test for powers (2 and 3) of regressors',1,TRUE)
a<-table.row.end(a)
a<-table.row.start(a)
reset_test_regressors <- resettest(mylm,power=2:3,type='regressor')
a<-table.element(a,paste('
',RC.texteval('reset_test_regressors'),'
',sep=''))
a<-table.row.end(a)
a<-table.row.start(a)
a<-table.element(a,'Ramsey RESET F-Test for powers (2 and 3) of principal components',1,TRUE)
a<-table.row.end(a)
a<-table.row.start(a)
reset_test_principal_components <- resettest(mylm,power=2:3,type='princomp')
a<-table.element(a,paste('
',RC.texteval('reset_test_principal_components'),'
',sep=''))
a<-table.row.end(a)
a<-table.end(a)
table.save(a,file='mytable8.tab')
a<-table.start()
a<-table.row.start(a)
a<-table.element(a,'Variance Inflation Factors (Multicollinearity)',1,TRUE)
a<-table.row.end(a)
a<-table.row.start(a)
vif <- vif(mylm)
a<-table.element(a,paste('
',RC.texteval('vif'),'
',sep=''))
a<-table.row.end(a)
a<-table.end(a)
table.save(a,file='mytable9.tab')