Free Statistics
of Irreproducible Research!
Description of Statistical Computation | |||||||||||||||||||||||||||||||||||||||
|---|---|---|---|---|---|---|---|---|---|---|---|---|---|---|---|---|---|---|---|---|---|---|---|---|---|---|---|---|---|---|---|---|---|---|---|---|---|---|---|
| Author's title | |||||||||||||||||||||||||||||||||||||||
| Author | *The author of this computation has been verified* | ||||||||||||||||||||||||||||||||||||||
| R Software Module | rwasp_fitdistrnorm.wasp | ||||||||||||||||||||||||||||||||||||||
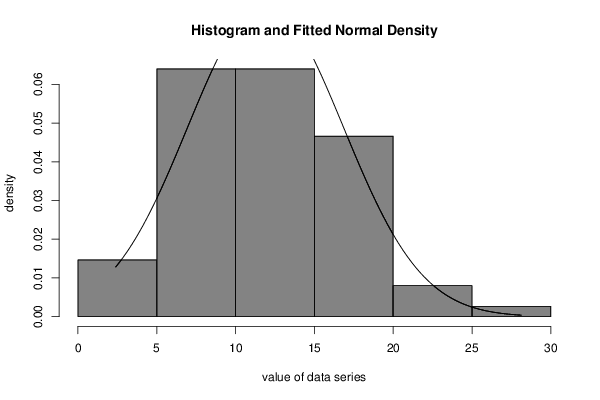
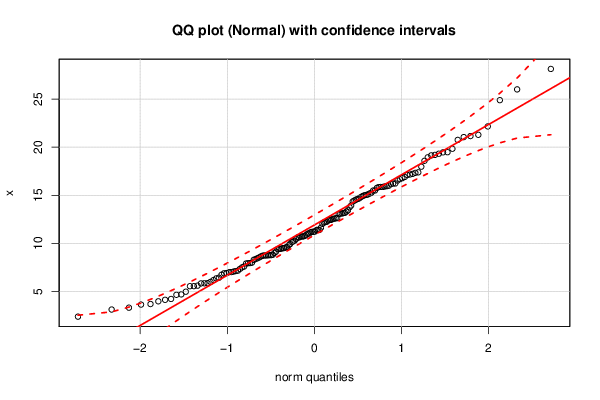
| Title produced by software | ML Fitting and QQ Plot- Normal Distribution | ||||||||||||||||||||||||||||||||||||||
| Date of computation | Mon, 28 Sep 2015 11:40:33 +0100 | ||||||||||||||||||||||||||||||||||||||
| Cite this page as follows | Statistical Computations at FreeStatistics.org, Office for Research Development and Education, URL https://freestatistics.org/blog/index.php?v=date/2015/Sep/28/t1443436858r5s06zqhsn6ix28.htm/, Retrieved Wed, 02 Jul 2025 13:05:54 +0000 | ||||||||||||||||||||||||||||||||||||||
| Statistical Computations at FreeStatistics.org, Office for Research Development and Education, URL https://freestatistics.org/blog/index.php?pk=280706, Retrieved Wed, 02 Jul 2025 13:05:54 +0000 | |||||||||||||||||||||||||||||||||||||||
| QR Codes: | |||||||||||||||||||||||||||||||||||||||
|
| |||||||||||||||||||||||||||||||||||||||
| Original text written by user: | |||||||||||||||||||||||||||||||||||||||
| IsPrivate? | No (this computation is public) | ||||||||||||||||||||||||||||||||||||||
| User-defined keywords | |||||||||||||||||||||||||||||||||||||||
| Estimated Impact | 529 | ||||||||||||||||||||||||||||||||||||||
Tree of Dependent Computations | |||||||||||||||||||||||||||||||||||||||
| Family? (F = Feedback message, R = changed R code, M = changed R Module, P = changed Parameters, D = changed Data) | |||||||||||||||||||||||||||||||||||||||
| - [ML Fitting and QQ Plot- Normal Distribution] [] [2015-09-28 10:40:33] [63a9f0ea7bb98050796b649e85481845] [Current] | |||||||||||||||||||||||||||||||||||||||
| Feedback Forum | |||||||||||||||||||||||||||||||||||||||
Post a new message | |||||||||||||||||||||||||||||||||||||||
Dataset | |||||||||||||||||||||||||||||||||||||||
| Dataseries X: | |||||||||||||||||||||||||||||||||||||||
28.12341127 13.15354001 9.566184862 12.44884169 6.190536769 10.62190374 9.405527615 11.41000835 16.77690117 15.50236953 8.372430695 7.943522876 16.9030663 12.62941124 8.787574975 14.81976725 11.2133629 5.559362614 8.46399934 9.920695538 26.000493 12.61679147 10.73868204 17.10584553 16.6851866 10.90355158 6.74739385 7.960122365 15.94990968 9.431804019 21.1539026 7.914333044 10.27541551 15.17749863 9.806988943 3.987589045 11.17074869 19.14460169 12.03627928 6.440126391 15.91467671 16.54123534 7.071252719 19.47637798 13.11201261 24.88127712 8.756174237 6.368849873 9.50198822 8.54637179 7.601908343 6.919413175 12.39592812 13.30233866 8.652403001 21.04405513 12.54998495 7.515946455 16.16365421 11.6371977 8.300371593 19.46391867 19.83409776 8.78159003 6.899221315 9.148757436 9.01717245 15.86323436 17.96970792 5.861520471 10.61975873 18.94334819 10.20280866 13.75593027 12.17988366 5.562821467 15.0856278 14.62530002 10.70893948 18.58204183 15.76726809 4.662647507 11.40941025 14.68217277 13.17689314 3.705927174 4.143404844 3.647912831 8.004038779 16.23016182 7.129487596 10.78347211 12.4473778 15.8566004 9.440646502 17.22370655 17.33098673 10.71516459 15.26323273 6.004105998 14.45159564 11.4007171 15.03317487 14.54084745 11.20538746 14.91916808 19.31633959 15.99414832 20.75186743 7.351804246 19.19413361 12.21417634 8.748841752 8.726347598 16.21974253 8.769069905 17.38814831 15.86339724 7.173882263 5.867728971 9.624330885 7.011435683 13.05430053 10.14239686 17.15888532 12.2573 4.231324062 4.707616503 14.35869278 13.43759662 11.04005647 9.51611121 13.94351549 11.24845594 3.326282574 21.28191257 11.0199688 12.56946521 3.133586181 2.394427752 22.1542271 7.026775771 4.98412533 10.46133272 5.611164659 5.847216938 13.09537212 15.00108056 15.49526271 8.828677091 | |||||||||||||||||||||||||||||||||||||||
Tables (Output of Computation) | |||||||||||||||||||||||||||||||||||||||
| |||||||||||||||||||||||||||||||||||||||
Figures (Output of Computation) | |||||||||||||||||||||||||||||||||||||||
Input Parameters & R Code | |||||||||||||||||||||||||||||||||||||||
| Parameters (Session): | |||||||||||||||||||||||||||||||||||||||
| par1 = 8 ; par2 = 0 ; | |||||||||||||||||||||||||||||||||||||||
| Parameters (R input): | |||||||||||||||||||||||||||||||||||||||
| par1 = 8 ; par2 = 0 ; | |||||||||||||||||||||||||||||||||||||||
| R code (references can be found in the software module): | |||||||||||||||||||||||||||||||||||||||
library(MASS) | |||||||||||||||||||||||||||||||||||||||