Free Statistics
of Irreproducible Research!
Description of Statistical Computation | |||||||||||||||||||||||||||||||||||||||||
|---|---|---|---|---|---|---|---|---|---|---|---|---|---|---|---|---|---|---|---|---|---|---|---|---|---|---|---|---|---|---|---|---|---|---|---|---|---|---|---|---|---|
| Author's title | |||||||||||||||||||||||||||||||||||||||||
| Author | *Unverified author* | ||||||||||||||||||||||||||||||||||||||||
| R Software Module | rwasp_univariatedataseries.wasp | ||||||||||||||||||||||||||||||||||||||||
| Title produced by software | Univariate Data Series | ||||||||||||||||||||||||||||||||||||||||
| Date of computation | Fri, 25 Sep 2015 18:00:41 +0100 | ||||||||||||||||||||||||||||||||||||||||
| Cite this page as follows | Statistical Computations at FreeStatistics.org, Office for Research Development and Education, URL https://freestatistics.org/blog/index.php?v=date/2015/Sep/25/t1443200626m98mnei5f8nf7im.htm/, Retrieved Wed, 15 May 2024 06:36:53 +0000 | ||||||||||||||||||||||||||||||||||||||||
| Statistical Computations at FreeStatistics.org, Office for Research Development and Education, URL https://freestatistics.org/blog/index.php?pk=280678, Retrieved Wed, 15 May 2024 06:36:53 +0000 | |||||||||||||||||||||||||||||||||||||||||
| QR Codes: | |||||||||||||||||||||||||||||||||||||||||
|
| |||||||||||||||||||||||||||||||||||||||||
| Original text written by user: | |||||||||||||||||||||||||||||||||||||||||
| IsPrivate? | No (this computation is public) | ||||||||||||||||||||||||||||||||||||||||
| User-defined keywords | |||||||||||||||||||||||||||||||||||||||||
| Estimated Impact | 145 | ||||||||||||||||||||||||||||||||||||||||
Tree of Dependent Computations | |||||||||||||||||||||||||||||||||||||||||
| Family? (F = Feedback message, R = changed R code, M = changed R Module, P = changed Parameters, D = changed Data) | |||||||||||||||||||||||||||||||||||||||||
| - [Univariate Data Series] [] [2015-09-25 17:00:41] [ba98afd91fb48c18835dffdfcacd1aba] [Current] | |||||||||||||||||||||||||||||||||||||||||
| Feedback Forum | |||||||||||||||||||||||||||||||||||||||||
Post a new message | |||||||||||||||||||||||||||||||||||||||||
Dataset | |||||||||||||||||||||||||||||||||||||||||
| Dataseries X: | |||||||||||||||||||||||||||||||||||||||||
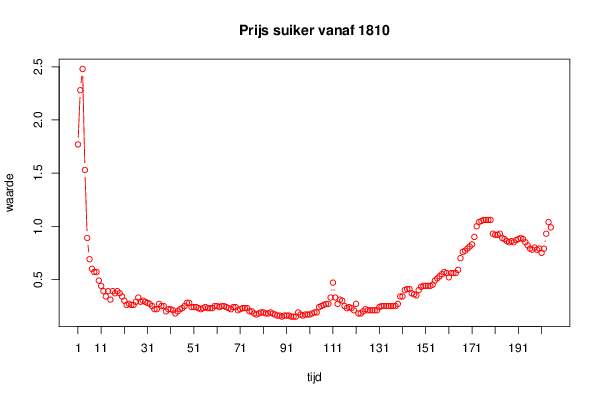
1.77 2.28 2.48 1.53 0.89 0.69 0.6 0.57 0.57 0.49 0.44 0.39 0.34 0.39 0.31 0.39 0.37 0.39 0.37 0.34 0.3 0.26 0.27 0.26 0.26 0.29 0.33 0.29 0.3 0.29 0.28 0.27 0.25 0.22 0.22 0.27 0.25 0.25 0.2 0.22 0.22 0.21 0.18 0.2 0.22 0.23 0.25 0.28 0.28 0.24 0.24 0.24 0.23 0.22 0.23 0.24 0.23 0.23 0.23 0.25 0.25 0.24 0.25 0.25 0.24 0.23 0.22 0.24 0.24 0.21 0.22 0.23 0.23 0.23 0.2 0.2 0.18 0.17 0.18 0.19 0.19 0.18 0.18 0.19 0.18 0.17 0.16 0.16 0.15 0.16 0.16 0.16 0.15 0.15 0.15 0.19 0.17 0.16 0.17 0.17 0.17 0.18 0.19 0.19 0.24 0.25 0.26 0.27 0.27 0.33 0.47 0.33 0.27 0.31 0.3 0.25 0.23 0.24 0.23 0.21 0.27 0.18 0.18 0.2 0.22 0.21 0.21 0.21 0.21 0.21 0.24 0.25 0.25 0.25 0.25 0.25 0.25 0.25 0.27 0.34 0.34 0.4 0.41 0.41 0.37 0.36 0.35 0.4 0.43 0.44 0.44 0.44 0.44 0.45 0.49 0.51 0.53 0.55 0.57 0.56 0.52 0.56 0.56 0.56 0.59 0.7 0.76 0.77 0.79 0.81 0.83 0.9 1 1.04 1.05 1.06 1.06 1.06 1.06 0.93 0.92 0.92 0.93 0.89 0.88 0.86 0.85 0.86 0.85 0.87 0.88 0.89 0.88 0.85 0.82 0.79 0.78 0.8 0.78 0.79 0.75 0.79 0.93 1.04 0.99 | |||||||||||||||||||||||||||||||||||||||||
Tables (Output of Computation) | |||||||||||||||||||||||||||||||||||||||||
| |||||||||||||||||||||||||||||||||||||||||
Figures (Output of Computation) | |||||||||||||||||||||||||||||||||||||||||
Input Parameters & R Code | |||||||||||||||||||||||||||||||||||||||||
| Parameters (Session): | |||||||||||||||||||||||||||||||||||||||||
| par1 = Prijs suiker vanaf 1810 ; par2 = CBS StatLine ; par4 = No season ; | |||||||||||||||||||||||||||||||||||||||||
| Parameters (R input): | |||||||||||||||||||||||||||||||||||||||||
| par1 = Prijs suiker vanaf 1810 ; par2 = CBS StatLine ; par3 = ; par4 = No season ; | |||||||||||||||||||||||||||||||||||||||||
| R code (references can be found in the software module): | |||||||||||||||||||||||||||||||||||||||||
par4 <- 'No season' | |||||||||||||||||||||||||||||||||||||||||