Free Statistics

of Irreproducible Research!

Author's title

Author*Unverified author*
R Software Modulerwasp_autocorrelation.wasp
Title produced by software(Partial) Autocorrelation Function
Date of computationThu, 22 Oct 2015 20:11:11 +0100
Cite this page as followsStatistical Computations at FreeStatistics.org, Office for Research Development and Education, URL https://freestatistics.org/blog/index.php?v=date/2015/Oct/22/t14455411211vw0gxxpvia8m4w.htm/, Retrieved Sat, 18 May 2024 03:43:13 +0000
Statistical Computations at FreeStatistics.org, Office for Research Development and Education, URL https://freestatistics.org/blog/index.php?pk=282794, Retrieved Sat, 18 May 2024 03:43:13 +0000
QR Codes:

Original text written by user:
IsPrivate?No (this computation is public)
User-defined keywords
Estimated Impact121
Family? (F = Feedback message, R = changed R code, M = changed R Module, P = changed Parameters, D = changed Data)
-     [(Partial) Autocorrelation Function] [zuiveren trend le...] [2015-10-22 18:45:07] [1625b1453ed47b256ce4b6eedb089cd5]
-   PD    [(Partial) Autocorrelation Function] [autocorrelatie ka...] [2015-10-22 19:11:11] [c4e632f9a17048eeb9519d4e8ae83546] [Current]
Feedback Forum

Post a new message
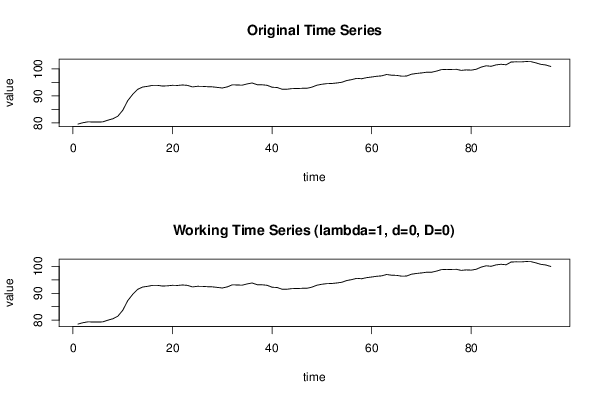
Dataseries X:
79,58
80,08
80,41
80,34
80,32
80,39
81,01
81,54
82,48
84,68
88,26
90,6
92,46
93,31
93,58
93,92
93,92
93,67
93,76
93,95
93,89
94,07
93,93
93,35
93,58
93,55
93,44
93,38
93,17
92,95
93,37
94,13
94,07
94
94,47
94,81
94,18
94,14
93,96
93,23
93,13
92,51
92,49
92,73
92,75
92,83
92,85
93,27
93,98
94,34
94,57
94,62
94,82
95,07
95,72
96,06
96,54
96,38
96,8
97,02
97,29
97,45
97,95
97,69
97,63
97,35
97,38
98,06
98,34
98,53
98,79
98,77
99,2
99,76
99,84
99,83
99,88
99,48
99,66
99,58
99,89
100,7
101,19
100,99
101,52
101,75
101,56
102,57
102,66
102,62
102,76
102,73
102,26
101,72
101,48
100,93


Summary of computational transaction
Raw Inputview raw input (R code)
Raw Outputview raw output of R engine
Computing time1 seconds
R Server'Gwilym Jenkins' @ jenkins.wessa.net
R Framework error message
Warning: there are blank lines in the 'Data' field.
Please, use NA for missing data - blank lines are simply
 deleted and are NOT treated as missing values.

\begin{tabular}{lllllllll}
\hline
Summary of computational transaction \tabularnewline
Raw Input & view raw input (R code)  \tabularnewline
Raw Output & view raw output of R engine  \tabularnewline
Computing time & 1 seconds \tabularnewline
R Server & 'Gwilym Jenkins' @ jenkins.wessa.net \tabularnewline
R Framework error message & 
Warning: there are blank lines in the 'Data' field.
Please, use NA for missing data - blank lines are simply
 deleted and are NOT treated as missing values.
\tabularnewline \hline \end{tabular} %Source: https://freestatistics.org/blog/index.php?pk=282794&T=0

[TABLE]
[ROW][C]Summary of computational transaction[/C][/ROW]
[ROW][C]Raw Input[/C][C]view raw input (R code) [/C][/ROW]
[ROW][C]Raw Output[/C][C]view raw output of R engine [/C][/ROW]
[ROW][C]Computing time[/C][C]1 seconds[/C][/ROW]
[ROW][C]R Server[/C][C]'Gwilym Jenkins' @ jenkins.wessa.net[/C][/ROW]
[ROW][C]R Framework error message[/C][C]
Warning: there are blank lines in the 'Data' field.
Please, use NA for missing data - blank lines are simply
 deleted and are NOT treated as missing values.
[/C][/ROW] [/TABLE] Source: https://freestatistics.org/blog/index.php?pk=282794&T=0

Globally Unique Identifier (entire table): ba.freestatistics.org/blog/index.php?pk=282794&T=0

As an alternative you can also use a QR Code:  

The GUIDs for individual cells are displayed in the table below:

Summary of computational transaction
Raw Inputview raw input (R code)
Raw Outputview raw output of R engine
Computing time1 seconds
R Server'Gwilym Jenkins' @ jenkins.wessa.net
R Framework error message
Warning: there are blank lines in the 'Data' field.
Please, use NA for missing data - blank lines are simply
 deleted and are NOT treated as missing values.


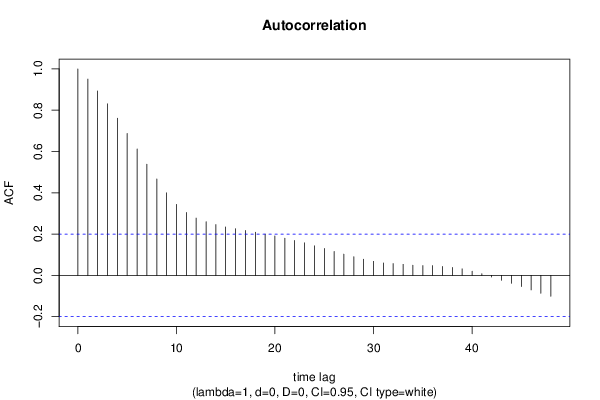
Autocorrelation Function
Time lag kACF(k)T-STATP-value
10.9506869.31480
20.8935968.75540
30.8307958.14010
40.7611937.45810
50.6875076.73620
60.6122275.99860
70.5386235.27740
80.4670264.57597e-06
90.3996433.91578.4e-05
100.3438043.36860.000544
110.3046892.98530.001797
120.2772192.71620.003917
130.2596692.54420.006274
140.2459072.40940.008943
150.2340852.29360.011999
160.2255552.210.014742
170.2177142.13320.017731
180.2086542.04440.021827
190.199911.95870.026524
200.1905891.86740.03245
210.1799751.76340.040509
220.1693111.65890.0502
230.1573691.54190.063194
240.143061.40170.082116
250.1298571.27230.103164
260.1159551.13610.129367
270.1027441.00670.158308
280.0903910.88560.18901
290.0784310.76850.22205
300.067750.66380.2542
310.06020.58980.278343
320.0568490.5570.28941
330.0533890.52310.301054
340.0488020.47820.316812
350.0471920.46240.322426
360.0470490.4610.322928
370.0432120.42340.336479
380.0382510.37480.354324
390.0315120.30880.379088
400.0196820.19280.423745
410.0074450.07290.471
42-0.008071-0.07910.468568
43-0.023581-0.2310.408887
44-0.038567-0.37790.353177
45-0.054246-0.53150.29815
46-0.070232-0.68810.246516
47-0.086552-0.8480.199264
48-0.101209-0.99160.161933

\begin{tabular}{lllllllll}
\hline
Autocorrelation Function \tabularnewline
Time lag k & ACF(k) & T-STAT & P-value \tabularnewline
1 & 0.950686 & 9.3148 & 0 \tabularnewline
2 & 0.893596 & 8.7554 & 0 \tabularnewline
3 & 0.830795 & 8.1401 & 0 \tabularnewline
4 & 0.761193 & 7.4581 & 0 \tabularnewline
5 & 0.687507 & 6.7362 & 0 \tabularnewline
6 & 0.612227 & 5.9986 & 0 \tabularnewline
7 & 0.538623 & 5.2774 & 0 \tabularnewline
8 & 0.467026 & 4.5759 & 7e-06 \tabularnewline
9 & 0.399643 & 3.9157 & 8.4e-05 \tabularnewline
10 & 0.343804 & 3.3686 & 0.000544 \tabularnewline
11 & 0.304689 & 2.9853 & 0.001797 \tabularnewline
12 & 0.277219 & 2.7162 & 0.003917 \tabularnewline
13 & 0.259669 & 2.5442 & 0.006274 \tabularnewline
14 & 0.245907 & 2.4094 & 0.008943 \tabularnewline
15 & 0.234085 & 2.2936 & 0.011999 \tabularnewline
16 & 0.225555 & 2.21 & 0.014742 \tabularnewline
17 & 0.217714 & 2.1332 & 0.017731 \tabularnewline
18 & 0.208654 & 2.0444 & 0.021827 \tabularnewline
19 & 0.19991 & 1.9587 & 0.026524 \tabularnewline
20 & 0.190589 & 1.8674 & 0.03245 \tabularnewline
21 & 0.179975 & 1.7634 & 0.040509 \tabularnewline
22 & 0.169311 & 1.6589 & 0.0502 \tabularnewline
23 & 0.157369 & 1.5419 & 0.063194 \tabularnewline
24 & 0.14306 & 1.4017 & 0.082116 \tabularnewline
25 & 0.129857 & 1.2723 & 0.103164 \tabularnewline
26 & 0.115955 & 1.1361 & 0.129367 \tabularnewline
27 & 0.102744 & 1.0067 & 0.158308 \tabularnewline
28 & 0.090391 & 0.8856 & 0.18901 \tabularnewline
29 & 0.078431 & 0.7685 & 0.22205 \tabularnewline
30 & 0.06775 & 0.6638 & 0.2542 \tabularnewline
31 & 0.0602 & 0.5898 & 0.278343 \tabularnewline
32 & 0.056849 & 0.557 & 0.28941 \tabularnewline
33 & 0.053389 & 0.5231 & 0.301054 \tabularnewline
34 & 0.048802 & 0.4782 & 0.316812 \tabularnewline
35 & 0.047192 & 0.4624 & 0.322426 \tabularnewline
36 & 0.047049 & 0.461 & 0.322928 \tabularnewline
37 & 0.043212 & 0.4234 & 0.336479 \tabularnewline
38 & 0.038251 & 0.3748 & 0.354324 \tabularnewline
39 & 0.031512 & 0.3088 & 0.379088 \tabularnewline
40 & 0.019682 & 0.1928 & 0.423745 \tabularnewline
41 & 0.007445 & 0.0729 & 0.471 \tabularnewline
42 & -0.008071 & -0.0791 & 0.468568 \tabularnewline
43 & -0.023581 & -0.231 & 0.408887 \tabularnewline
44 & -0.038567 & -0.3779 & 0.353177 \tabularnewline
45 & -0.054246 & -0.5315 & 0.29815 \tabularnewline
46 & -0.070232 & -0.6881 & 0.246516 \tabularnewline
47 & -0.086552 & -0.848 & 0.199264 \tabularnewline
48 & -0.101209 & -0.9916 & 0.161933 \tabularnewline
\hline
\end{tabular}
%Source: https://freestatistics.org/blog/index.php?pk=282794&T=1

[TABLE]
[ROW][C]Autocorrelation Function[/C][/ROW]
[ROW][C]Time lag k[/C][C]ACF(k)[/C][C]T-STAT[/C][C]P-value[/C][/ROW]
[ROW][C]1[/C][C]0.950686[/C][C]9.3148[/C][C]0[/C][/ROW]
[ROW][C]2[/C][C]0.893596[/C][C]8.7554[/C][C]0[/C][/ROW]
[ROW][C]3[/C][C]0.830795[/C][C]8.1401[/C][C]0[/C][/ROW]
[ROW][C]4[/C][C]0.761193[/C][C]7.4581[/C][C]0[/C][/ROW]
[ROW][C]5[/C][C]0.687507[/C][C]6.7362[/C][C]0[/C][/ROW]
[ROW][C]6[/C][C]0.612227[/C][C]5.9986[/C][C]0[/C][/ROW]
[ROW][C]7[/C][C]0.538623[/C][C]5.2774[/C][C]0[/C][/ROW]
[ROW][C]8[/C][C]0.467026[/C][C]4.5759[/C][C]7e-06[/C][/ROW]
[ROW][C]9[/C][C]0.399643[/C][C]3.9157[/C][C]8.4e-05[/C][/ROW]
[ROW][C]10[/C][C]0.343804[/C][C]3.3686[/C][C]0.000544[/C][/ROW]
[ROW][C]11[/C][C]0.304689[/C][C]2.9853[/C][C]0.001797[/C][/ROW]
[ROW][C]12[/C][C]0.277219[/C][C]2.7162[/C][C]0.003917[/C][/ROW]
[ROW][C]13[/C][C]0.259669[/C][C]2.5442[/C][C]0.006274[/C][/ROW]
[ROW][C]14[/C][C]0.245907[/C][C]2.4094[/C][C]0.008943[/C][/ROW]
[ROW][C]15[/C][C]0.234085[/C][C]2.2936[/C][C]0.011999[/C][/ROW]
[ROW][C]16[/C][C]0.225555[/C][C]2.21[/C][C]0.014742[/C][/ROW]
[ROW][C]17[/C][C]0.217714[/C][C]2.1332[/C][C]0.017731[/C][/ROW]
[ROW][C]18[/C][C]0.208654[/C][C]2.0444[/C][C]0.021827[/C][/ROW]
[ROW][C]19[/C][C]0.19991[/C][C]1.9587[/C][C]0.026524[/C][/ROW]
[ROW][C]20[/C][C]0.190589[/C][C]1.8674[/C][C]0.03245[/C][/ROW]
[ROW][C]21[/C][C]0.179975[/C][C]1.7634[/C][C]0.040509[/C][/ROW]
[ROW][C]22[/C][C]0.169311[/C][C]1.6589[/C][C]0.0502[/C][/ROW]
[ROW][C]23[/C][C]0.157369[/C][C]1.5419[/C][C]0.063194[/C][/ROW]
[ROW][C]24[/C][C]0.14306[/C][C]1.4017[/C][C]0.082116[/C][/ROW]
[ROW][C]25[/C][C]0.129857[/C][C]1.2723[/C][C]0.103164[/C][/ROW]
[ROW][C]26[/C][C]0.115955[/C][C]1.1361[/C][C]0.129367[/C][/ROW]
[ROW][C]27[/C][C]0.102744[/C][C]1.0067[/C][C]0.158308[/C][/ROW]
[ROW][C]28[/C][C]0.090391[/C][C]0.8856[/C][C]0.18901[/C][/ROW]
[ROW][C]29[/C][C]0.078431[/C][C]0.7685[/C][C]0.22205[/C][/ROW]
[ROW][C]30[/C][C]0.06775[/C][C]0.6638[/C][C]0.2542[/C][/ROW]
[ROW][C]31[/C][C]0.0602[/C][C]0.5898[/C][C]0.278343[/C][/ROW]
[ROW][C]32[/C][C]0.056849[/C][C]0.557[/C][C]0.28941[/C][/ROW]
[ROW][C]33[/C][C]0.053389[/C][C]0.5231[/C][C]0.301054[/C][/ROW]
[ROW][C]34[/C][C]0.048802[/C][C]0.4782[/C][C]0.316812[/C][/ROW]
[ROW][C]35[/C][C]0.047192[/C][C]0.4624[/C][C]0.322426[/C][/ROW]
[ROW][C]36[/C][C]0.047049[/C][C]0.461[/C][C]0.322928[/C][/ROW]
[ROW][C]37[/C][C]0.043212[/C][C]0.4234[/C][C]0.336479[/C][/ROW]
[ROW][C]38[/C][C]0.038251[/C][C]0.3748[/C][C]0.354324[/C][/ROW]
[ROW][C]39[/C][C]0.031512[/C][C]0.3088[/C][C]0.379088[/C][/ROW]
[ROW][C]40[/C][C]0.019682[/C][C]0.1928[/C][C]0.423745[/C][/ROW]
[ROW][C]41[/C][C]0.007445[/C][C]0.0729[/C][C]0.471[/C][/ROW]
[ROW][C]42[/C][C]-0.008071[/C][C]-0.0791[/C][C]0.468568[/C][/ROW]
[ROW][C]43[/C][C]-0.023581[/C][C]-0.231[/C][C]0.408887[/C][/ROW]
[ROW][C]44[/C][C]-0.038567[/C][C]-0.3779[/C][C]0.353177[/C][/ROW]
[ROW][C]45[/C][C]-0.054246[/C][C]-0.5315[/C][C]0.29815[/C][/ROW]
[ROW][C]46[/C][C]-0.070232[/C][C]-0.6881[/C][C]0.246516[/C][/ROW]
[ROW][C]47[/C][C]-0.086552[/C][C]-0.848[/C][C]0.199264[/C][/ROW]
[ROW][C]48[/C][C]-0.101209[/C][C]-0.9916[/C][C]0.161933[/C][/ROW]
[/TABLE]
Source: https://freestatistics.org/blog/index.php?pk=282794&T=1

Globally Unique Identifier (entire table): ba.freestatistics.org/blog/index.php?pk=282794&T=1

As an alternative you can also use a QR Code:  

The GUIDs for individual cells are displayed in the table below:

Autocorrelation Function
Time lag kACF(k)T-STATP-value
10.9506869.31480
20.8935968.75540
30.8307958.14010
40.7611937.45810
50.6875076.73620
60.6122275.99860
70.5386235.27740
80.4670264.57597e-06
90.3996433.91578.4e-05
100.3438043.36860.000544
110.3046892.98530.001797
120.2772192.71620.003917
130.2596692.54420.006274
140.2459072.40940.008943
150.2340852.29360.011999
160.2255552.210.014742
170.2177142.13320.017731
180.2086542.04440.021827
190.199911.95870.026524
200.1905891.86740.03245
210.1799751.76340.040509
220.1693111.65890.0502
230.1573691.54190.063194
240.143061.40170.082116
250.1298571.27230.103164
260.1159551.13610.129367
270.1027441.00670.158308
280.0903910.88560.18901
290.0784310.76850.22205
300.067750.66380.2542
310.06020.58980.278343
320.0568490.5570.28941
330.0533890.52310.301054
340.0488020.47820.316812
350.0471920.46240.322426
360.0470490.4610.322928
370.0432120.42340.336479
380.0382510.37480.354324
390.0315120.30880.379088
400.0196820.19280.423745
410.0074450.07290.471
42-0.008071-0.07910.468568
43-0.023581-0.2310.408887
44-0.038567-0.37790.353177
45-0.054246-0.53150.29815
46-0.070232-0.68810.246516
47-0.086552-0.8480.199264
48-0.101209-0.99160.161933


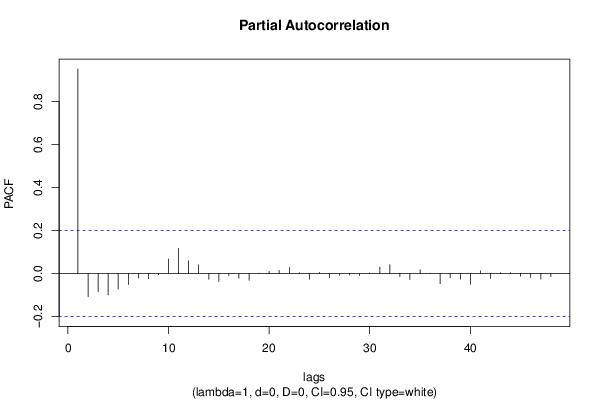
Partial Autocorrelation Function
Time lag kPACF(k)T-STATP-value
10.9506869.31480
2-0.106113-1.03970.150547
3-0.084106-0.82410.205973
4-0.09826-0.96270.169047
5-0.071721-0.70270.241966
6-0.050369-0.49350.311388
7-0.02063-0.20210.420119
8-0.02386-0.23380.407829
9-0.005504-0.05390.478553
100.0675560.66190.254806
110.117761.15380.125721
120.0597490.58540.279821
130.0407160.39890.345414
14-0.026001-0.25480.399729
15-0.036504-0.35770.360691
16-0.008592-0.08420.466544
17-0.021921-0.21480.415196
18-0.030627-0.30010.38238
190.0014530.01420.494335
200.0100060.0980.461053
210.0148370.14540.442362
220.0282660.27690.391207
230.0035150.03440.486301
24-0.025854-0.25330.400282
250.0048150.04720.481235
26-0.019484-0.19090.424502
27-0.007728-0.07570.4699
28-0.006464-0.06330.474814
29-0.009035-0.08850.46482
300.0024390.02390.490493
310.0295130.28920.386538
320.0408320.40010.344995
33-0.013654-0.13380.446928
34-0.026905-0.26360.39632
350.0177450.17390.431171
360.0018050.01770.492964
37-0.046533-0.45590.324736
38-0.019019-0.18630.426284
39-0.025784-0.25260.400547
40-0.049869-0.48860.313114
410.012550.1230.451196
42-0.022378-0.21930.413456
430.0046160.04520.482012
440.003740.03660.485421
45-0.012386-0.12140.451832
46-0.017788-0.17430.431004
47-0.025738-0.25220.400722
48-0.013456-0.13180.447694

\begin{tabular}{lllllllll}
\hline
Partial Autocorrelation Function \tabularnewline
Time lag k & PACF(k) & T-STAT & P-value \tabularnewline
1 & 0.950686 & 9.3148 & 0 \tabularnewline
2 & -0.106113 & -1.0397 & 0.150547 \tabularnewline
3 & -0.084106 & -0.8241 & 0.205973 \tabularnewline
4 & -0.09826 & -0.9627 & 0.169047 \tabularnewline
5 & -0.071721 & -0.7027 & 0.241966 \tabularnewline
6 & -0.050369 & -0.4935 & 0.311388 \tabularnewline
7 & -0.02063 & -0.2021 & 0.420119 \tabularnewline
8 & -0.02386 & -0.2338 & 0.407829 \tabularnewline
9 & -0.005504 & -0.0539 & 0.478553 \tabularnewline
10 & 0.067556 & 0.6619 & 0.254806 \tabularnewline
11 & 0.11776 & 1.1538 & 0.125721 \tabularnewline
12 & 0.059749 & 0.5854 & 0.279821 \tabularnewline
13 & 0.040716 & 0.3989 & 0.345414 \tabularnewline
14 & -0.026001 & -0.2548 & 0.399729 \tabularnewline
15 & -0.036504 & -0.3577 & 0.360691 \tabularnewline
16 & -0.008592 & -0.0842 & 0.466544 \tabularnewline
17 & -0.021921 & -0.2148 & 0.415196 \tabularnewline
18 & -0.030627 & -0.3001 & 0.38238 \tabularnewline
19 & 0.001453 & 0.0142 & 0.494335 \tabularnewline
20 & 0.010006 & 0.098 & 0.461053 \tabularnewline
21 & 0.014837 & 0.1454 & 0.442362 \tabularnewline
22 & 0.028266 & 0.2769 & 0.391207 \tabularnewline
23 & 0.003515 & 0.0344 & 0.486301 \tabularnewline
24 & -0.025854 & -0.2533 & 0.400282 \tabularnewline
25 & 0.004815 & 0.0472 & 0.481235 \tabularnewline
26 & -0.019484 & -0.1909 & 0.424502 \tabularnewline
27 & -0.007728 & -0.0757 & 0.4699 \tabularnewline
28 & -0.006464 & -0.0633 & 0.474814 \tabularnewline
29 & -0.009035 & -0.0885 & 0.46482 \tabularnewline
30 & 0.002439 & 0.0239 & 0.490493 \tabularnewline
31 & 0.029513 & 0.2892 & 0.386538 \tabularnewline
32 & 0.040832 & 0.4001 & 0.344995 \tabularnewline
33 & -0.013654 & -0.1338 & 0.446928 \tabularnewline
34 & -0.026905 & -0.2636 & 0.39632 \tabularnewline
35 & 0.017745 & 0.1739 & 0.431171 \tabularnewline
36 & 0.001805 & 0.0177 & 0.492964 \tabularnewline
37 & -0.046533 & -0.4559 & 0.324736 \tabularnewline
38 & -0.019019 & -0.1863 & 0.426284 \tabularnewline
39 & -0.025784 & -0.2526 & 0.400547 \tabularnewline
40 & -0.049869 & -0.4886 & 0.313114 \tabularnewline
41 & 0.01255 & 0.123 & 0.451196 \tabularnewline
42 & -0.022378 & -0.2193 & 0.413456 \tabularnewline
43 & 0.004616 & 0.0452 & 0.482012 \tabularnewline
44 & 0.00374 & 0.0366 & 0.485421 \tabularnewline
45 & -0.012386 & -0.1214 & 0.451832 \tabularnewline
46 & -0.017788 & -0.1743 & 0.431004 \tabularnewline
47 & -0.025738 & -0.2522 & 0.400722 \tabularnewline
48 & -0.013456 & -0.1318 & 0.447694 \tabularnewline
\hline
\end{tabular}
%Source: https://freestatistics.org/blog/index.php?pk=282794&T=2

[TABLE]
[ROW][C]Partial Autocorrelation Function[/C][/ROW]
[ROW][C]Time lag k[/C][C]PACF(k)[/C][C]T-STAT[/C][C]P-value[/C][/ROW]
[ROW][C]1[/C][C]0.950686[/C][C]9.3148[/C][C]0[/C][/ROW]
[ROW][C]2[/C][C]-0.106113[/C][C]-1.0397[/C][C]0.150547[/C][/ROW]
[ROW][C]3[/C][C]-0.084106[/C][C]-0.8241[/C][C]0.205973[/C][/ROW]
[ROW][C]4[/C][C]-0.09826[/C][C]-0.9627[/C][C]0.169047[/C][/ROW]
[ROW][C]5[/C][C]-0.071721[/C][C]-0.7027[/C][C]0.241966[/C][/ROW]
[ROW][C]6[/C][C]-0.050369[/C][C]-0.4935[/C][C]0.311388[/C][/ROW]
[ROW][C]7[/C][C]-0.02063[/C][C]-0.2021[/C][C]0.420119[/C][/ROW]
[ROW][C]8[/C][C]-0.02386[/C][C]-0.2338[/C][C]0.407829[/C][/ROW]
[ROW][C]9[/C][C]-0.005504[/C][C]-0.0539[/C][C]0.478553[/C][/ROW]
[ROW][C]10[/C][C]0.067556[/C][C]0.6619[/C][C]0.254806[/C][/ROW]
[ROW][C]11[/C][C]0.11776[/C][C]1.1538[/C][C]0.125721[/C][/ROW]
[ROW][C]12[/C][C]0.059749[/C][C]0.5854[/C][C]0.279821[/C][/ROW]
[ROW][C]13[/C][C]0.040716[/C][C]0.3989[/C][C]0.345414[/C][/ROW]
[ROW][C]14[/C][C]-0.026001[/C][C]-0.2548[/C][C]0.399729[/C][/ROW]
[ROW][C]15[/C][C]-0.036504[/C][C]-0.3577[/C][C]0.360691[/C][/ROW]
[ROW][C]16[/C][C]-0.008592[/C][C]-0.0842[/C][C]0.466544[/C][/ROW]
[ROW][C]17[/C][C]-0.021921[/C][C]-0.2148[/C][C]0.415196[/C][/ROW]
[ROW][C]18[/C][C]-0.030627[/C][C]-0.3001[/C][C]0.38238[/C][/ROW]
[ROW][C]19[/C][C]0.001453[/C][C]0.0142[/C][C]0.494335[/C][/ROW]
[ROW][C]20[/C][C]0.010006[/C][C]0.098[/C][C]0.461053[/C][/ROW]
[ROW][C]21[/C][C]0.014837[/C][C]0.1454[/C][C]0.442362[/C][/ROW]
[ROW][C]22[/C][C]0.028266[/C][C]0.2769[/C][C]0.391207[/C][/ROW]
[ROW][C]23[/C][C]0.003515[/C][C]0.0344[/C][C]0.486301[/C][/ROW]
[ROW][C]24[/C][C]-0.025854[/C][C]-0.2533[/C][C]0.400282[/C][/ROW]
[ROW][C]25[/C][C]0.004815[/C][C]0.0472[/C][C]0.481235[/C][/ROW]
[ROW][C]26[/C][C]-0.019484[/C][C]-0.1909[/C][C]0.424502[/C][/ROW]
[ROW][C]27[/C][C]-0.007728[/C][C]-0.0757[/C][C]0.4699[/C][/ROW]
[ROW][C]28[/C][C]-0.006464[/C][C]-0.0633[/C][C]0.474814[/C][/ROW]
[ROW][C]29[/C][C]-0.009035[/C][C]-0.0885[/C][C]0.46482[/C][/ROW]
[ROW][C]30[/C][C]0.002439[/C][C]0.0239[/C][C]0.490493[/C][/ROW]
[ROW][C]31[/C][C]0.029513[/C][C]0.2892[/C][C]0.386538[/C][/ROW]
[ROW][C]32[/C][C]0.040832[/C][C]0.4001[/C][C]0.344995[/C][/ROW]
[ROW][C]33[/C][C]-0.013654[/C][C]-0.1338[/C][C]0.446928[/C][/ROW]
[ROW][C]34[/C][C]-0.026905[/C][C]-0.2636[/C][C]0.39632[/C][/ROW]
[ROW][C]35[/C][C]0.017745[/C][C]0.1739[/C][C]0.431171[/C][/ROW]
[ROW][C]36[/C][C]0.001805[/C][C]0.0177[/C][C]0.492964[/C][/ROW]
[ROW][C]37[/C][C]-0.046533[/C][C]-0.4559[/C][C]0.324736[/C][/ROW]
[ROW][C]38[/C][C]-0.019019[/C][C]-0.1863[/C][C]0.426284[/C][/ROW]
[ROW][C]39[/C][C]-0.025784[/C][C]-0.2526[/C][C]0.400547[/C][/ROW]
[ROW][C]40[/C][C]-0.049869[/C][C]-0.4886[/C][C]0.313114[/C][/ROW]
[ROW][C]41[/C][C]0.01255[/C][C]0.123[/C][C]0.451196[/C][/ROW]
[ROW][C]42[/C][C]-0.022378[/C][C]-0.2193[/C][C]0.413456[/C][/ROW]
[ROW][C]43[/C][C]0.004616[/C][C]0.0452[/C][C]0.482012[/C][/ROW]
[ROW][C]44[/C][C]0.00374[/C][C]0.0366[/C][C]0.485421[/C][/ROW]
[ROW][C]45[/C][C]-0.012386[/C][C]-0.1214[/C][C]0.451832[/C][/ROW]
[ROW][C]46[/C][C]-0.017788[/C][C]-0.1743[/C][C]0.431004[/C][/ROW]
[ROW][C]47[/C][C]-0.025738[/C][C]-0.2522[/C][C]0.400722[/C][/ROW]
[ROW][C]48[/C][C]-0.013456[/C][C]-0.1318[/C][C]0.447694[/C][/ROW]
[/TABLE]
Source: https://freestatistics.org/blog/index.php?pk=282794&T=2

Globally Unique Identifier (entire table): ba.freestatistics.org/blog/index.php?pk=282794&T=2

As an alternative you can also use a QR Code:  

The GUIDs for individual cells are displayed in the table below:

Partial Autocorrelation Function
Time lag kPACF(k)T-STATP-value
10.9506869.31480
2-0.106113-1.03970.150547
3-0.084106-0.82410.205973
4-0.09826-0.96270.169047
5-0.071721-0.70270.241966
6-0.050369-0.49350.311388
7-0.02063-0.20210.420119
8-0.02386-0.23380.407829
9-0.005504-0.05390.478553
100.0675560.66190.254806
110.117761.15380.125721
120.0597490.58540.279821
130.0407160.39890.345414
14-0.026001-0.25480.399729
15-0.036504-0.35770.360691
16-0.008592-0.08420.466544
17-0.021921-0.21480.415196
18-0.030627-0.30010.38238
190.0014530.01420.494335
200.0100060.0980.461053
210.0148370.14540.442362
220.0282660.27690.391207
230.0035150.03440.486301
24-0.025854-0.25330.400282
250.0048150.04720.481235
26-0.019484-0.19090.424502
27-0.007728-0.07570.4699
28-0.006464-0.06330.474814
29-0.009035-0.08850.46482
300.0024390.02390.490493
310.0295130.28920.386538
320.0408320.40010.344995
33-0.013654-0.13380.446928
34-0.026905-0.26360.39632
350.0177450.17390.431171
360.0018050.01770.492964
37-0.046533-0.45590.324736
38-0.019019-0.18630.426284
39-0.025784-0.25260.400547
40-0.049869-0.48860.313114
410.012550.1230.451196
42-0.022378-0.21930.413456
430.0046160.04520.482012
440.003740.03660.485421
45-0.012386-0.12140.451832
46-0.017788-0.17430.431004
47-0.025738-0.25220.400722
48-0.013456-0.13180.447694


Parameters (Session):
par1 = 48 ; par2 = 1 ; par3 = 0 ; par4 = 0 ; par5 = 12 ; par6 = White Noise ; par7 = 0.95 ;
Parameters (R input):
par1 = 48 ; par2 = 1 ; par3 = 0 ; par4 = 0 ; par5 = 12 ; par6 = White Noise ; par7 = 0.95 ; par8 = ;
R code (references can be found in the software module):
if (par1 == 'Default') {
par1 = 10*log10(length(x))
} else {
par1 <- as.numeric(par1)
}
par2 <- as.numeric(par2)
par3 <- as.numeric(par3)
par4 <- as.numeric(par4)
par5 <- as.numeric(par5)
if (par6 == 'White Noise') par6 <- 'white' else par6 <- 'ma'
par7 <- as.numeric(par7)
if (par8 != '') par8 <- as.numeric(par8)
ox <- x
if (par8 == '') {
if (par2 == 0) {
x <- log(x)
} else {
x <- (x ^ par2 - 1) / par2
}
} else {
x <- log(x,base=par8)
}
if (par3 > 0) x <- diff(x,lag=1,difference=par3)
if (par4 > 0) x <- diff(x,lag=par5,difference=par4)
bitmap(file='picts.png')
op <- par(mfrow=c(2,1))
plot(ox,type='l',main='Original Time Series',xlab='time',ylab='value')
if (par8=='') {
mytitle <- paste('Working Time Series (lambda=',par2,', d=',par3,', D=',par4,')',sep='')
mysub <- paste('(lambda=',par2,', d=',par3,', D=',par4,', CI=', par7, ', CI type=',par6,')',sep='')
} else {
mytitle <- paste('Working Time Series (base=',par8,', d=',par3,', D=',par4,')',sep='')
mysub <- paste('(base=',par8,', d=',par3,', D=',par4,', CI=', par7, ', CI type=',par6,')',sep='')
}
plot(x,type='l', main=mytitle,xlab='time',ylab='value')
par(op)
dev.off()
bitmap(file='pic1.png')
racf <- acf(x, par1, main='Autocorrelation', xlab='time lag', ylab='ACF', ci.type=par6, ci=par7, sub=mysub)
dev.off()
bitmap(file='pic2.png')
rpacf <- pacf(x,par1,main='Partial Autocorrelation',xlab='lags',ylab='PACF',sub=mysub)
dev.off()
(myacf <- c(racf$acf))
(mypacf <- c(rpacf$acf))
lengthx <- length(x)
sqrtn <- sqrt(lengthx)
load(file='createtable')
a<-table.start()
a<-table.row.start(a)
a<-table.element(a,'Autocorrelation Function',4,TRUE)
a<-table.row.end(a)
a<-table.row.start(a)
a<-table.element(a,'Time lag k',header=TRUE)
a<-table.element(a,hyperlink('basics.htm','ACF(k)','click here for more information about the Autocorrelation Function'),header=TRUE)
a<-table.element(a,'T-STAT',header=TRUE)
a<-table.element(a,'P-value',header=TRUE)
a<-table.row.end(a)
for (i in 2:(par1+1)) {
a<-table.row.start(a)
a<-table.element(a,i-1,header=TRUE)
a<-table.element(a,round(myacf[i],6))
mytstat <- myacf[i]*sqrtn
a<-table.element(a,round(mytstat,4))
a<-table.element(a,round(1-pt(abs(mytstat),lengthx),6))
a<-table.row.end(a)
}
a<-table.end(a)
table.save(a,file='mytable.tab')
a<-table.start()
a<-table.row.start(a)
a<-table.element(a,'Partial Autocorrelation Function',4,TRUE)
a<-table.row.end(a)
a<-table.row.start(a)
a<-table.element(a,'Time lag k',header=TRUE)
a<-table.element(a,hyperlink('basics.htm','PACF(k)','click here for more information about the Partial Autocorrelation Function'),header=TRUE)
a<-table.element(a,'T-STAT',header=TRUE)
a<-table.element(a,'P-value',header=TRUE)
a<-table.row.end(a)
for (i in 1:par1) {
a<-table.row.start(a)
a<-table.element(a,i,header=TRUE)
a<-table.element(a,round(mypacf[i],6))
mytstat <- mypacf[i]*sqrtn
a<-table.element(a,round(mytstat,4))
a<-table.element(a,round(1-pt(abs(mytstat),lengthx),6))
a<-table.row.end(a)
}
a<-table.end(a)
table.save(a,file='mytable1.tab')