Free Statistics
of Irreproducible Research!
Description of Statistical Computation | |||||||||||||||||||||||||||||||||||||||
|---|---|---|---|---|---|---|---|---|---|---|---|---|---|---|---|---|---|---|---|---|---|---|---|---|---|---|---|---|---|---|---|---|---|---|---|---|---|---|---|
| Author's title | |||||||||||||||||||||||||||||||||||||||
| Author | *The author of this computation has been verified* | ||||||||||||||||||||||||||||||||||||||
| R Software Module | rwasp_fitdistrnorm.wasp | ||||||||||||||||||||||||||||||||||||||
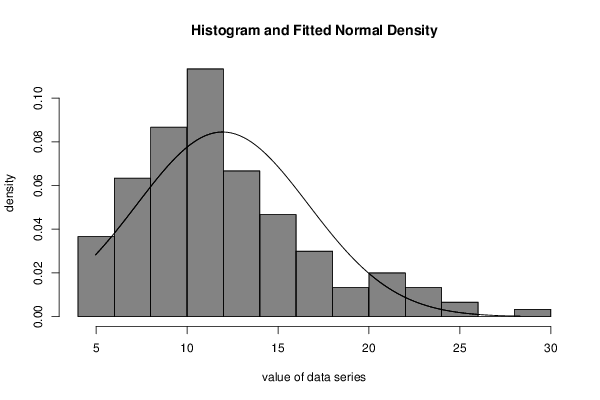
| Title produced by software | ML Fitting and QQ Plot- Normal Distribution | ||||||||||||||||||||||||||||||||||||||
| Date of computation | Tue, 13 Oct 2015 15:16:21 +0100 | ||||||||||||||||||||||||||||||||||||||
| Cite this page as follows | Statistical Computations at FreeStatistics.org, Office for Research Development and Education, URL https://freestatistics.org/blog/index.php?v=date/2015/Oct/13/t1444745796tqlzk0e494veqb6.htm/, Retrieved Sat, 18 May 2024 08:08:03 +0000 | ||||||||||||||||||||||||||||||||||||||
| Statistical Computations at FreeStatistics.org, Office for Research Development and Education, URL https://freestatistics.org/blog/index.php?pk=282359, Retrieved Sat, 18 May 2024 08:08:03 +0000 | |||||||||||||||||||||||||||||||||||||||
| QR Codes: | |||||||||||||||||||||||||||||||||||||||
|
| |||||||||||||||||||||||||||||||||||||||
| Original text written by user: | |||||||||||||||||||||||||||||||||||||||
| IsPrivate? | No (this computation is public) | ||||||||||||||||||||||||||||||||||||||
| User-defined keywords | |||||||||||||||||||||||||||||||||||||||
| Estimated Impact | 114 | ||||||||||||||||||||||||||||||||||||||
Tree of Dependent Computations | |||||||||||||||||||||||||||||||||||||||
| Family? (F = Feedback message, R = changed R code, M = changed R Module, P = changed Parameters, D = changed Data) | |||||||||||||||||||||||||||||||||||||||
| - [ML Fitting and QQ Plot- Normal Distribution] [] [2015-10-13 14:16:21] [85e7a66a1e5d24b56c3cf5eab9332807] [Current] | |||||||||||||||||||||||||||||||||||||||
| Feedback Forum | |||||||||||||||||||||||||||||||||||||||
Post a new message | |||||||||||||||||||||||||||||||||||||||
Dataset | |||||||||||||||||||||||||||||||||||||||
| Dataseries X: | |||||||||||||||||||||||||||||||||||||||
21.58127139 10.42450297 12.37801537 10.10450256 15.77377604 11.06266547 5.139202194 11.18702356 24.27376187 12.84564713 11.68791432 10.09897056 15.89390414 5.843944489 11.32322502 9.290740246 12.29474492 6.595906682 9.603023077 8.753854361 12.55926017 19.8893087 10.73308873 5.425404849 15.40019856 7.58944995 15.38352425 12.55321297 12.05896887 17.20278618 10.02673577 22.08479926 5.424564132 12.47295926 8.25514066 28.30940437 5.796056651 10.21444142 6.078363086 7.321889046 10.84297515 17.69667122 13.00629009 10.9409192 17.3528054 20.11906525 11.62044019 11.99642009 8.289611357 13.61890889 23.3944305 8.456663248 12.57494526 6.150872383 15.06249021 5.686739789 18.912865 8.899258116 9.545354678 15.47121826 4.96725194 5.987965776 7.381378294 8.580784036 21.29573663 5.254182402 13.15558334 17.61413509 11.93646783 11.23557645 10.22737976 11.27452788 5.321272968 11.23008944 6.085126242 7.379482134 17.137257 22.34943025 10.07236686 13.55806294 9.328020328 10.27338002 11.85881934 13.3819107 8.933773034 9.607237894 9.742878823 19.23890782 8.107944382 8.844657536 22.38687799 24.82536746 11.14879364 8.310395981 7.984436153 14.6664662 11.4315736 10.27820119 12.90148119 6.939067224 11.68312258 11.36564229 16.29275723 11.77329988 12.58749411 7.922124656 9.996791627 9.45192393 9.176447536 8.295886262 10.55596454 8.428142372 8.796051032 14.17570603 7.341841345 8.075367303 11.99161672 7.367060653 7.905022441 13.6101064 14.2775341 12.43732949 14.37704754 21.54267881 5.159183146 15.25379184 14.68075446 7.428958033 9.370973786 14.144081 20.88033574 19.5693376 7.243606904 10.67376859 8.330610033 12.99266494 8.628082267 12.22520767 11.17504583 20.24287416 17.15951065 16.06260529 11.71870929 7.544208197 15.31102532 13.5516997 6.582061828 17.12167215 6.836000467 10.7459511 | |||||||||||||||||||||||||||||||||||||||
Tables (Output of Computation) | |||||||||||||||||||||||||||||||||||||||
| |||||||||||||||||||||||||||||||||||||||
Figures (Output of Computation) | |||||||||||||||||||||||||||||||||||||||
Input Parameters & R Code | |||||||||||||||||||||||||||||||||||||||
| Parameters (Session): | |||||||||||||||||||||||||||||||||||||||
| par1 = 8 ; par2 = 0 ; | |||||||||||||||||||||||||||||||||||||||
| Parameters (R input): | |||||||||||||||||||||||||||||||||||||||
| par1 = 8 ; par2 = 0 ; | |||||||||||||||||||||||||||||||||||||||
| R code (references can be found in the software module): | |||||||||||||||||||||||||||||||||||||||
library(MASS) | |||||||||||||||||||||||||||||||||||||||