Free Statistics

of Irreproducible Research!

Author's title

Author*The author of this computation has been verified*
R Software Modulerwasp_notchedbox1.wasp
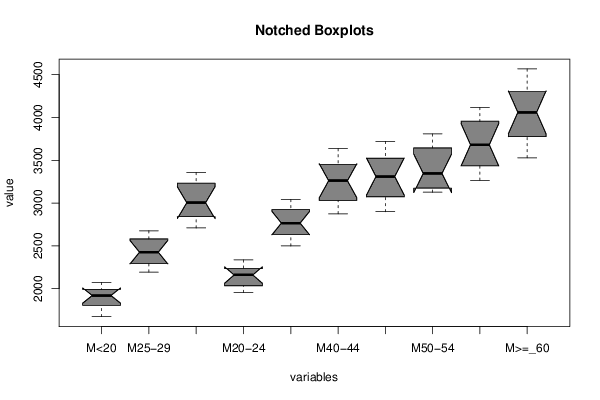
Title produced by softwareNotched Boxplots
Date of computationMon, 30 Nov 2015 11:39:54 +0000
Cite this page as followsStatistical Computations at FreeStatistics.org, Office for Research Development and Education, URL https://freestatistics.org/blog/index.php?v=date/2015/Nov/30/t14488836573w2n2umbyj1jlhn.htm/, Retrieved Tue, 14 May 2024 02:44:31 +0000
Statistical Computations at FreeStatistics.org, Office for Research Development and Education, URL https://freestatistics.org/blog/index.php?pk=284571, Retrieved Tue, 14 May 2024 02:44:31 +0000
QR Codes:

Original text written by user:
IsPrivate?No (this computation is public)
User-defined keywords
Estimated Impact112
Family? (F = Feedback message, R = changed R code, M = changed R Module, P = changed Parameters, D = changed Data)
-       [Notched Boxplots] [notched boxplot m...] [2015-11-30 11:39:54] [f11610c88fbfb47d4676bbbd4616bddc] [Current]
Feedback Forum

Post a new message
Dataseries X:
1673 2194 2709 1955 2499 2875 2899 3127 3266 3529
1724 2236 2785 1972 2572 2976 2963 3214 3410 3649
1755 2267 2820 1980 2616 3044 3065 3130 3473 3748
1857 2325 2861 2084 2653 3017 3077 3133 3375 3802
1884 2367 2935 2112 2718 3106 3178 3222 3462 3953
1952 2426 3004 2160 2766 3261 3310 3346 3681 4060
1920 2483 3112 2161 2839 3356 3400 3450 3789 4164
1964 2535 3176 2198 2868 3408 3466 3597 3876 4224
2020 2631 3288 2270 2977 3493 3585 3694 4036 4378
2036 2657 3352 2295 3015 3576 3692 3791 4086 4475
2073 2676 3358 2336 3042 3636 3721 3808 4116 4567


Summary of computational transaction
Raw Inputview raw input (R code)
Raw Outputview raw output of R engine
Computing time0 seconds
R Server'Gertrude Mary Cox' @ cox.wessa.net

\begin{tabular}{lllllllll}
\hline
Summary of computational transaction \tabularnewline
Raw Input & view raw input (R code)  \tabularnewline
Raw Output & view raw output of R engine  \tabularnewline
Computing time & 0 seconds \tabularnewline
R Server & 'Gertrude Mary Cox' @ cox.wessa.net \tabularnewline
\hline
\end{tabular}
%Source: https://freestatistics.org/blog/index.php?pk=284571&T=0

[TABLE]
[ROW][C]Summary of computational transaction[/C][/ROW]
[ROW][C]Raw Input[/C][C]view raw input (R code) [/C][/ROW]
[ROW][C]Raw Output[/C][C]view raw output of R engine [/C][/ROW]
[ROW][C]Computing time[/C][C]0 seconds[/C][/ROW]
[ROW][C]R Server[/C][C]'Gertrude Mary Cox' @ cox.wessa.net[/C][/ROW]
[/TABLE]
Source: https://freestatistics.org/blog/index.php?pk=284571&T=0

Globally Unique Identifier (entire table): ba.freestatistics.org/blog/index.php?pk=284571&T=0

As an alternative you can also use a QR Code:  

The GUIDs for individual cells are displayed in the table below:

Summary of computational transaction
Raw Inputview raw input (R code)
Raw Outputview raw output of R engine
Computing time0 seconds
R Server'Gertrude Mary Cox' @ cox.wessa.net


Boxplot statistics
Variablelower whiskerlower hingemedianupper hingeupper whisker
M<2016731806192019922073
M25-2921942296242625832676
M35-3927092840.5300432323358
M20-2419552032216022342336
M30-3424992634.527662922.53042
M40-4428753030.532613450.53636
M45-492899307133103525.53721
M50-5431273173.533463645.53808
M55-5932663436368139564116
M>=_6035293775406043014567

\begin{tabular}{lllllllll}
\hline
Boxplot statistics \tabularnewline
Variable & lower whisker & lower hinge & median & upper hinge & upper whisker \tabularnewline
M<20 & 1673 & 1806 & 1920 & 1992 & 2073 \tabularnewline
M25-29 & 2194 & 2296 & 2426 & 2583 & 2676 \tabularnewline
M35-39 & 2709 & 2840.5 & 3004 & 3232 & 3358 \tabularnewline
M20-24 & 1955 & 2032 & 2160 & 2234 & 2336 \tabularnewline
M30-34 & 2499 & 2634.5 & 2766 & 2922.5 & 3042 \tabularnewline
M40-44 & 2875 & 3030.5 & 3261 & 3450.5 & 3636 \tabularnewline
M45-49 & 2899 & 3071 & 3310 & 3525.5 & 3721 \tabularnewline
M50-54 & 3127 & 3173.5 & 3346 & 3645.5 & 3808 \tabularnewline
M55-59 & 3266 & 3436 & 3681 & 3956 & 4116 \tabularnewline
M>=_60 & 3529 & 3775 & 4060 & 4301 & 4567 \tabularnewline
\hline
\end{tabular}
%Source: https://freestatistics.org/blog/index.php?pk=284571&T=1

[TABLE]
[ROW][C]Boxplot statistics[/C][/ROW]
[ROW][C]Variable[/C][C]lower whisker[/C][C]lower hinge[/C][C]median[/C][C]upper hinge[/C][C]upper whisker[/C][/ROW]
[ROW][C]M<20[/C][C]1673[/C][C]1806[/C][C]1920[/C][C]1992[/C][C]2073[/C][/ROW]
[ROW][C]M25-29[/C][C]2194[/C][C]2296[/C][C]2426[/C][C]2583[/C][C]2676[/C][/ROW]
[ROW][C]M35-39[/C][C]2709[/C][C]2840.5[/C][C]3004[/C][C]3232[/C][C]3358[/C][/ROW]
[ROW][C]M20-24[/C][C]1955[/C][C]2032[/C][C]2160[/C][C]2234[/C][C]2336[/C][/ROW]
[ROW][C]M30-34[/C][C]2499[/C][C]2634.5[/C][C]2766[/C][C]2922.5[/C][C]3042[/C][/ROW]
[ROW][C]M40-44[/C][C]2875[/C][C]3030.5[/C][C]3261[/C][C]3450.5[/C][C]3636[/C][/ROW]
[ROW][C]M45-49[/C][C]2899[/C][C]3071[/C][C]3310[/C][C]3525.5[/C][C]3721[/C][/ROW]
[ROW][C]M50-54[/C][C]3127[/C][C]3173.5[/C][C]3346[/C][C]3645.5[/C][C]3808[/C][/ROW]
[ROW][C]M55-59[/C][C]3266[/C][C]3436[/C][C]3681[/C][C]3956[/C][C]4116[/C][/ROW]
[ROW][C]M>=_60[/C][C]3529[/C][C]3775[/C][C]4060[/C][C]4301[/C][C]4567[/C][/ROW]
[/TABLE]
Source: https://freestatistics.org/blog/index.php?pk=284571&T=1

Globally Unique Identifier (entire table): ba.freestatistics.org/blog/index.php?pk=284571&T=1

As an alternative you can also use a QR Code:  

The GUIDs for individual cells are displayed in the table below:

Boxplot statistics
Variablelower whiskerlower hingemedianupper hingeupper whisker
M<2016731806192019922073
M25-2921942296242625832676
M35-3927092840.5300432323358
M20-2419552032216022342336
M30-3424992634.527662922.53042
M40-4428753030.532613450.53636
M45-492899307133103525.53721
M50-5431273173.533463645.53808
M55-5932663436368139564116
M>=_6035293775406043014567


Boxplot Notches
Variablelower boundmedianupper bound
M<201831.3918460554919202008.60815394451
M25-292289.2766656877724262562.72333431223
M35-392817.4941275845330043190.50587241547
M20-242063.7696392645621602256.23036073544
M30-342628.8002777633327662903.19972223667
M40-443060.917071738232613461.0829282618
M45-493093.4816883452633103526.51831165474
M50-543121.1448996676933463570.85510033231
M55-593433.2782792949136813928.72172070509
M>=_603809.4199517483140604310.58004825169

\begin{tabular}{lllllllll}
\hline
Boxplot Notches \tabularnewline
Variable & lower bound & median & upper bound \tabularnewline
M<20 & 1831.39184605549 & 1920 & 2008.60815394451 \tabularnewline
M25-29 & 2289.27666568777 & 2426 & 2562.72333431223 \tabularnewline
M35-39 & 2817.49412758453 & 3004 & 3190.50587241547 \tabularnewline
M20-24 & 2063.76963926456 & 2160 & 2256.23036073544 \tabularnewline
M30-34 & 2628.80027776333 & 2766 & 2903.19972223667 \tabularnewline
M40-44 & 3060.9170717382 & 3261 & 3461.0829282618 \tabularnewline
M45-49 & 3093.48168834526 & 3310 & 3526.51831165474 \tabularnewline
M50-54 & 3121.14489966769 & 3346 & 3570.85510033231 \tabularnewline
M55-59 & 3433.27827929491 & 3681 & 3928.72172070509 \tabularnewline
M>=_60 & 3809.41995174831 & 4060 & 4310.58004825169 \tabularnewline
\hline
\end{tabular}
%Source: https://freestatistics.org/blog/index.php?pk=284571&T=2

[TABLE]
[ROW][C]Boxplot Notches[/C][/ROW]
[ROW][C]Variable[/C][C]lower bound[/C][C]median[/C][C]upper bound[/C][/ROW]
[ROW][C]M<20[/C][C]1831.39184605549[/C][C]1920[/C][C]2008.60815394451[/C][/ROW]
[ROW][C]M25-29[/C][C]2289.27666568777[/C][C]2426[/C][C]2562.72333431223[/C][/ROW]
[ROW][C]M35-39[/C][C]2817.49412758453[/C][C]3004[/C][C]3190.50587241547[/C][/ROW]
[ROW][C]M20-24[/C][C]2063.76963926456[/C][C]2160[/C][C]2256.23036073544[/C][/ROW]
[ROW][C]M30-34[/C][C]2628.80027776333[/C][C]2766[/C][C]2903.19972223667[/C][/ROW]
[ROW][C]M40-44[/C][C]3060.9170717382[/C][C]3261[/C][C]3461.0829282618[/C][/ROW]
[ROW][C]M45-49[/C][C]3093.48168834526[/C][C]3310[/C][C]3526.51831165474[/C][/ROW]
[ROW][C]M50-54[/C][C]3121.14489966769[/C][C]3346[/C][C]3570.85510033231[/C][/ROW]
[ROW][C]M55-59[/C][C]3433.27827929491[/C][C]3681[/C][C]3928.72172070509[/C][/ROW]
[ROW][C]M>=_60[/C][C]3809.41995174831[/C][C]4060[/C][C]4310.58004825169[/C][/ROW]
[/TABLE]
Source: https://freestatistics.org/blog/index.php?pk=284571&T=2

Globally Unique Identifier (entire table): ba.freestatistics.org/blog/index.php?pk=284571&T=2

As an alternative you can also use a QR Code:  

The GUIDs for individual cells are displayed in the table below:

Boxplot Notches
Variablelower boundmedianupper bound
M<201831.3918460554919202008.60815394451
M25-292289.2766656877724262562.72333431223
M35-392817.4941275845330043190.50587241547
M20-242063.7696392645621602256.23036073544
M30-342628.8002777633327662903.19972223667
M40-443060.917071738232613461.0829282618
M45-493093.4816883452633103526.51831165474
M50-543121.1448996676933463570.85510033231
M55-593433.2782792949136813928.72172070509
M>=_603809.4199517483140604310.58004825169


Parameters (Session):
par1 = grey ;
Parameters (R input):
par1 = grey ;
R code (references can be found in the software module):
z <- na.omit(as.data.frame(t(y)))
bitmap(file='test1.png')
(r<-boxplot(z ,xlab=xlab,ylab=ylab,main=main,notch=TRUE,col=par1))
dev.off()
load(file='createtable')
a<-table.start()
a<-table.row.start(a)
a<-table.element(a,hyperlink('overview.htm','Boxplot statistics','Boxplot overview'),6,TRUE)
a<-table.row.end(a)
a<-table.row.start(a)
a<-table.element(a,'Variable',1,TRUE)
a<-table.element(a,hyperlink('lower_whisker.htm','lower whisker','definition of lower whisker'),1,TRUE)
a<-table.element(a,hyperlink('lower_hinge.htm','lower hinge','definition of lower hinge'),1,TRUE)
a<-table.element(a,hyperlink('central_tendency.htm','median','definitions about measures of central tendency'),1,TRUE)
a<-table.element(a,hyperlink('upper_hinge.htm','upper hinge','definition of upper hinge'),1,TRUE)
a<-table.element(a,hyperlink('upper_whisker.htm','upper whisker','definition of upper whisker'),1,TRUE)
a<-table.row.end(a)
for (i in 1:length(y[,1]))
{
a<-table.row.start(a)
a<-table.element(a,dimnames(t(x))[[2]][i],1,TRUE)
for (j in 1:5)
{
a<-table.element(a,r$stats[j,i])
}
a<-table.row.end(a)
}
a<-table.end(a)
table.save(a,file='mytable.tab')
a<-table.start()
a<-table.row.start(a)
a<-table.element(a,'Boxplot Notches',4,TRUE)
a<-table.row.end(a)
a<-table.row.start(a)
a<-table.element(a,'Variable',1,TRUE)
a<-table.element(a,'lower bound',1,TRUE)
a<-table.element(a,'median',1,TRUE)
a<-table.element(a,'upper bound',1,TRUE)
a<-table.row.end(a)
for (i in 1:length(y[,1]))
{
a<-table.row.start(a)
a<-table.element(a,dimnames(t(x))[[2]][i],1,TRUE)
a<-table.element(a,r$conf[1,i])
a<-table.element(a,r$stats[3,i])
a<-table.element(a,r$conf[2,i])
a<-table.row.end(a)
}
a<-table.end(a)
table.save(a,file='mytable1.tab')