Free Statistics

of Irreproducible Research!

Author's title

Author*Unverified author*
R Software Modulerwasp_exponentialsmoothing.wasp
Title produced by softwareExponential Smoothing
Date of computationSun, 29 Nov 2015 22:53:59 +0000
Cite this page as followsStatistical Computations at FreeStatistics.org, Office for Research Development and Education, URL https://freestatistics.org/blog/index.php?v=date/2015/Nov/29/t1448837669l58u3u22poj7di3.htm/, Retrieved Wed, 15 May 2024 14:08:24 +0000
Statistical Computations at FreeStatistics.org, Office for Research Development and Education, URL https://freestatistics.org/blog/index.php?pk=284555, Retrieved Wed, 15 May 2024 14:08:24 +0000
QR Codes:

Original text written by user:
IsPrivate?No (this computation is public)
User-defined keywords
Estimated Impact65
Family? (F = Feedback message, R = changed R code, M = changed R Module, P = changed Parameters, D = changed Data)
-       [Exponential Smoothing] [Exponential Smoot...] [2015-11-29 22:53:59] [e4113772e8352caea1c7944bf41cc9e0] [Current]
Feedback Forum

Post a new message
Dataseries X:
789
811
996
778
603
990
735
800
706
766
870
647
726
784
884
696
893
674
703
799
793
799
1022
758
1021
944
915
864
1022
891
1087
822
890
1092
967
833
1104
1063
1103
1039
1185
1047
1155
878
879
1133
920
943
938
900
781
1040
792
653
866
679
799
760
699
762


Summary of computational transaction
Raw Inputview raw input (R code)
Raw Outputview raw output of R engine
Computing time2 seconds
R Server'Gertrude Mary Cox' @ cox.wessa.net

\begin{tabular}{lllllllll}
\hline
Summary of computational transaction \tabularnewline
Raw Input & view raw input (R code)  \tabularnewline
Raw Output & view raw output of R engine  \tabularnewline
Computing time & 2 seconds \tabularnewline
R Server & 'Gertrude Mary Cox' @ cox.wessa.net \tabularnewline
\hline
\end{tabular}
%Source: https://freestatistics.org/blog/index.php?pk=284555&T=0

[TABLE]
[ROW][C]Summary of computational transaction[/C][/ROW]
[ROW][C]Raw Input[/C][C]view raw input (R code) [/C][/ROW]
[ROW][C]Raw Output[/C][C]view raw output of R engine [/C][/ROW]
[ROW][C]Computing time[/C][C]2 seconds[/C][/ROW]
[ROW][C]R Server[/C][C]'Gertrude Mary Cox' @ cox.wessa.net[/C][/ROW]
[/TABLE]
Source: https://freestatistics.org/blog/index.php?pk=284555&T=0

Globally Unique Identifier (entire table): ba.freestatistics.org/blog/index.php?pk=284555&T=0

As an alternative you can also use a QR Code:  

The GUIDs for individual cells are displayed in the table below:

Summary of computational transaction
Raw Inputview raw input (R code)
Raw Outputview raw output of R engine
Computing time2 seconds
R Server'Gertrude Mary Cox' @ cox.wessa.net


Estimated Parameters of Exponential Smoothing
ParameterValue
alpha0.327014027408124
beta0
gamma0.767901477081441

\begin{tabular}{lllllllll}
\hline
Estimated Parameters of Exponential Smoothing \tabularnewline
Parameter & Value \tabularnewline
alpha & 0.327014027408124 \tabularnewline
beta & 0 \tabularnewline
gamma & 0.767901477081441 \tabularnewline
\hline
\end{tabular}
%Source: https://freestatistics.org/blog/index.php?pk=284555&T=1

[TABLE]
[ROW][C]Estimated Parameters of Exponential Smoothing[/C][/ROW]
[ROW][C]Parameter[/C][C]Value[/C][/ROW]
[ROW][C]alpha[/C][C]0.327014027408124[/C][/ROW]
[ROW][C]beta[/C][C]0[/C][/ROW]
[ROW][C]gamma[/C][C]0.767901477081441[/C][/ROW]
[/TABLE]
Source: https://freestatistics.org/blog/index.php?pk=284555&T=1

Globally Unique Identifier (entire table): ba.freestatistics.org/blog/index.php?pk=284555&T=1

As an alternative you can also use a QR Code:  

The GUIDs for individual cells are displayed in the table below:

Estimated Parameters of Exponential Smoothing
ParameterValue
alpha0.327014027408124
beta0
gamma0.767901477081441


Interpolation Forecasts of Exponential Smoothing
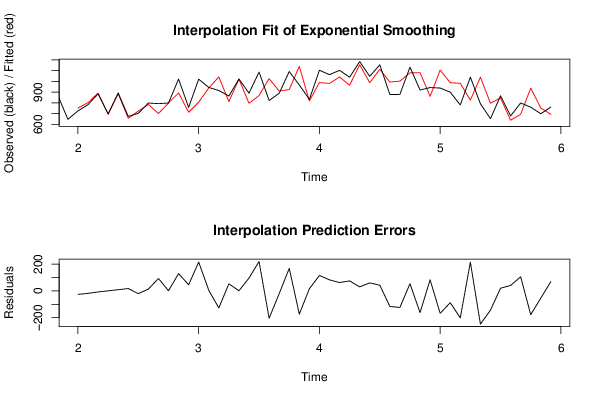
tObservedFittedResiduals
13726752.521367521368-26.5213675213677
14784802.588310180636-18.5883101806359
15884892.291140537224-8.29114053722355
16696695.9446231431410.0553768568588566
17893884.6192006835968.3807993164038
18674656.76630815242117.2336918475788
19703724.100102328744-21.1001023287436
20799785.31487475229913.6851252477005
21793700.94657120660392.0534287933968
22799798.4974688911940.502531108806011
231022893.359938811118128.640061188882
24758712.87517850465745.1248214953433
251021806.790534083294214.209465916706
26944939.6795363948674.320463605133
279151042.19529973966-127.195299739657
28864811.27882540612652.7211745938741
2910221021.478327021840.521672978158222
30891795.63044902048695.369550979514
311087868.705361659918218.294638340082
328221026.18212307442-204.182123074416
33890911.067887618326-21.0678876183256
341092924.314221379265167.685778620735
359671140.06775819833-173.067758198329
36833817.7607250781115.2392749218899
371104989.283820727503114.716179272497
381063981.16923112151681.8307688784836
3911031041.0663249722361.9336750277666
401039964.97615943836174.0238405616388
4111851155.1659118554929.834088144512
421047987.91974776002859.0802522399722
4311551112.6536282506842.3463717493235
44878994.262373071389-116.262373071389
458791002.53017134302-123.530171343023
4611331079.815327314753.1846726852998
479201082.02842474663-162.028424746635
48943860.64602063240882.3539793675916
499381105.52492933096-167.52492933096
50900988.118788070764-88.1187880707644
51781982.157434951298-201.157434951298
521040826.280825405556213.719174594444
537921039.31622546124-247.316225461238
54653796.552056251281-143.552056251281
55866846.37447886048719.6255211395127
56679638.58626171419340.4137382858066
57799694.333443057905104.666556942095
58760937.566050576732-177.566050576732
59699753.101110383585-54.1011103835849
60762693.30608251951768.6939174804829

\begin{tabular}{lllllllll}
\hline
Interpolation Forecasts of Exponential Smoothing \tabularnewline
t & Observed & Fitted & Residuals \tabularnewline
13 & 726 & 752.521367521368 & -26.5213675213677 \tabularnewline
14 & 784 & 802.588310180636 & -18.5883101806359 \tabularnewline
15 & 884 & 892.291140537224 & -8.29114053722355 \tabularnewline
16 & 696 & 695.944623143141 & 0.0553768568588566 \tabularnewline
17 & 893 & 884.619200683596 & 8.3807993164038 \tabularnewline
18 & 674 & 656.766308152421 & 17.2336918475788 \tabularnewline
19 & 703 & 724.100102328744 & -21.1001023287436 \tabularnewline
20 & 799 & 785.314874752299 & 13.6851252477005 \tabularnewline
21 & 793 & 700.946571206603 & 92.0534287933968 \tabularnewline
22 & 799 & 798.497468891194 & 0.502531108806011 \tabularnewline
23 & 1022 & 893.359938811118 & 128.640061188882 \tabularnewline
24 & 758 & 712.875178504657 & 45.1248214953433 \tabularnewline
25 & 1021 & 806.790534083294 & 214.209465916706 \tabularnewline
26 & 944 & 939.679536394867 & 4.320463605133 \tabularnewline
27 & 915 & 1042.19529973966 & -127.195299739657 \tabularnewline
28 & 864 & 811.278825406126 & 52.7211745938741 \tabularnewline
29 & 1022 & 1021.47832702184 & 0.521672978158222 \tabularnewline
30 & 891 & 795.630449020486 & 95.369550979514 \tabularnewline
31 & 1087 & 868.705361659918 & 218.294638340082 \tabularnewline
32 & 822 & 1026.18212307442 & -204.182123074416 \tabularnewline
33 & 890 & 911.067887618326 & -21.0678876183256 \tabularnewline
34 & 1092 & 924.314221379265 & 167.685778620735 \tabularnewline
35 & 967 & 1140.06775819833 & -173.067758198329 \tabularnewline
36 & 833 & 817.76072507811 & 15.2392749218899 \tabularnewline
37 & 1104 & 989.283820727503 & 114.716179272497 \tabularnewline
38 & 1063 & 981.169231121516 & 81.8307688784836 \tabularnewline
39 & 1103 & 1041.06632497223 & 61.9336750277666 \tabularnewline
40 & 1039 & 964.976159438361 & 74.0238405616388 \tabularnewline
41 & 1185 & 1155.16591185549 & 29.834088144512 \tabularnewline
42 & 1047 & 987.919747760028 & 59.0802522399722 \tabularnewline
43 & 1155 & 1112.65362825068 & 42.3463717493235 \tabularnewline
44 & 878 & 994.262373071389 & -116.262373071389 \tabularnewline
45 & 879 & 1002.53017134302 & -123.530171343023 \tabularnewline
46 & 1133 & 1079.8153273147 & 53.1846726852998 \tabularnewline
47 & 920 & 1082.02842474663 & -162.028424746635 \tabularnewline
48 & 943 & 860.646020632408 & 82.3539793675916 \tabularnewline
49 & 938 & 1105.52492933096 & -167.52492933096 \tabularnewline
50 & 900 & 988.118788070764 & -88.1187880707644 \tabularnewline
51 & 781 & 982.157434951298 & -201.157434951298 \tabularnewline
52 & 1040 & 826.280825405556 & 213.719174594444 \tabularnewline
53 & 792 & 1039.31622546124 & -247.316225461238 \tabularnewline
54 & 653 & 796.552056251281 & -143.552056251281 \tabularnewline
55 & 866 & 846.374478860487 & 19.6255211395127 \tabularnewline
56 & 679 & 638.586261714193 & 40.4137382858066 \tabularnewline
57 & 799 & 694.333443057905 & 104.666556942095 \tabularnewline
58 & 760 & 937.566050576732 & -177.566050576732 \tabularnewline
59 & 699 & 753.101110383585 & -54.1011103835849 \tabularnewline
60 & 762 & 693.306082519517 & 68.6939174804829 \tabularnewline
\hline
\end{tabular}
%Source: https://freestatistics.org/blog/index.php?pk=284555&T=2

[TABLE]
[ROW][C]Interpolation Forecasts of Exponential Smoothing[/C][/ROW]
[ROW][C]t[/C][C]Observed[/C][C]Fitted[/C][C]Residuals[/C][/ROW]
[ROW][C]13[/C][C]726[/C][C]752.521367521368[/C][C]-26.5213675213677[/C][/ROW]
[ROW][C]14[/C][C]784[/C][C]802.588310180636[/C][C]-18.5883101806359[/C][/ROW]
[ROW][C]15[/C][C]884[/C][C]892.291140537224[/C][C]-8.29114053722355[/C][/ROW]
[ROW][C]16[/C][C]696[/C][C]695.944623143141[/C][C]0.0553768568588566[/C][/ROW]
[ROW][C]17[/C][C]893[/C][C]884.619200683596[/C][C]8.3807993164038[/C][/ROW]
[ROW][C]18[/C][C]674[/C][C]656.766308152421[/C][C]17.2336918475788[/C][/ROW]
[ROW][C]19[/C][C]703[/C][C]724.100102328744[/C][C]-21.1001023287436[/C][/ROW]
[ROW][C]20[/C][C]799[/C][C]785.314874752299[/C][C]13.6851252477005[/C][/ROW]
[ROW][C]21[/C][C]793[/C][C]700.946571206603[/C][C]92.0534287933968[/C][/ROW]
[ROW][C]22[/C][C]799[/C][C]798.497468891194[/C][C]0.502531108806011[/C][/ROW]
[ROW][C]23[/C][C]1022[/C][C]893.359938811118[/C][C]128.640061188882[/C][/ROW]
[ROW][C]24[/C][C]758[/C][C]712.875178504657[/C][C]45.1248214953433[/C][/ROW]
[ROW][C]25[/C][C]1021[/C][C]806.790534083294[/C][C]214.209465916706[/C][/ROW]
[ROW][C]26[/C][C]944[/C][C]939.679536394867[/C][C]4.320463605133[/C][/ROW]
[ROW][C]27[/C][C]915[/C][C]1042.19529973966[/C][C]-127.195299739657[/C][/ROW]
[ROW][C]28[/C][C]864[/C][C]811.278825406126[/C][C]52.7211745938741[/C][/ROW]
[ROW][C]29[/C][C]1022[/C][C]1021.47832702184[/C][C]0.521672978158222[/C][/ROW]
[ROW][C]30[/C][C]891[/C][C]795.630449020486[/C][C]95.369550979514[/C][/ROW]
[ROW][C]31[/C][C]1087[/C][C]868.705361659918[/C][C]218.294638340082[/C][/ROW]
[ROW][C]32[/C][C]822[/C][C]1026.18212307442[/C][C]-204.182123074416[/C][/ROW]
[ROW][C]33[/C][C]890[/C][C]911.067887618326[/C][C]-21.0678876183256[/C][/ROW]
[ROW][C]34[/C][C]1092[/C][C]924.314221379265[/C][C]167.685778620735[/C][/ROW]
[ROW][C]35[/C][C]967[/C][C]1140.06775819833[/C][C]-173.067758198329[/C][/ROW]
[ROW][C]36[/C][C]833[/C][C]817.76072507811[/C][C]15.2392749218899[/C][/ROW]
[ROW][C]37[/C][C]1104[/C][C]989.283820727503[/C][C]114.716179272497[/C][/ROW]
[ROW][C]38[/C][C]1063[/C][C]981.169231121516[/C][C]81.8307688784836[/C][/ROW]
[ROW][C]39[/C][C]1103[/C][C]1041.06632497223[/C][C]61.9336750277666[/C][/ROW]
[ROW][C]40[/C][C]1039[/C][C]964.976159438361[/C][C]74.0238405616388[/C][/ROW]
[ROW][C]41[/C][C]1185[/C][C]1155.16591185549[/C][C]29.834088144512[/C][/ROW]
[ROW][C]42[/C][C]1047[/C][C]987.919747760028[/C][C]59.0802522399722[/C][/ROW]
[ROW][C]43[/C][C]1155[/C][C]1112.65362825068[/C][C]42.3463717493235[/C][/ROW]
[ROW][C]44[/C][C]878[/C][C]994.262373071389[/C][C]-116.262373071389[/C][/ROW]
[ROW][C]45[/C][C]879[/C][C]1002.53017134302[/C][C]-123.530171343023[/C][/ROW]
[ROW][C]46[/C][C]1133[/C][C]1079.8153273147[/C][C]53.1846726852998[/C][/ROW]
[ROW][C]47[/C][C]920[/C][C]1082.02842474663[/C][C]-162.028424746635[/C][/ROW]
[ROW][C]48[/C][C]943[/C][C]860.646020632408[/C][C]82.3539793675916[/C][/ROW]
[ROW][C]49[/C][C]938[/C][C]1105.52492933096[/C][C]-167.52492933096[/C][/ROW]
[ROW][C]50[/C][C]900[/C][C]988.118788070764[/C][C]-88.1187880707644[/C][/ROW]
[ROW][C]51[/C][C]781[/C][C]982.157434951298[/C][C]-201.157434951298[/C][/ROW]
[ROW][C]52[/C][C]1040[/C][C]826.280825405556[/C][C]213.719174594444[/C][/ROW]
[ROW][C]53[/C][C]792[/C][C]1039.31622546124[/C][C]-247.316225461238[/C][/ROW]
[ROW][C]54[/C][C]653[/C][C]796.552056251281[/C][C]-143.552056251281[/C][/ROW]
[ROW][C]55[/C][C]866[/C][C]846.374478860487[/C][C]19.6255211395127[/C][/ROW]
[ROW][C]56[/C][C]679[/C][C]638.586261714193[/C][C]40.4137382858066[/C][/ROW]
[ROW][C]57[/C][C]799[/C][C]694.333443057905[/C][C]104.666556942095[/C][/ROW]
[ROW][C]58[/C][C]760[/C][C]937.566050576732[/C][C]-177.566050576732[/C][/ROW]
[ROW][C]59[/C][C]699[/C][C]753.101110383585[/C][C]-54.1011103835849[/C][/ROW]
[ROW][C]60[/C][C]762[/C][C]693.306082519517[/C][C]68.6939174804829[/C][/ROW]
[/TABLE]
Source: https://freestatistics.org/blog/index.php?pk=284555&T=2

Globally Unique Identifier (entire table): ba.freestatistics.org/blog/index.php?pk=284555&T=2

As an alternative you can also use a QR Code:  

The GUIDs for individual cells are displayed in the table below:

Interpolation Forecasts of Exponential Smoothing
tObservedFittedResiduals
13726752.521367521368-26.5213675213677
14784802.588310180636-18.5883101806359
15884892.291140537224-8.29114053722355
16696695.9446231431410.0553768568588566
17893884.6192006835968.3807993164038
18674656.76630815242117.2336918475788
19703724.100102328744-21.1001023287436
20799785.31487475229913.6851252477005
21793700.94657120660392.0534287933968
22799798.4974688911940.502531108806011
231022893.359938811118128.640061188882
24758712.87517850465745.1248214953433
251021806.790534083294214.209465916706
26944939.6795363948674.320463605133
279151042.19529973966-127.195299739657
28864811.27882540612652.7211745938741
2910221021.478327021840.521672978158222
30891795.63044902048695.369550979514
311087868.705361659918218.294638340082
328221026.18212307442-204.182123074416
33890911.067887618326-21.0678876183256
341092924.314221379265167.685778620735
359671140.06775819833-173.067758198329
36833817.7607250781115.2392749218899
371104989.283820727503114.716179272497
381063981.16923112151681.8307688784836
3911031041.0663249722361.9336750277666
401039964.97615943836174.0238405616388
4111851155.1659118554929.834088144512
421047987.91974776002859.0802522399722
4311551112.6536282506842.3463717493235
44878994.262373071389-116.262373071389
458791002.53017134302-123.530171343023
4611331079.815327314753.1846726852998
479201082.02842474663-162.028424746635
48943860.64602063240882.3539793675916
499381105.52492933096-167.52492933096
50900988.118788070764-88.1187880707644
51781982.157434951298-201.157434951298
521040826.280825405556213.719174594444
537921039.31622546124-247.316225461238
54653796.552056251281-143.552056251281
55866846.37447886048719.6255211395127
56679638.58626171419340.4137382858066
57799694.333443057905104.666556942095
58760937.566050576732-177.566050576732
59699753.101110383585-54.1011103835849
60762693.30608251951768.6939174804829


Extrapolation Forecasts of Exponential Smoothing
tForecast95% Lower Bound95% Upper Bound
61804.583807164629581.8335698408381027.33404448842
62782.996723098395548.6386827578461017.35476343894
63747.434555321672502.01712742235992.851983220994
64871.742054948814615.7425690876581127.74154080997
65776.631221469929510.4700680203081042.79237491955
66668.366892853704392.418016338344944.315769369065
67849.460889546205564.0597590394281134.86202005298
68645.997930453486351.447717180769940.548143726204
69721.734268887186418.3107184111891025.15781936318
70784.885323442487472.8406570437211096.92998984125
71722.292039047144401.8581196934431042.72595840084
72743.647697713788415.0386297974711072.25676563011

\begin{tabular}{lllllllll}
\hline
Extrapolation Forecasts of Exponential Smoothing \tabularnewline
t & Forecast & 95% Lower Bound & 95% Upper Bound \tabularnewline
61 & 804.583807164629 & 581.833569840838 & 1027.33404448842 \tabularnewline
62 & 782.996723098395 & 548.638682757846 & 1017.35476343894 \tabularnewline
63 & 747.434555321672 & 502.01712742235 & 992.851983220994 \tabularnewline
64 & 871.742054948814 & 615.742569087658 & 1127.74154080997 \tabularnewline
65 & 776.631221469929 & 510.470068020308 & 1042.79237491955 \tabularnewline
66 & 668.366892853704 & 392.418016338344 & 944.315769369065 \tabularnewline
67 & 849.460889546205 & 564.059759039428 & 1134.86202005298 \tabularnewline
68 & 645.997930453486 & 351.447717180769 & 940.548143726204 \tabularnewline
69 & 721.734268887186 & 418.310718411189 & 1025.15781936318 \tabularnewline
70 & 784.885323442487 & 472.840657043721 & 1096.92998984125 \tabularnewline
71 & 722.292039047144 & 401.858119693443 & 1042.72595840084 \tabularnewline
72 & 743.647697713788 & 415.038629797471 & 1072.25676563011 \tabularnewline
\hline
\end{tabular}
%Source: https://freestatistics.org/blog/index.php?pk=284555&T=3

[TABLE]
[ROW][C]Extrapolation Forecasts of Exponential Smoothing[/C][/ROW]
[ROW][C]t[/C][C]Forecast[/C][C]95% Lower Bound[/C][C]95% Upper Bound[/C][/ROW]
[ROW][C]61[/C][C]804.583807164629[/C][C]581.833569840838[/C][C]1027.33404448842[/C][/ROW]
[ROW][C]62[/C][C]782.996723098395[/C][C]548.638682757846[/C][C]1017.35476343894[/C][/ROW]
[ROW][C]63[/C][C]747.434555321672[/C][C]502.01712742235[/C][C]992.851983220994[/C][/ROW]
[ROW][C]64[/C][C]871.742054948814[/C][C]615.742569087658[/C][C]1127.74154080997[/C][/ROW]
[ROW][C]65[/C][C]776.631221469929[/C][C]510.470068020308[/C][C]1042.79237491955[/C][/ROW]
[ROW][C]66[/C][C]668.366892853704[/C][C]392.418016338344[/C][C]944.315769369065[/C][/ROW]
[ROW][C]67[/C][C]849.460889546205[/C][C]564.059759039428[/C][C]1134.86202005298[/C][/ROW]
[ROW][C]68[/C][C]645.997930453486[/C][C]351.447717180769[/C][C]940.548143726204[/C][/ROW]
[ROW][C]69[/C][C]721.734268887186[/C][C]418.310718411189[/C][C]1025.15781936318[/C][/ROW]
[ROW][C]70[/C][C]784.885323442487[/C][C]472.840657043721[/C][C]1096.92998984125[/C][/ROW]
[ROW][C]71[/C][C]722.292039047144[/C][C]401.858119693443[/C][C]1042.72595840084[/C][/ROW]
[ROW][C]72[/C][C]743.647697713788[/C][C]415.038629797471[/C][C]1072.25676563011[/C][/ROW]
[/TABLE]
Source: https://freestatistics.org/blog/index.php?pk=284555&T=3

Globally Unique Identifier (entire table): ba.freestatistics.org/blog/index.php?pk=284555&T=3

As an alternative you can also use a QR Code:  

The GUIDs for individual cells are displayed in the table below:

Extrapolation Forecasts of Exponential Smoothing
tForecast95% Lower Bound95% Upper Bound
61804.583807164629581.8335698408381027.33404448842
62782.996723098395548.6386827578461017.35476343894
63747.434555321672502.01712742235992.851983220994
64871.742054948814615.7425690876581127.74154080997
65776.631221469929510.4700680203081042.79237491955
66668.366892853704392.418016338344944.315769369065
67849.460889546205564.0597590394281134.86202005298
68645.997930453486351.447717180769940.548143726204
69721.734268887186418.3107184111891025.15781936318
70784.885323442487472.8406570437211096.92998984125
71722.292039047144401.8581196934431042.72595840084
72743.647697713788415.0386297974711072.25676563011


Parameters (Session):
par1 = 12 ; par2 = Triple ; par3 = additive ;
Parameters (R input):
par1 = 12 ; par2 = Triple ; par3 = additive ;
R code (references can be found in the software module):
par1 <- as.numeric(par1)
if (par2 == 'Single') K <- 1
if (par2 == 'Double') K <- 2
if (par2 == 'Triple') K <- par1
nx <- length(x)
nxmK <- nx - K
x <- ts(x, frequency = par1)
if (par2 == 'Single') fit <- HoltWinters(x, gamma=F, beta=F)
if (par2 == 'Double') fit <- HoltWinters(x, gamma=F)
if (par2 == 'Triple') fit <- HoltWinters(x, seasonal=par3)
fit
myresid <- x - fit$fitted[,'xhat']
bitmap(file='test1.png')
op <- par(mfrow=c(2,1))
plot(fit,ylab='Observed (black) / Fitted (red)',main='Interpolation Fit of Exponential Smoothing')
plot(myresid,ylab='Residuals',main='Interpolation Prediction Errors')
par(op)
dev.off()
bitmap(file='test2.png')
p <- predict(fit, par1, prediction.interval=TRUE)
np <- length(p[,1])
plot(fit,p,ylab='Observed (black) / Fitted (red)',main='Extrapolation Fit of Exponential Smoothing')
dev.off()
bitmap(file='test3.png')
op <- par(mfrow = c(2,2))
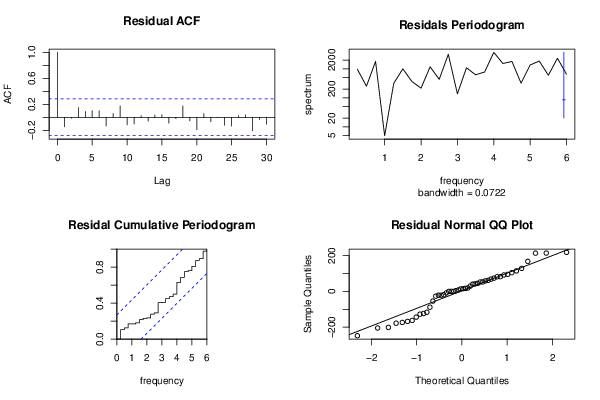
acf(as.numeric(myresid),lag.max = nx/2,main='Residual ACF')
spectrum(myresid,main='Residals Periodogram')
cpgram(myresid,main='Residal Cumulative Periodogram')
qqnorm(myresid,main='Residual Normal QQ Plot')
qqline(myresid)
par(op)
dev.off()
load(file='createtable')
a<-table.start()
a<-table.row.start(a)
a<-table.element(a,'Estimated Parameters of Exponential Smoothing',2,TRUE)
a<-table.row.end(a)
a<-table.row.start(a)
a<-table.element(a,'Parameter',header=TRUE)
a<-table.element(a,'Value',header=TRUE)
a<-table.row.end(a)
a<-table.row.start(a)
a<-table.element(a,'alpha',header=TRUE)
a<-table.element(a,fit$alpha)
a<-table.row.end(a)
a<-table.row.start(a)
a<-table.element(a,'beta',header=TRUE)
a<-table.element(a,fit$beta)
a<-table.row.end(a)
a<-table.row.start(a)
a<-table.element(a,'gamma',header=TRUE)
a<-table.element(a,fit$gamma)
a<-table.row.end(a)
a<-table.end(a)
table.save(a,file='mytable.tab')
a<-table.start()
a<-table.row.start(a)
a<-table.element(a,'Interpolation Forecasts of Exponential Smoothing',4,TRUE)
a<-table.row.end(a)
a<-table.row.start(a)
a<-table.element(a,'t',header=TRUE)
a<-table.element(a,'Observed',header=TRUE)
a<-table.element(a,'Fitted',header=TRUE)
a<-table.element(a,'Residuals',header=TRUE)
a<-table.row.end(a)
for (i in 1:nxmK) {
a<-table.row.start(a)
a<-table.element(a,i+K,header=TRUE)
a<-table.element(a,x[i+K])
a<-table.element(a,fit$fitted[i,'xhat'])
a<-table.element(a,myresid[i])
a<-table.row.end(a)
}
a<-table.end(a)
table.save(a,file='mytable1.tab')
a<-table.start()
a<-table.row.start(a)
a<-table.element(a,'Extrapolation Forecasts of Exponential Smoothing',4,TRUE)
a<-table.row.end(a)
a<-table.row.start(a)
a<-table.element(a,'t',header=TRUE)
a<-table.element(a,'Forecast',header=TRUE)
a<-table.element(a,'95% Lower Bound',header=TRUE)
a<-table.element(a,'95% Upper Bound',header=TRUE)
a<-table.row.end(a)
for (i in 1:np) {
a<-table.row.start(a)
a<-table.element(a,nx+i,header=TRUE)
a<-table.element(a,p[i,'fit'])
a<-table.element(a,p[i,'lwr'])
a<-table.element(a,p[i,'upr'])
a<-table.row.end(a)
}
a<-table.end(a)
table.save(a,file='mytable2.tab')