Free Statistics

of Irreproducible Research!

Author's title

Author*Unverified author*
R Software Modulerwasp_exponentialsmoothing.wasp
Title produced by softwareExponential Smoothing
Date of computationSun, 29 Nov 2015 20:14:57 +0000
Cite this page as followsStatistical Computations at FreeStatistics.org, Office for Research Development and Education, URL https://freestatistics.org/blog/index.php?v=date/2015/Nov/29/t1448828144klyv6zex6l4ryra.htm/, Retrieved Wed, 15 May 2024 09:54:12 +0000
Statistical Computations at FreeStatistics.org, Office for Research Development and Education, URL https://freestatistics.org/blog/index.php?pk=284515, Retrieved Wed, 15 May 2024 09:54:12 +0000
QR Codes:

Original text written by user:
IsPrivate?No (this computation is public)
User-defined keywords
Estimated Impact55
Family? (F = Feedback message, R = changed R code, M = changed R Module, P = changed Parameters, D = changed Data)
-       [Exponential Smoothing] [] [2015-11-29 20:14:57] [5460c453892b15ffecb85c645e1cdda5] [Current]
Feedback Forum

Post a new message
Dataseries X:
94,3
94,6
94,9
95,6
95,4
97,4
98,4
100,5
106,6
106,7
106,8
109
109,3
110,5
113,4
113
113,6
121,2
120,5
120,9
125,8
125,4
125,7
127,7
128,1
130
130,5
130,1
129,6
128,8
128,4
128,3
127,6
127,3
127,7
126,9
125,1
119
118,7
118,9
116,9
117
117
115,5
115,6
117,5
117,6
117,8
119,3
120
120,2
109,4
109
108,8
96,3
96,9
97
111,4
111,8
111,7


Summary of computational transaction
Raw Inputview raw input (R code)
Raw Outputview raw output of R engine
Computing time1 seconds
R Server'Herman Ole Andreas Wold' @ wold.wessa.net

\begin{tabular}{lllllllll}
\hline
Summary of computational transaction \tabularnewline
Raw Input & view raw input (R code)  \tabularnewline
Raw Output & view raw output of R engine  \tabularnewline
Computing time & 1 seconds \tabularnewline
R Server & 'Herman Ole Andreas Wold' @ wold.wessa.net \tabularnewline
\hline
\end{tabular}
%Source: https://freestatistics.org/blog/index.php?pk=284515&T=0

[TABLE]
[ROW][C]Summary of computational transaction[/C][/ROW]
[ROW][C]Raw Input[/C][C]view raw input (R code) [/C][/ROW]
[ROW][C]Raw Output[/C][C]view raw output of R engine [/C][/ROW]
[ROW][C]Computing time[/C][C]1 seconds[/C][/ROW]
[ROW][C]R Server[/C][C]'Herman Ole Andreas Wold' @ wold.wessa.net[/C][/ROW]
[/TABLE]
Source: https://freestatistics.org/blog/index.php?pk=284515&T=0

Globally Unique Identifier (entire table): ba.freestatistics.org/blog/index.php?pk=284515&T=0

As an alternative you can also use a QR Code:  

The GUIDs for individual cells are displayed in the table below:

Summary of computational transaction
Raw Inputview raw input (R code)
Raw Outputview raw output of R engine
Computing time1 seconds
R Server'Herman Ole Andreas Wold' @ wold.wessa.net


Estimated Parameters of Exponential Smoothing
ParameterValue
alpha0.82988871969933
beta0.0954967730320425
gamma1

\begin{tabular}{lllllllll}
\hline
Estimated Parameters of Exponential Smoothing \tabularnewline
Parameter & Value \tabularnewline
alpha & 0.82988871969933 \tabularnewline
beta & 0.0954967730320425 \tabularnewline
gamma & 1 \tabularnewline
\hline
\end{tabular}
%Source: https://freestatistics.org/blog/index.php?pk=284515&T=1

[TABLE]
[ROW][C]Estimated Parameters of Exponential Smoothing[/C][/ROW]
[ROW][C]Parameter[/C][C]Value[/C][/ROW]
[ROW][C]alpha[/C][C]0.82988871969933[/C][/ROW]
[ROW][C]beta[/C][C]0.0954967730320425[/C][/ROW]
[ROW][C]gamma[/C][C]1[/C][/ROW]
[/TABLE]
Source: https://freestatistics.org/blog/index.php?pk=284515&T=1

Globally Unique Identifier (entire table): ba.freestatistics.org/blog/index.php?pk=284515&T=1

As an alternative you can also use a QR Code:  

The GUIDs for individual cells are displayed in the table below:

Estimated Parameters of Exponential Smoothing
ParameterValue
alpha0.82988871969933
beta0.0954967730320425
gamma1


Interpolation Forecasts of Exponential Smoothing
tObservedFittedResiduals
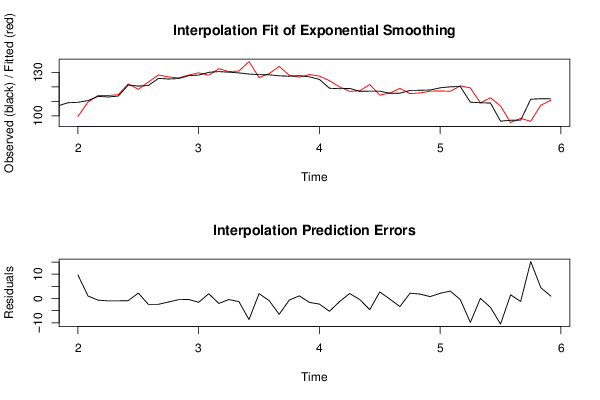
13109.399.59316239316249.7068376068376
14110.5109.4792587063351.02074129366456
15113.4114.058590481698-0.658590481697885
16113113.962902681595-0.962902681595224
17113.6114.550857950177-0.950857950176584
18121.2122.073451901517-0.873451901517001
19120.5118.2535617160362.24643828396374
20120.9123.317533909912-2.41753390991204
21125.8128.173501198393-2.3735011983935
22125.4126.8154067451-1.4154067451003
23125.7126.152750687753-0.452750687752726
24127.7128.086444107397-0.386444107397281
25128.1129.63328083267-1.53328083266973
26130128.0196767208991.98032327910107
27130.5132.491680022538-1.99168002253796
28130.1130.514258246192-0.414258246192219
29129.6130.879406222805-1.27940622280497
30128.8137.436301238738-8.63630123873816
31128.4126.3834114315752.01658856842464
32128.3129.123596640781-0.823596640781403
33127.6134.096524162259-6.49652416225868
34127.3127.939684789593-0.639684789593431
35127.7126.6059502220461.09404977795367
36126.9128.478581890261-1.57858189026135
37125.1127.390494607138-2.29049460713782
38119124.235688098138-5.23568809813816
39118.7119.961138337593-1.2611383375931
40118.9116.8338347173972.06616528260335
41116.9117.282377153526-0.382377153525709
42117121.575397101883-4.57539710188313
43117114.2697975453482.7302024546516
44115.5115.740625428249-0.24062542824916
45115.6118.900096777267-3.30009677726677
46117.5115.3133447242942.186655275706
47117.6115.7651717873041.83482821269645
48117.8117.0017163591550.798283640844886
49119.3117.1572232379392.14277676206144
50120116.9240369163513.07596308364897
51120.2120.625569826237-0.425569826236568
52109.4119.226148551705-9.82614855170513
53109108.9148247563540.0851752436457076
54108.8112.445591052509-3.64559105250888
5596.3106.791090526203-10.4910905262034
5696.995.37323387920851.52676612079149
579798.2079504347836-1.20795043478357
58111.496.185569075979515.2144309240205
59111.8107.3163873667154.48361263328478
60111.7110.7119579067160.988042093283624

\begin{tabular}{lllllllll}
\hline
Interpolation Forecasts of Exponential Smoothing \tabularnewline
t & Observed & Fitted & Residuals \tabularnewline
13 & 109.3 & 99.5931623931624 & 9.7068376068376 \tabularnewline
14 & 110.5 & 109.479258706335 & 1.02074129366456 \tabularnewline
15 & 113.4 & 114.058590481698 & -0.658590481697885 \tabularnewline
16 & 113 & 113.962902681595 & -0.962902681595224 \tabularnewline
17 & 113.6 & 114.550857950177 & -0.950857950176584 \tabularnewline
18 & 121.2 & 122.073451901517 & -0.873451901517001 \tabularnewline
19 & 120.5 & 118.253561716036 & 2.24643828396374 \tabularnewline
20 & 120.9 & 123.317533909912 & -2.41753390991204 \tabularnewline
21 & 125.8 & 128.173501198393 & -2.3735011983935 \tabularnewline
22 & 125.4 & 126.8154067451 & -1.4154067451003 \tabularnewline
23 & 125.7 & 126.152750687753 & -0.452750687752726 \tabularnewline
24 & 127.7 & 128.086444107397 & -0.386444107397281 \tabularnewline
25 & 128.1 & 129.63328083267 & -1.53328083266973 \tabularnewline
26 & 130 & 128.019676720899 & 1.98032327910107 \tabularnewline
27 & 130.5 & 132.491680022538 & -1.99168002253796 \tabularnewline
28 & 130.1 & 130.514258246192 & -0.414258246192219 \tabularnewline
29 & 129.6 & 130.879406222805 & -1.27940622280497 \tabularnewline
30 & 128.8 & 137.436301238738 & -8.63630123873816 \tabularnewline
31 & 128.4 & 126.383411431575 & 2.01658856842464 \tabularnewline
32 & 128.3 & 129.123596640781 & -0.823596640781403 \tabularnewline
33 & 127.6 & 134.096524162259 & -6.49652416225868 \tabularnewline
34 & 127.3 & 127.939684789593 & -0.639684789593431 \tabularnewline
35 & 127.7 & 126.605950222046 & 1.09404977795367 \tabularnewline
36 & 126.9 & 128.478581890261 & -1.57858189026135 \tabularnewline
37 & 125.1 & 127.390494607138 & -2.29049460713782 \tabularnewline
38 & 119 & 124.235688098138 & -5.23568809813816 \tabularnewline
39 & 118.7 & 119.961138337593 & -1.2611383375931 \tabularnewline
40 & 118.9 & 116.833834717397 & 2.06616528260335 \tabularnewline
41 & 116.9 & 117.282377153526 & -0.382377153525709 \tabularnewline
42 & 117 & 121.575397101883 & -4.57539710188313 \tabularnewline
43 & 117 & 114.269797545348 & 2.7302024546516 \tabularnewline
44 & 115.5 & 115.740625428249 & -0.24062542824916 \tabularnewline
45 & 115.6 & 118.900096777267 & -3.30009677726677 \tabularnewline
46 & 117.5 & 115.313344724294 & 2.186655275706 \tabularnewline
47 & 117.6 & 115.765171787304 & 1.83482821269645 \tabularnewline
48 & 117.8 & 117.001716359155 & 0.798283640844886 \tabularnewline
49 & 119.3 & 117.157223237939 & 2.14277676206144 \tabularnewline
50 & 120 & 116.924036916351 & 3.07596308364897 \tabularnewline
51 & 120.2 & 120.625569826237 & -0.425569826236568 \tabularnewline
52 & 109.4 & 119.226148551705 & -9.82614855170513 \tabularnewline
53 & 109 & 108.914824756354 & 0.0851752436457076 \tabularnewline
54 & 108.8 & 112.445591052509 & -3.64559105250888 \tabularnewline
55 & 96.3 & 106.791090526203 & -10.4910905262034 \tabularnewline
56 & 96.9 & 95.3732338792085 & 1.52676612079149 \tabularnewline
57 & 97 & 98.2079504347836 & -1.20795043478357 \tabularnewline
58 & 111.4 & 96.1855690759795 & 15.2144309240205 \tabularnewline
59 & 111.8 & 107.316387366715 & 4.48361263328478 \tabularnewline
60 & 111.7 & 110.711957906716 & 0.988042093283624 \tabularnewline
\hline
\end{tabular}
%Source: https://freestatistics.org/blog/index.php?pk=284515&T=2

[TABLE]
[ROW][C]Interpolation Forecasts of Exponential Smoothing[/C][/ROW]
[ROW][C]t[/C][C]Observed[/C][C]Fitted[/C][C]Residuals[/C][/ROW]
[ROW][C]13[/C][C]109.3[/C][C]99.5931623931624[/C][C]9.7068376068376[/C][/ROW]
[ROW][C]14[/C][C]110.5[/C][C]109.479258706335[/C][C]1.02074129366456[/C][/ROW]
[ROW][C]15[/C][C]113.4[/C][C]114.058590481698[/C][C]-0.658590481697885[/C][/ROW]
[ROW][C]16[/C][C]113[/C][C]113.962902681595[/C][C]-0.962902681595224[/C][/ROW]
[ROW][C]17[/C][C]113.6[/C][C]114.550857950177[/C][C]-0.950857950176584[/C][/ROW]
[ROW][C]18[/C][C]121.2[/C][C]122.073451901517[/C][C]-0.873451901517001[/C][/ROW]
[ROW][C]19[/C][C]120.5[/C][C]118.253561716036[/C][C]2.24643828396374[/C][/ROW]
[ROW][C]20[/C][C]120.9[/C][C]123.317533909912[/C][C]-2.41753390991204[/C][/ROW]
[ROW][C]21[/C][C]125.8[/C][C]128.173501198393[/C][C]-2.3735011983935[/C][/ROW]
[ROW][C]22[/C][C]125.4[/C][C]126.8154067451[/C][C]-1.4154067451003[/C][/ROW]
[ROW][C]23[/C][C]125.7[/C][C]126.152750687753[/C][C]-0.452750687752726[/C][/ROW]
[ROW][C]24[/C][C]127.7[/C][C]128.086444107397[/C][C]-0.386444107397281[/C][/ROW]
[ROW][C]25[/C][C]128.1[/C][C]129.63328083267[/C][C]-1.53328083266973[/C][/ROW]
[ROW][C]26[/C][C]130[/C][C]128.019676720899[/C][C]1.98032327910107[/C][/ROW]
[ROW][C]27[/C][C]130.5[/C][C]132.491680022538[/C][C]-1.99168002253796[/C][/ROW]
[ROW][C]28[/C][C]130.1[/C][C]130.514258246192[/C][C]-0.414258246192219[/C][/ROW]
[ROW][C]29[/C][C]129.6[/C][C]130.879406222805[/C][C]-1.27940622280497[/C][/ROW]
[ROW][C]30[/C][C]128.8[/C][C]137.436301238738[/C][C]-8.63630123873816[/C][/ROW]
[ROW][C]31[/C][C]128.4[/C][C]126.383411431575[/C][C]2.01658856842464[/C][/ROW]
[ROW][C]32[/C][C]128.3[/C][C]129.123596640781[/C][C]-0.823596640781403[/C][/ROW]
[ROW][C]33[/C][C]127.6[/C][C]134.096524162259[/C][C]-6.49652416225868[/C][/ROW]
[ROW][C]34[/C][C]127.3[/C][C]127.939684789593[/C][C]-0.639684789593431[/C][/ROW]
[ROW][C]35[/C][C]127.7[/C][C]126.605950222046[/C][C]1.09404977795367[/C][/ROW]
[ROW][C]36[/C][C]126.9[/C][C]128.478581890261[/C][C]-1.57858189026135[/C][/ROW]
[ROW][C]37[/C][C]125.1[/C][C]127.390494607138[/C][C]-2.29049460713782[/C][/ROW]
[ROW][C]38[/C][C]119[/C][C]124.235688098138[/C][C]-5.23568809813816[/C][/ROW]
[ROW][C]39[/C][C]118.7[/C][C]119.961138337593[/C][C]-1.2611383375931[/C][/ROW]
[ROW][C]40[/C][C]118.9[/C][C]116.833834717397[/C][C]2.06616528260335[/C][/ROW]
[ROW][C]41[/C][C]116.9[/C][C]117.282377153526[/C][C]-0.382377153525709[/C][/ROW]
[ROW][C]42[/C][C]117[/C][C]121.575397101883[/C][C]-4.57539710188313[/C][/ROW]
[ROW][C]43[/C][C]117[/C][C]114.269797545348[/C][C]2.7302024546516[/C][/ROW]
[ROW][C]44[/C][C]115.5[/C][C]115.740625428249[/C][C]-0.24062542824916[/C][/ROW]
[ROW][C]45[/C][C]115.6[/C][C]118.900096777267[/C][C]-3.30009677726677[/C][/ROW]
[ROW][C]46[/C][C]117.5[/C][C]115.313344724294[/C][C]2.186655275706[/C][/ROW]
[ROW][C]47[/C][C]117.6[/C][C]115.765171787304[/C][C]1.83482821269645[/C][/ROW]
[ROW][C]48[/C][C]117.8[/C][C]117.001716359155[/C][C]0.798283640844886[/C][/ROW]
[ROW][C]49[/C][C]119.3[/C][C]117.157223237939[/C][C]2.14277676206144[/C][/ROW]
[ROW][C]50[/C][C]120[/C][C]116.924036916351[/C][C]3.07596308364897[/C][/ROW]
[ROW][C]51[/C][C]120.2[/C][C]120.625569826237[/C][C]-0.425569826236568[/C][/ROW]
[ROW][C]52[/C][C]109.4[/C][C]119.226148551705[/C][C]-9.82614855170513[/C][/ROW]
[ROW][C]53[/C][C]109[/C][C]108.914824756354[/C][C]0.0851752436457076[/C][/ROW]
[ROW][C]54[/C][C]108.8[/C][C]112.445591052509[/C][C]-3.64559105250888[/C][/ROW]
[ROW][C]55[/C][C]96.3[/C][C]106.791090526203[/C][C]-10.4910905262034[/C][/ROW]
[ROW][C]56[/C][C]96.9[/C][C]95.3732338792085[/C][C]1.52676612079149[/C][/ROW]
[ROW][C]57[/C][C]97[/C][C]98.2079504347836[/C][C]-1.20795043478357[/C][/ROW]
[ROW][C]58[/C][C]111.4[/C][C]96.1855690759795[/C][C]15.2144309240205[/C][/ROW]
[ROW][C]59[/C][C]111.8[/C][C]107.316387366715[/C][C]4.48361263328478[/C][/ROW]
[ROW][C]60[/C][C]111.7[/C][C]110.711957906716[/C][C]0.988042093283624[/C][/ROW]
[/TABLE]
Source: https://freestatistics.org/blog/index.php?pk=284515&T=2

Globally Unique Identifier (entire table): ba.freestatistics.org/blog/index.php?pk=284515&T=2

As an alternative you can also use a QR Code:  

The GUIDs for individual cells are displayed in the table below:

Interpolation Forecasts of Exponential Smoothing
tObservedFittedResiduals
13109.399.59316239316249.7068376068376
14110.5109.4792587063351.02074129366456
15113.4114.058590481698-0.658590481697885
16113113.962902681595-0.962902681595224
17113.6114.550857950177-0.950857950176584
18121.2122.073451901517-0.873451901517001
19120.5118.2535617160362.24643828396374
20120.9123.317533909912-2.41753390991204
21125.8128.173501198393-2.3735011983935
22125.4126.8154067451-1.4154067451003
23125.7126.152750687753-0.452750687752726
24127.7128.086444107397-0.386444107397281
25128.1129.63328083267-1.53328083266973
26130128.0196767208991.98032327910107
27130.5132.491680022538-1.99168002253796
28130.1130.514258246192-0.414258246192219
29129.6130.879406222805-1.27940622280497
30128.8137.436301238738-8.63630123873816
31128.4126.3834114315752.01658856842464
32128.3129.123596640781-0.823596640781403
33127.6134.096524162259-6.49652416225868
34127.3127.939684789593-0.639684789593431
35127.7126.6059502220461.09404977795367
36126.9128.478581890261-1.57858189026135
37125.1127.390494607138-2.29049460713782
38119124.235688098138-5.23568809813816
39118.7119.961138337593-1.2611383375931
40118.9116.8338347173972.06616528260335
41116.9117.282377153526-0.382377153525709
42117121.575397101883-4.57539710188313
43117114.2697975453482.7302024546516
44115.5115.740625428249-0.24062542824916
45115.6118.900096777267-3.30009677726677
46117.5115.3133447242942.186655275706
47117.6115.7651717873041.83482821269645
48117.8117.0017163591550.798283640844886
49119.3117.1572232379392.14277676206144
50120116.9240369163513.07596308364897
51120.2120.625569826237-0.425569826236568
52109.4119.226148551705-9.82614855170513
53109108.9148247563540.0851752436457076
54108.8112.445591052509-3.64559105250888
5596.3106.791090526203-10.4910905262034
5696.995.37323387920851.52676612079149
579798.2079504347836-1.20795043478357
58111.496.185569075979515.2144309240205
59111.8107.3163873667154.48361263328478
60111.7110.7119579067160.988042093283624


Extrapolation Forecasts of Exponential Smoothing
tForecast95% Lower Bound95% Upper Bound
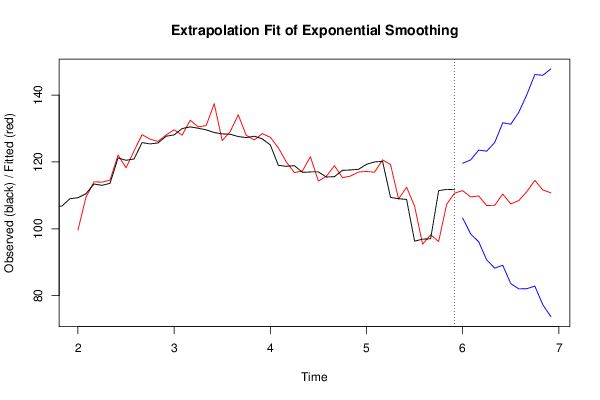
61111.405852890587103.207001212849119.604704568325
62109.53552339521898.4548237539707120.616223036466
63109.82730127618496.0995360182244123.555066534144
64106.95424053000790.6731324053953123.235348654619
65107.03462289394688.2331563947614125.836089393131
66110.40437584049389.0840116114486131.724740069537
67107.44405085008683.5880818611695131.300019839002
68108.441678896982.0222252923964134.861132501403
69111.08781856226782.0698386608731140.105798463661
70114.5009413064482.8446851726346146.157197440246
71111.61367966850877.2762638814652145.951095455551
72110.77201869103873.7084748946805147.835562487396

\begin{tabular}{lllllllll}
\hline
Extrapolation Forecasts of Exponential Smoothing \tabularnewline
t & Forecast & 95% Lower Bound & 95% Upper Bound \tabularnewline
61 & 111.405852890587 & 103.207001212849 & 119.604704568325 \tabularnewline
62 & 109.535523395218 & 98.4548237539707 & 120.616223036466 \tabularnewline
63 & 109.827301276184 & 96.0995360182244 & 123.555066534144 \tabularnewline
64 & 106.954240530007 & 90.6731324053953 & 123.235348654619 \tabularnewline
65 & 107.034622893946 & 88.2331563947614 & 125.836089393131 \tabularnewline
66 & 110.404375840493 & 89.0840116114486 & 131.724740069537 \tabularnewline
67 & 107.444050850086 & 83.5880818611695 & 131.300019839002 \tabularnewline
68 & 108.4416788969 & 82.0222252923964 & 134.861132501403 \tabularnewline
69 & 111.087818562267 & 82.0698386608731 & 140.105798463661 \tabularnewline
70 & 114.50094130644 & 82.8446851726346 & 146.157197440246 \tabularnewline
71 & 111.613679668508 & 77.2762638814652 & 145.951095455551 \tabularnewline
72 & 110.772018691038 & 73.7084748946805 & 147.835562487396 \tabularnewline
\hline
\end{tabular}
%Source: https://freestatistics.org/blog/index.php?pk=284515&T=3

[TABLE]
[ROW][C]Extrapolation Forecasts of Exponential Smoothing[/C][/ROW]
[ROW][C]t[/C][C]Forecast[/C][C]95% Lower Bound[/C][C]95% Upper Bound[/C][/ROW]
[ROW][C]61[/C][C]111.405852890587[/C][C]103.207001212849[/C][C]119.604704568325[/C][/ROW]
[ROW][C]62[/C][C]109.535523395218[/C][C]98.4548237539707[/C][C]120.616223036466[/C][/ROW]
[ROW][C]63[/C][C]109.827301276184[/C][C]96.0995360182244[/C][C]123.555066534144[/C][/ROW]
[ROW][C]64[/C][C]106.954240530007[/C][C]90.6731324053953[/C][C]123.235348654619[/C][/ROW]
[ROW][C]65[/C][C]107.034622893946[/C][C]88.2331563947614[/C][C]125.836089393131[/C][/ROW]
[ROW][C]66[/C][C]110.404375840493[/C][C]89.0840116114486[/C][C]131.724740069537[/C][/ROW]
[ROW][C]67[/C][C]107.444050850086[/C][C]83.5880818611695[/C][C]131.300019839002[/C][/ROW]
[ROW][C]68[/C][C]108.4416788969[/C][C]82.0222252923964[/C][C]134.861132501403[/C][/ROW]
[ROW][C]69[/C][C]111.087818562267[/C][C]82.0698386608731[/C][C]140.105798463661[/C][/ROW]
[ROW][C]70[/C][C]114.50094130644[/C][C]82.8446851726346[/C][C]146.157197440246[/C][/ROW]
[ROW][C]71[/C][C]111.613679668508[/C][C]77.2762638814652[/C][C]145.951095455551[/C][/ROW]
[ROW][C]72[/C][C]110.772018691038[/C][C]73.7084748946805[/C][C]147.835562487396[/C][/ROW]
[/TABLE]
Source: https://freestatistics.org/blog/index.php?pk=284515&T=3

Globally Unique Identifier (entire table): ba.freestatistics.org/blog/index.php?pk=284515&T=3

As an alternative you can also use a QR Code:  

The GUIDs for individual cells are displayed in the table below:

Extrapolation Forecasts of Exponential Smoothing
tForecast95% Lower Bound95% Upper Bound
61111.405852890587103.207001212849119.604704568325
62109.53552339521898.4548237539707120.616223036466
63109.82730127618496.0995360182244123.555066534144
64106.95424053000790.6731324053953123.235348654619
65107.03462289394688.2331563947614125.836089393131
66110.40437584049389.0840116114486131.724740069537
67107.44405085008683.5880818611695131.300019839002
68108.441678896982.0222252923964134.861132501403
69111.08781856226782.0698386608731140.105798463661
70114.5009413064482.8446851726346146.157197440246
71111.61367966850877.2762638814652145.951095455551
72110.77201869103873.7084748946805147.835562487396


Parameters (Session):
par1 = 12 ; par2 = Triple ; par3 = additive ;
Parameters (R input):
par1 = 12 ; par2 = Triple ; par3 = additive ;
R code (references can be found in the software module):
par1 <- as.numeric(par1)
if (par2 == 'Single') K <- 1
if (par2 == 'Double') K <- 2
if (par2 == 'Triple') K <- par1
nx <- length(x)
nxmK <- nx - K
x <- ts(x, frequency = par1)
if (par2 == 'Single') fit <- HoltWinters(x, gamma=F, beta=F)
if (par2 == 'Double') fit <- HoltWinters(x, gamma=F)
if (par2 == 'Triple') fit <- HoltWinters(x, seasonal=par3)
fit
myresid <- x - fit$fitted[,'xhat']
bitmap(file='test1.png')
op <- par(mfrow=c(2,1))
plot(fit,ylab='Observed (black) / Fitted (red)',main='Interpolation Fit of Exponential Smoothing')
plot(myresid,ylab='Residuals',main='Interpolation Prediction Errors')
par(op)
dev.off()
bitmap(file='test2.png')
p <- predict(fit, par1, prediction.interval=TRUE)
np <- length(p[,1])
plot(fit,p,ylab='Observed (black) / Fitted (red)',main='Extrapolation Fit of Exponential Smoothing')
dev.off()
bitmap(file='test3.png')
op <- par(mfrow = c(2,2))
acf(as.numeric(myresid),lag.max = nx/2,main='Residual ACF')
spectrum(myresid,main='Residals Periodogram')
cpgram(myresid,main='Residal Cumulative Periodogram')
qqnorm(myresid,main='Residual Normal QQ Plot')
qqline(myresid)
par(op)
dev.off()
load(file='createtable')
a<-table.start()
a<-table.row.start(a)
a<-table.element(a,'Estimated Parameters of Exponential Smoothing',2,TRUE)
a<-table.row.end(a)
a<-table.row.start(a)
a<-table.element(a,'Parameter',header=TRUE)
a<-table.element(a,'Value',header=TRUE)
a<-table.row.end(a)
a<-table.row.start(a)
a<-table.element(a,'alpha',header=TRUE)
a<-table.element(a,fit$alpha)
a<-table.row.end(a)
a<-table.row.start(a)
a<-table.element(a,'beta',header=TRUE)
a<-table.element(a,fit$beta)
a<-table.row.end(a)
a<-table.row.start(a)
a<-table.element(a,'gamma',header=TRUE)
a<-table.element(a,fit$gamma)
a<-table.row.end(a)
a<-table.end(a)
table.save(a,file='mytable.tab')
a<-table.start()
a<-table.row.start(a)
a<-table.element(a,'Interpolation Forecasts of Exponential Smoothing',4,TRUE)
a<-table.row.end(a)
a<-table.row.start(a)
a<-table.element(a,'t',header=TRUE)
a<-table.element(a,'Observed',header=TRUE)
a<-table.element(a,'Fitted',header=TRUE)
a<-table.element(a,'Residuals',header=TRUE)
a<-table.row.end(a)
for (i in 1:nxmK) {
a<-table.row.start(a)
a<-table.element(a,i+K,header=TRUE)
a<-table.element(a,x[i+K])
a<-table.element(a,fit$fitted[i,'xhat'])
a<-table.element(a,myresid[i])
a<-table.row.end(a)
}
a<-table.end(a)
table.save(a,file='mytable1.tab')
a<-table.start()
a<-table.row.start(a)
a<-table.element(a,'Extrapolation Forecasts of Exponential Smoothing',4,TRUE)
a<-table.row.end(a)
a<-table.row.start(a)
a<-table.element(a,'t',header=TRUE)
a<-table.element(a,'Forecast',header=TRUE)
a<-table.element(a,'95% Lower Bound',header=TRUE)
a<-table.element(a,'95% Upper Bound',header=TRUE)
a<-table.row.end(a)
for (i in 1:np) {
a<-table.row.start(a)
a<-table.element(a,nx+i,header=TRUE)
a<-table.element(a,p[i,'fit'])
a<-table.element(a,p[i,'lwr'])
a<-table.element(a,p[i,'upr'])
a<-table.row.end(a)
}
a<-table.end(a)
table.save(a,file='mytable2.tab')