Free Statistics

of Irreproducible Research!

Author's title

Author*Unverified author*
R Software Modulerwasp_autocorrelation.wasp
Title produced by software(Partial) Autocorrelation Function
Date of computationSun, 29 Nov 2015 17:05:01 +0000
Cite this page as followsStatistical Computations at FreeStatistics.org, Office for Research Development and Education, URL https://freestatistics.org/blog/index.php?v=date/2015/Nov/29/t1448816934t7vg1s3bxsc6dxh.htm/, Retrieved Thu, 16 May 2024 00:00:35 +0000
Statistical Computations at FreeStatistics.org, Office for Research Development and Education, URL https://freestatistics.org/blog/index.php?pk=284496, Retrieved Thu, 16 May 2024 00:00:35 +0000
QR Codes:

Original text written by user:
IsPrivate?No (this computation is public)
User-defined keywords
Estimated Impact78
Family? (F = Feedback message, R = changed R code, M = changed R Module, P = changed Parameters, D = changed Data)
-       [(Partial) Autocorrelation Function] [Autocorrelatie mo...] [2015-11-29 17:05:01] [269a3741545986d4bc4555135c508362] [Current]
Feedback Forum

Post a new message
Dataseries X:
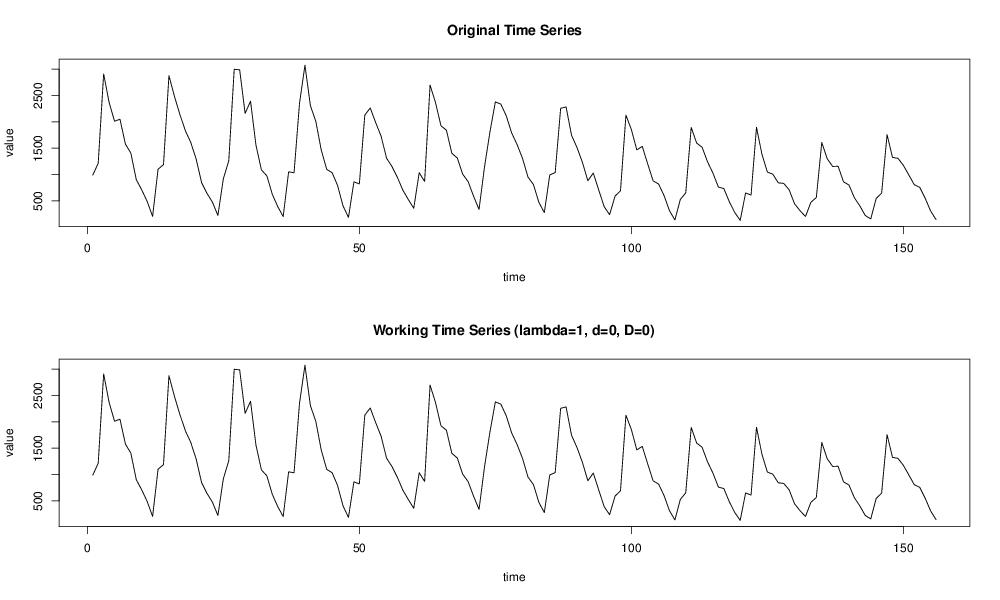
989
1215
2911
2372
2013
2050
1580
1407
903
709
490
206
1101
1189
2877
2489
2145
1837
1613
1296
849
642
475
224
920
1263
2999
2988
2163
2391
1556
1089
976
626
392
203
1052
1034
2353
3075
2309
2009
1464
1099
1035
792
406
187
862
822
2128
2264
1987
1728
1311
1152
945
704
526
361
1035
869
2698
2367
1926
1843
1404
1314
1007
865
587
339
1143
1807
2380
2337
2117
1789
1569
1305
952
810
473
278
993
1038
2257
2284
1747
1515
1233
882
1029
707
391
239
592
692
2127
1854
1468
1535
1203
880
821
604
315
139
528
654
1895
1598
1519
1242
1027
762
735
485
281
131
651
611
1898
1385
1047
1008
843
833
711
444
315
204
473
566
1611
1301
1154
1158
862
801
559
404
223
158
548
647
1757
1326
1308
1175
992
808
758
553
310
146


Summary of computational transaction
Raw Inputview raw input (R code)
Raw Outputview raw output of R engine
Computing time2 seconds
R Server'George Udny Yule' @ yule.wessa.net

\begin{tabular}{lllllllll}
\hline
Summary of computational transaction \tabularnewline
Raw Input & view raw input (R code)  \tabularnewline
Raw Output & view raw output of R engine  \tabularnewline
Computing time & 2 seconds \tabularnewline
R Server & 'George Udny Yule' @ yule.wessa.net \tabularnewline
\hline
\end{tabular}
%Source: https://freestatistics.org/blog/index.php?pk=284496&T=0

[TABLE]
[ROW][C]Summary of computational transaction[/C][/ROW]
[ROW][C]Raw Input[/C][C]view raw input (R code) [/C][/ROW]
[ROW][C]Raw Output[/C][C]view raw output of R engine [/C][/ROW]
[ROW][C]Computing time[/C][C]2 seconds[/C][/ROW]
[ROW][C]R Server[/C][C]'George Udny Yule' @ yule.wessa.net[/C][/ROW]
[/TABLE]
Source: https://freestatistics.org/blog/index.php?pk=284496&T=0

Globally Unique Identifier (entire table): ba.freestatistics.org/blog/index.php?pk=284496&T=0

As an alternative you can also use a QR Code:  

The GUIDs for individual cells are displayed in the table below:

Summary of computational transaction
Raw Inputview raw input (R code)
Raw Outputview raw output of R engine
Computing time2 seconds
R Server'George Udny Yule' @ yule.wessa.net


Autocorrelation Function
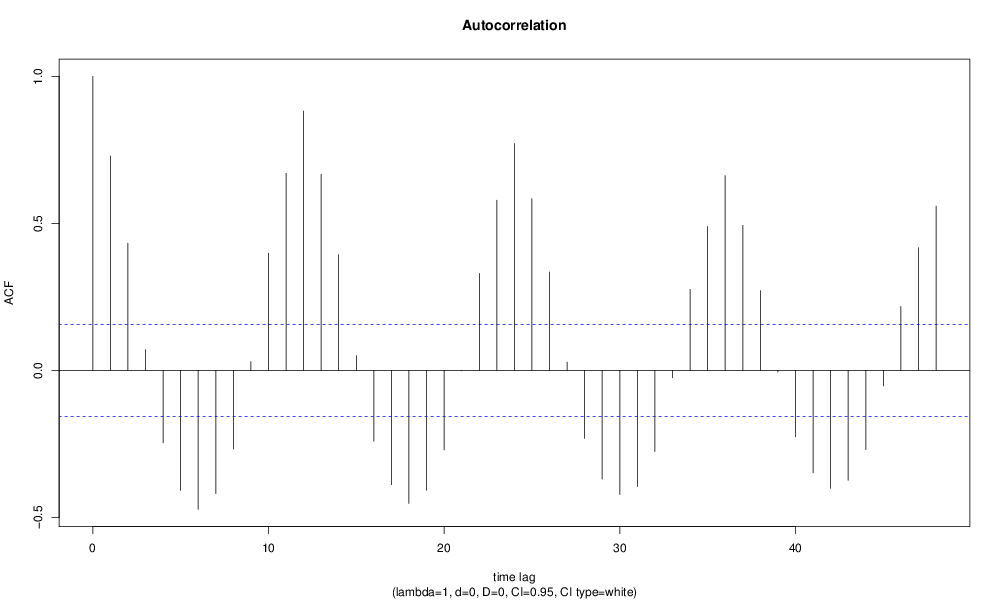
Time lag kACF(k)T-STATP-value
10.7294039.11020
20.4324375.40110
30.0705110.88070.189922
4-0.246238-3.07550.001241
5-0.407989-5.09580
6-0.472243-5.89830
7-0.418846-5.23140
8-0.267125-3.33640.00053
90.0297250.37130.355472
100.398274.97441e-06
110.6701998.37080
120.88236111.02070
130.6670278.33120
140.393114.90991e-06
150.0500890.62560.26624
16-0.240715-3.00650.00154
17-0.388539-4.85281e-06
18-0.452216-5.64820
19-0.407294-5.08711e-06
20-0.270267-3.37560.000465
21-0.001153-0.01440.494262
220.3297634.11873.1e-05
230.5783977.22420
240.7717279.63890
250.5838597.29240
260.334464.17742.4e-05
270.0281020.3510.363032
28-0.23131-2.88910.002207
29-0.369659-4.6174e-06
30-0.421932-5.26990
31-0.394771-4.93071e-06
32-0.276046-3.44780.000363
33-0.025152-0.31410.376915
340.2755633.44180.000371
350.4891616.10960
360.6623128.27230
370.4931526.15950
380.2713893.38960.000443
39-0.005564-0.06950.472345
40-0.225669-2.81860.002724
41-0.348454-4.35221.2e-05
42-0.401365-5.01311e-06
43-0.373397-4.66373e-06
44-0.269156-3.36180.000487
45-0.052635-0.65740.255944
460.2172832.71390.003699
470.4172875.21190
480.5586546.97760

\begin{tabular}{lllllllll}
\hline
Autocorrelation Function \tabularnewline
Time lag k & ACF(k) & T-STAT & P-value \tabularnewline
1 & 0.729403 & 9.1102 & 0 \tabularnewline
2 & 0.432437 & 5.4011 & 0 \tabularnewline
3 & 0.070511 & 0.8807 & 0.189922 \tabularnewline
4 & -0.246238 & -3.0755 & 0.001241 \tabularnewline
5 & -0.407989 & -5.0958 & 0 \tabularnewline
6 & -0.472243 & -5.8983 & 0 \tabularnewline
7 & -0.418846 & -5.2314 & 0 \tabularnewline
8 & -0.267125 & -3.3364 & 0.00053 \tabularnewline
9 & 0.029725 & 0.3713 & 0.355472 \tabularnewline
10 & 0.39827 & 4.9744 & 1e-06 \tabularnewline
11 & 0.670199 & 8.3708 & 0 \tabularnewline
12 & 0.882361 & 11.0207 & 0 \tabularnewline
13 & 0.667027 & 8.3312 & 0 \tabularnewline
14 & 0.39311 & 4.9099 & 1e-06 \tabularnewline
15 & 0.050089 & 0.6256 & 0.26624 \tabularnewline
16 & -0.240715 & -3.0065 & 0.00154 \tabularnewline
17 & -0.388539 & -4.8528 & 1e-06 \tabularnewline
18 & -0.452216 & -5.6482 & 0 \tabularnewline
19 & -0.407294 & -5.0871 & 1e-06 \tabularnewline
20 & -0.270267 & -3.3756 & 0.000465 \tabularnewline
21 & -0.001153 & -0.0144 & 0.494262 \tabularnewline
22 & 0.329763 & 4.1187 & 3.1e-05 \tabularnewline
23 & 0.578397 & 7.2242 & 0 \tabularnewline
24 & 0.771727 & 9.6389 & 0 \tabularnewline
25 & 0.583859 & 7.2924 & 0 \tabularnewline
26 & 0.33446 & 4.1774 & 2.4e-05 \tabularnewline
27 & 0.028102 & 0.351 & 0.363032 \tabularnewline
28 & -0.23131 & -2.8891 & 0.002207 \tabularnewline
29 & -0.369659 & -4.617 & 4e-06 \tabularnewline
30 & -0.421932 & -5.2699 & 0 \tabularnewline
31 & -0.394771 & -4.9307 & 1e-06 \tabularnewline
32 & -0.276046 & -3.4478 & 0.000363 \tabularnewline
33 & -0.025152 & -0.3141 & 0.376915 \tabularnewline
34 & 0.275563 & 3.4418 & 0.000371 \tabularnewline
35 & 0.489161 & 6.1096 & 0 \tabularnewline
36 & 0.662312 & 8.2723 & 0 \tabularnewline
37 & 0.493152 & 6.1595 & 0 \tabularnewline
38 & 0.271389 & 3.3896 & 0.000443 \tabularnewline
39 & -0.005564 & -0.0695 & 0.472345 \tabularnewline
40 & -0.225669 & -2.8186 & 0.002724 \tabularnewline
41 & -0.348454 & -4.3522 & 1.2e-05 \tabularnewline
42 & -0.401365 & -5.0131 & 1e-06 \tabularnewline
43 & -0.373397 & -4.6637 & 3e-06 \tabularnewline
44 & -0.269156 & -3.3618 & 0.000487 \tabularnewline
45 & -0.052635 & -0.6574 & 0.255944 \tabularnewline
46 & 0.217283 & 2.7139 & 0.003699 \tabularnewline
47 & 0.417287 & 5.2119 & 0 \tabularnewline
48 & 0.558654 & 6.9776 & 0 \tabularnewline
\hline
\end{tabular}
%Source: https://freestatistics.org/blog/index.php?pk=284496&T=1

[TABLE]
[ROW][C]Autocorrelation Function[/C][/ROW]
[ROW][C]Time lag k[/C][C]ACF(k)[/C][C]T-STAT[/C][C]P-value[/C][/ROW]
[ROW][C]1[/C][C]0.729403[/C][C]9.1102[/C][C]0[/C][/ROW]
[ROW][C]2[/C][C]0.432437[/C][C]5.4011[/C][C]0[/C][/ROW]
[ROW][C]3[/C][C]0.070511[/C][C]0.8807[/C][C]0.189922[/C][/ROW]
[ROW][C]4[/C][C]-0.246238[/C][C]-3.0755[/C][C]0.001241[/C][/ROW]
[ROW][C]5[/C][C]-0.407989[/C][C]-5.0958[/C][C]0[/C][/ROW]
[ROW][C]6[/C][C]-0.472243[/C][C]-5.8983[/C][C]0[/C][/ROW]
[ROW][C]7[/C][C]-0.418846[/C][C]-5.2314[/C][C]0[/C][/ROW]
[ROW][C]8[/C][C]-0.267125[/C][C]-3.3364[/C][C]0.00053[/C][/ROW]
[ROW][C]9[/C][C]0.029725[/C][C]0.3713[/C][C]0.355472[/C][/ROW]
[ROW][C]10[/C][C]0.39827[/C][C]4.9744[/C][C]1e-06[/C][/ROW]
[ROW][C]11[/C][C]0.670199[/C][C]8.3708[/C][C]0[/C][/ROW]
[ROW][C]12[/C][C]0.882361[/C][C]11.0207[/C][C]0[/C][/ROW]
[ROW][C]13[/C][C]0.667027[/C][C]8.3312[/C][C]0[/C][/ROW]
[ROW][C]14[/C][C]0.39311[/C][C]4.9099[/C][C]1e-06[/C][/ROW]
[ROW][C]15[/C][C]0.050089[/C][C]0.6256[/C][C]0.26624[/C][/ROW]
[ROW][C]16[/C][C]-0.240715[/C][C]-3.0065[/C][C]0.00154[/C][/ROW]
[ROW][C]17[/C][C]-0.388539[/C][C]-4.8528[/C][C]1e-06[/C][/ROW]
[ROW][C]18[/C][C]-0.452216[/C][C]-5.6482[/C][C]0[/C][/ROW]
[ROW][C]19[/C][C]-0.407294[/C][C]-5.0871[/C][C]1e-06[/C][/ROW]
[ROW][C]20[/C][C]-0.270267[/C][C]-3.3756[/C][C]0.000465[/C][/ROW]
[ROW][C]21[/C][C]-0.001153[/C][C]-0.0144[/C][C]0.494262[/C][/ROW]
[ROW][C]22[/C][C]0.329763[/C][C]4.1187[/C][C]3.1e-05[/C][/ROW]
[ROW][C]23[/C][C]0.578397[/C][C]7.2242[/C][C]0[/C][/ROW]
[ROW][C]24[/C][C]0.771727[/C][C]9.6389[/C][C]0[/C][/ROW]
[ROW][C]25[/C][C]0.583859[/C][C]7.2924[/C][C]0[/C][/ROW]
[ROW][C]26[/C][C]0.33446[/C][C]4.1774[/C][C]2.4e-05[/C][/ROW]
[ROW][C]27[/C][C]0.028102[/C][C]0.351[/C][C]0.363032[/C][/ROW]
[ROW][C]28[/C][C]-0.23131[/C][C]-2.8891[/C][C]0.002207[/C][/ROW]
[ROW][C]29[/C][C]-0.369659[/C][C]-4.617[/C][C]4e-06[/C][/ROW]
[ROW][C]30[/C][C]-0.421932[/C][C]-5.2699[/C][C]0[/C][/ROW]
[ROW][C]31[/C][C]-0.394771[/C][C]-4.9307[/C][C]1e-06[/C][/ROW]
[ROW][C]32[/C][C]-0.276046[/C][C]-3.4478[/C][C]0.000363[/C][/ROW]
[ROW][C]33[/C][C]-0.025152[/C][C]-0.3141[/C][C]0.376915[/C][/ROW]
[ROW][C]34[/C][C]0.275563[/C][C]3.4418[/C][C]0.000371[/C][/ROW]
[ROW][C]35[/C][C]0.489161[/C][C]6.1096[/C][C]0[/C][/ROW]
[ROW][C]36[/C][C]0.662312[/C][C]8.2723[/C][C]0[/C][/ROW]
[ROW][C]37[/C][C]0.493152[/C][C]6.1595[/C][C]0[/C][/ROW]
[ROW][C]38[/C][C]0.271389[/C][C]3.3896[/C][C]0.000443[/C][/ROW]
[ROW][C]39[/C][C]-0.005564[/C][C]-0.0695[/C][C]0.472345[/C][/ROW]
[ROW][C]40[/C][C]-0.225669[/C][C]-2.8186[/C][C]0.002724[/C][/ROW]
[ROW][C]41[/C][C]-0.348454[/C][C]-4.3522[/C][C]1.2e-05[/C][/ROW]
[ROW][C]42[/C][C]-0.401365[/C][C]-5.0131[/C][C]1e-06[/C][/ROW]
[ROW][C]43[/C][C]-0.373397[/C][C]-4.6637[/C][C]3e-06[/C][/ROW]
[ROW][C]44[/C][C]-0.269156[/C][C]-3.3618[/C][C]0.000487[/C][/ROW]
[ROW][C]45[/C][C]-0.052635[/C][C]-0.6574[/C][C]0.255944[/C][/ROW]
[ROW][C]46[/C][C]0.217283[/C][C]2.7139[/C][C]0.003699[/C][/ROW]
[ROW][C]47[/C][C]0.417287[/C][C]5.2119[/C][C]0[/C][/ROW]
[ROW][C]48[/C][C]0.558654[/C][C]6.9776[/C][C]0[/C][/ROW]
[/TABLE]
Source: https://freestatistics.org/blog/index.php?pk=284496&T=1

Globally Unique Identifier (entire table): ba.freestatistics.org/blog/index.php?pk=284496&T=1

As an alternative you can also use a QR Code:  

The GUIDs for individual cells are displayed in the table below:

Autocorrelation Function
Time lag kACF(k)T-STATP-value
10.7294039.11020
20.4324375.40110
30.0705110.88070.189922
4-0.246238-3.07550.001241
5-0.407989-5.09580
6-0.472243-5.89830
7-0.418846-5.23140
8-0.267125-3.33640.00053
90.0297250.37130.355472
100.398274.97441e-06
110.6701998.37080
120.88236111.02070
130.6670278.33120
140.393114.90991e-06
150.0500890.62560.26624
16-0.240715-3.00650.00154
17-0.388539-4.85281e-06
18-0.452216-5.64820
19-0.407294-5.08711e-06
20-0.270267-3.37560.000465
21-0.001153-0.01440.494262
220.3297634.11873.1e-05
230.5783977.22420
240.7717279.63890
250.5838597.29240
260.334464.17742.4e-05
270.0281020.3510.363032
28-0.23131-2.88910.002207
29-0.369659-4.6174e-06
30-0.421932-5.26990
31-0.394771-4.93071e-06
32-0.276046-3.44780.000363
33-0.025152-0.31410.376915
340.2755633.44180.000371
350.4891616.10960
360.6623128.27230
370.4931526.15950
380.2713893.38960.000443
39-0.005564-0.06950.472345
40-0.225669-2.81860.002724
41-0.348454-4.35221.2e-05
42-0.401365-5.01311e-06
43-0.373397-4.66373e-06
44-0.269156-3.36180.000487
45-0.052635-0.65740.255944
460.2172832.71390.003699
470.4172875.21190
480.5586546.97760


Partial Autocorrelation Function
Time lag kPACF(k)T-STATP-value
10.7294039.11020
2-0.212815-2.65810.004339
3-0.350975-4.38371.1e-05
4-0.228673-2.85610.002436
50.0045830.05720.477214
6-0.096056-1.19970.11603
7-0.067959-0.84880.198646
80.0310220.38750.34947
90.3362494.19972.2e-05
100.4404465.50120
110.2562153.20010.000832
120.5542146.92210
13-0.385187-4.8112e-06
14-0.030126-0.37630.353613
15-0.087863-1.09740.137077
160.108321.35290.089019
170.0733430.91610.180526
180.0583250.72850.233707
19-0.019097-0.23850.405895
20-0.075727-0.94580.17285
21-0.050811-0.63460.2633
22-0.170495-2.12950.017392
23-0.00303-0.03780.484929
240.1316561.64440.051055
25-0.079245-0.98980.16191
26-0.020066-0.25060.401217
27-0.010979-0.13710.445551
280.0274870.34330.365914
29-0.059032-0.73730.231022
300.0515820.64430.260176
31-0.093412-1.16670.122554
320.0258510.32290.373611
330.0754860.94280.173617
34-0.019907-0.24860.401984
35-0.106923-1.33550.091834
360.0221990.27730.390973
37-0.080677-1.00770.157591
380.0142290.17770.429586
39-0.038924-0.48620.313766
400.0694880.86790.19339
41-0.004678-0.05840.476741
42-0.031923-0.39870.345324
43-0.007222-0.09020.46412
44-0.042129-0.52620.29975
45-0.044832-0.55990.288159
46-0.022349-0.27910.390253
470.1018411.2720.102633
48-0.062894-0.78550.216663

\begin{tabular}{lllllllll}
\hline
Partial Autocorrelation Function \tabularnewline
Time lag k & PACF(k) & T-STAT & P-value \tabularnewline
1 & 0.729403 & 9.1102 & 0 \tabularnewline
2 & -0.212815 & -2.6581 & 0.004339 \tabularnewline
3 & -0.350975 & -4.3837 & 1.1e-05 \tabularnewline
4 & -0.228673 & -2.8561 & 0.002436 \tabularnewline
5 & 0.004583 & 0.0572 & 0.477214 \tabularnewline
6 & -0.096056 & -1.1997 & 0.11603 \tabularnewline
7 & -0.067959 & -0.8488 & 0.198646 \tabularnewline
8 & 0.031022 & 0.3875 & 0.34947 \tabularnewline
9 & 0.336249 & 4.1997 & 2.2e-05 \tabularnewline
10 & 0.440446 & 5.5012 & 0 \tabularnewline
11 & 0.256215 & 3.2001 & 0.000832 \tabularnewline
12 & 0.554214 & 6.9221 & 0 \tabularnewline
13 & -0.385187 & -4.811 & 2e-06 \tabularnewline
14 & -0.030126 & -0.3763 & 0.353613 \tabularnewline
15 & -0.087863 & -1.0974 & 0.137077 \tabularnewline
16 & 0.10832 & 1.3529 & 0.089019 \tabularnewline
17 & 0.073343 & 0.9161 & 0.180526 \tabularnewline
18 & 0.058325 & 0.7285 & 0.233707 \tabularnewline
19 & -0.019097 & -0.2385 & 0.405895 \tabularnewline
20 & -0.075727 & -0.9458 & 0.17285 \tabularnewline
21 & -0.050811 & -0.6346 & 0.2633 \tabularnewline
22 & -0.170495 & -2.1295 & 0.017392 \tabularnewline
23 & -0.00303 & -0.0378 & 0.484929 \tabularnewline
24 & 0.131656 & 1.6444 & 0.051055 \tabularnewline
25 & -0.079245 & -0.9898 & 0.16191 \tabularnewline
26 & -0.020066 & -0.2506 & 0.401217 \tabularnewline
27 & -0.010979 & -0.1371 & 0.445551 \tabularnewline
28 & 0.027487 & 0.3433 & 0.365914 \tabularnewline
29 & -0.059032 & -0.7373 & 0.231022 \tabularnewline
30 & 0.051582 & 0.6443 & 0.260176 \tabularnewline
31 & -0.093412 & -1.1667 & 0.122554 \tabularnewline
32 & 0.025851 & 0.3229 & 0.373611 \tabularnewline
33 & 0.075486 & 0.9428 & 0.173617 \tabularnewline
34 & -0.019907 & -0.2486 & 0.401984 \tabularnewline
35 & -0.106923 & -1.3355 & 0.091834 \tabularnewline
36 & 0.022199 & 0.2773 & 0.390973 \tabularnewline
37 & -0.080677 & -1.0077 & 0.157591 \tabularnewline
38 & 0.014229 & 0.1777 & 0.429586 \tabularnewline
39 & -0.038924 & -0.4862 & 0.313766 \tabularnewline
40 & 0.069488 & 0.8679 & 0.19339 \tabularnewline
41 & -0.004678 & -0.0584 & 0.476741 \tabularnewline
42 & -0.031923 & -0.3987 & 0.345324 \tabularnewline
43 & -0.007222 & -0.0902 & 0.46412 \tabularnewline
44 & -0.042129 & -0.5262 & 0.29975 \tabularnewline
45 & -0.044832 & -0.5599 & 0.288159 \tabularnewline
46 & -0.022349 & -0.2791 & 0.390253 \tabularnewline
47 & 0.101841 & 1.272 & 0.102633 \tabularnewline
48 & -0.062894 & -0.7855 & 0.216663 \tabularnewline
\hline
\end{tabular}
%Source: https://freestatistics.org/blog/index.php?pk=284496&T=2

[TABLE]
[ROW][C]Partial Autocorrelation Function[/C][/ROW]
[ROW][C]Time lag k[/C][C]PACF(k)[/C][C]T-STAT[/C][C]P-value[/C][/ROW]
[ROW][C]1[/C][C]0.729403[/C][C]9.1102[/C][C]0[/C][/ROW]
[ROW][C]2[/C][C]-0.212815[/C][C]-2.6581[/C][C]0.004339[/C][/ROW]
[ROW][C]3[/C][C]-0.350975[/C][C]-4.3837[/C][C]1.1e-05[/C][/ROW]
[ROW][C]4[/C][C]-0.228673[/C][C]-2.8561[/C][C]0.002436[/C][/ROW]
[ROW][C]5[/C][C]0.004583[/C][C]0.0572[/C][C]0.477214[/C][/ROW]
[ROW][C]6[/C][C]-0.096056[/C][C]-1.1997[/C][C]0.11603[/C][/ROW]
[ROW][C]7[/C][C]-0.067959[/C][C]-0.8488[/C][C]0.198646[/C][/ROW]
[ROW][C]8[/C][C]0.031022[/C][C]0.3875[/C][C]0.34947[/C][/ROW]
[ROW][C]9[/C][C]0.336249[/C][C]4.1997[/C][C]2.2e-05[/C][/ROW]
[ROW][C]10[/C][C]0.440446[/C][C]5.5012[/C][C]0[/C][/ROW]
[ROW][C]11[/C][C]0.256215[/C][C]3.2001[/C][C]0.000832[/C][/ROW]
[ROW][C]12[/C][C]0.554214[/C][C]6.9221[/C][C]0[/C][/ROW]
[ROW][C]13[/C][C]-0.385187[/C][C]-4.811[/C][C]2e-06[/C][/ROW]
[ROW][C]14[/C][C]-0.030126[/C][C]-0.3763[/C][C]0.353613[/C][/ROW]
[ROW][C]15[/C][C]-0.087863[/C][C]-1.0974[/C][C]0.137077[/C][/ROW]
[ROW][C]16[/C][C]0.10832[/C][C]1.3529[/C][C]0.089019[/C][/ROW]
[ROW][C]17[/C][C]0.073343[/C][C]0.9161[/C][C]0.180526[/C][/ROW]
[ROW][C]18[/C][C]0.058325[/C][C]0.7285[/C][C]0.233707[/C][/ROW]
[ROW][C]19[/C][C]-0.019097[/C][C]-0.2385[/C][C]0.405895[/C][/ROW]
[ROW][C]20[/C][C]-0.075727[/C][C]-0.9458[/C][C]0.17285[/C][/ROW]
[ROW][C]21[/C][C]-0.050811[/C][C]-0.6346[/C][C]0.2633[/C][/ROW]
[ROW][C]22[/C][C]-0.170495[/C][C]-2.1295[/C][C]0.017392[/C][/ROW]
[ROW][C]23[/C][C]-0.00303[/C][C]-0.0378[/C][C]0.484929[/C][/ROW]
[ROW][C]24[/C][C]0.131656[/C][C]1.6444[/C][C]0.051055[/C][/ROW]
[ROW][C]25[/C][C]-0.079245[/C][C]-0.9898[/C][C]0.16191[/C][/ROW]
[ROW][C]26[/C][C]-0.020066[/C][C]-0.2506[/C][C]0.401217[/C][/ROW]
[ROW][C]27[/C][C]-0.010979[/C][C]-0.1371[/C][C]0.445551[/C][/ROW]
[ROW][C]28[/C][C]0.027487[/C][C]0.3433[/C][C]0.365914[/C][/ROW]
[ROW][C]29[/C][C]-0.059032[/C][C]-0.7373[/C][C]0.231022[/C][/ROW]
[ROW][C]30[/C][C]0.051582[/C][C]0.6443[/C][C]0.260176[/C][/ROW]
[ROW][C]31[/C][C]-0.093412[/C][C]-1.1667[/C][C]0.122554[/C][/ROW]
[ROW][C]32[/C][C]0.025851[/C][C]0.3229[/C][C]0.373611[/C][/ROW]
[ROW][C]33[/C][C]0.075486[/C][C]0.9428[/C][C]0.173617[/C][/ROW]
[ROW][C]34[/C][C]-0.019907[/C][C]-0.2486[/C][C]0.401984[/C][/ROW]
[ROW][C]35[/C][C]-0.106923[/C][C]-1.3355[/C][C]0.091834[/C][/ROW]
[ROW][C]36[/C][C]0.022199[/C][C]0.2773[/C][C]0.390973[/C][/ROW]
[ROW][C]37[/C][C]-0.080677[/C][C]-1.0077[/C][C]0.157591[/C][/ROW]
[ROW][C]38[/C][C]0.014229[/C][C]0.1777[/C][C]0.429586[/C][/ROW]
[ROW][C]39[/C][C]-0.038924[/C][C]-0.4862[/C][C]0.313766[/C][/ROW]
[ROW][C]40[/C][C]0.069488[/C][C]0.8679[/C][C]0.19339[/C][/ROW]
[ROW][C]41[/C][C]-0.004678[/C][C]-0.0584[/C][C]0.476741[/C][/ROW]
[ROW][C]42[/C][C]-0.031923[/C][C]-0.3987[/C][C]0.345324[/C][/ROW]
[ROW][C]43[/C][C]-0.007222[/C][C]-0.0902[/C][C]0.46412[/C][/ROW]
[ROW][C]44[/C][C]-0.042129[/C][C]-0.5262[/C][C]0.29975[/C][/ROW]
[ROW][C]45[/C][C]-0.044832[/C][C]-0.5599[/C][C]0.288159[/C][/ROW]
[ROW][C]46[/C][C]-0.022349[/C][C]-0.2791[/C][C]0.390253[/C][/ROW]
[ROW][C]47[/C][C]0.101841[/C][C]1.272[/C][C]0.102633[/C][/ROW]
[ROW][C]48[/C][C]-0.062894[/C][C]-0.7855[/C][C]0.216663[/C][/ROW]
[/TABLE]
Source: https://freestatistics.org/blog/index.php?pk=284496&T=2

Globally Unique Identifier (entire table): ba.freestatistics.org/blog/index.php?pk=284496&T=2

As an alternative you can also use a QR Code:  

The GUIDs for individual cells are displayed in the table below:

Partial Autocorrelation Function
Time lag kPACF(k)T-STATP-value
10.7294039.11020
2-0.212815-2.65810.004339
3-0.350975-4.38371.1e-05
4-0.228673-2.85610.002436
50.0045830.05720.477214
6-0.096056-1.19970.11603
7-0.067959-0.84880.198646
80.0310220.38750.34947
90.3362494.19972.2e-05
100.4404465.50120
110.2562153.20010.000832
120.5542146.92210
13-0.385187-4.8112e-06
14-0.030126-0.37630.353613
15-0.087863-1.09740.137077
160.108321.35290.089019
170.0733430.91610.180526
180.0583250.72850.233707
19-0.019097-0.23850.405895
20-0.075727-0.94580.17285
21-0.050811-0.63460.2633
22-0.170495-2.12950.017392
23-0.00303-0.03780.484929
240.1316561.64440.051055
25-0.079245-0.98980.16191
26-0.020066-0.25060.401217
27-0.010979-0.13710.445551
280.0274870.34330.365914
29-0.059032-0.73730.231022
300.0515820.64430.260176
31-0.093412-1.16670.122554
320.0258510.32290.373611
330.0754860.94280.173617
34-0.019907-0.24860.401984
35-0.106923-1.33550.091834
360.0221990.27730.390973
37-0.080677-1.00770.157591
380.0142290.17770.429586
39-0.038924-0.48620.313766
400.0694880.86790.19339
41-0.004678-0.05840.476741
42-0.031923-0.39870.345324
43-0.007222-0.09020.46412
44-0.042129-0.52620.29975
45-0.044832-0.55990.288159
46-0.022349-0.27910.390253
470.1018411.2720.102633
48-0.062894-0.78550.216663


Parameters (Session):
par1 = 48 ; par2 = 1 ; par3 = 0 ; par4 = 0 ; par5 = 12 ; par6 = White Noise ; par7 = 0.95 ;
Parameters (R input):
par1 = 48 ; par2 = 1 ; par3 = 0 ; par4 = 0 ; par5 = 12 ; par6 = White Noise ; par7 = 0.95 ; par8 = ;
R code (references can be found in the software module):
if (par1 == 'Default') {
par1 = 10*log10(length(x))
} else {
par1 <- as.numeric(par1)
}
par2 <- as.numeric(par2)
par3 <- as.numeric(par3)
par4 <- as.numeric(par4)
par5 <- as.numeric(par5)
if (par6 == 'White Noise') par6 <- 'white' else par6 <- 'ma'
par7 <- as.numeric(par7)
if (par8 != '') par8 <- as.numeric(par8)
ox <- x
if (par8 == '') {
if (par2 == 0) {
x <- log(x)
} else {
x <- (x ^ par2 - 1) / par2
}
} else {
x <- log(x,base=par8)
}
if (par3 > 0) x <- diff(x,lag=1,difference=par3)
if (par4 > 0) x <- diff(x,lag=par5,difference=par4)
bitmap(file='picts.png')
op <- par(mfrow=c(2,1))
plot(ox,type='l',main='Original Time Series',xlab='time',ylab='value')
if (par8=='') {
mytitle <- paste('Working Time Series (lambda=',par2,', d=',par3,', D=',par4,')',sep='')
mysub <- paste('(lambda=',par2,', d=',par3,', D=',par4,', CI=', par7, ', CI type=',par6,')',sep='')
} else {
mytitle <- paste('Working Time Series (base=',par8,', d=',par3,', D=',par4,')',sep='')
mysub <- paste('(base=',par8,', d=',par3,', D=',par4,', CI=', par7, ', CI type=',par6,')',sep='')
}
plot(x,type='l', main=mytitle,xlab='time',ylab='value')
par(op)
dev.off()
bitmap(file='pic1.png')
racf <- acf(x, par1, main='Autocorrelation', xlab='time lag', ylab='ACF', ci.type=par6, ci=par7, sub=mysub)
dev.off()
bitmap(file='pic2.png')
rpacf <- pacf(x,par1,main='Partial Autocorrelation',xlab='lags',ylab='PACF',sub=mysub)
dev.off()
(myacf <- c(racf$acf))
(mypacf <- c(rpacf$acf))
lengthx <- length(x)
sqrtn <- sqrt(lengthx)
load(file='createtable')
a<-table.start()
a<-table.row.start(a)
a<-table.element(a,'Autocorrelation Function',4,TRUE)
a<-table.row.end(a)
a<-table.row.start(a)
a<-table.element(a,'Time lag k',header=TRUE)
a<-table.element(a,hyperlink('basics.htm','ACF(k)','click here for more information about the Autocorrelation Function'),header=TRUE)
a<-table.element(a,'T-STAT',header=TRUE)
a<-table.element(a,'P-value',header=TRUE)
a<-table.row.end(a)
for (i in 2:(par1+1)) {
a<-table.row.start(a)
a<-table.element(a,i-1,header=TRUE)
a<-table.element(a,round(myacf[i],6))
mytstat <- myacf[i]*sqrtn
a<-table.element(a,round(mytstat,4))
a<-table.element(a,round(1-pt(abs(mytstat),lengthx),6))
a<-table.row.end(a)
}
a<-table.end(a)
table.save(a,file='mytable.tab')
a<-table.start()
a<-table.row.start(a)
a<-table.element(a,'Partial Autocorrelation Function',4,TRUE)
a<-table.row.end(a)
a<-table.row.start(a)
a<-table.element(a,'Time lag k',header=TRUE)
a<-table.element(a,hyperlink('basics.htm','PACF(k)','click here for more information about the Partial Autocorrelation Function'),header=TRUE)
a<-table.element(a,'T-STAT',header=TRUE)
a<-table.element(a,'P-value',header=TRUE)
a<-table.row.end(a)
for (i in 1:par1) {
a<-table.row.start(a)
a<-table.element(a,i,header=TRUE)
a<-table.element(a,round(mypacf[i],6))
mytstat <- mypacf[i]*sqrtn
a<-table.element(a,round(mytstat,4))
a<-table.element(a,round(1-pt(abs(mytstat),lengthx),6))
a<-table.row.end(a)
}
a<-table.end(a)
table.save(a,file='mytable1.tab')