Free Statistics

of Irreproducible Research!

Author's title

Author*Unverified author*
R Software Modulerwasp_exponentialsmoothing.wasp
Title produced by softwareExponential Smoothing
Date of computationSun, 29 Nov 2015 16:01:46 +0000
Cite this page as followsStatistical Computations at FreeStatistics.org, Office for Research Development and Education, URL https://freestatistics.org/blog/index.php?v=date/2015/Nov/29/t1448812939gyeeae82imdrq8c.htm/, Retrieved Wed, 15 May 2024 02:45:49 +0000
Statistical Computations at FreeStatistics.org, Office for Research Development and Education, URL https://freestatistics.org/blog/index.php?pk=284487, Retrieved Wed, 15 May 2024 02:45:49 +0000
QR Codes:

Original text written by user:
IsPrivate?No (this computation is public)
User-defined keywords
Estimated Impact145
Family? (F = Feedback message, R = changed R code, M = changed R Module, P = changed Parameters, D = changed Data)
-       [Exponential Smoothing] [] [2015-11-29 16:01:46] [1faf68c5110a4cb4d7d9116a9189ca68] [Current]
Feedback Forum

Post a new message
Dataseries X:
1795
1756
2237
1960
1829
2524
2077
2366
2185
2098
1836
1863
2044
2136
2931
3263
3328
3570
2313
1623
1316
1507
1419
1660
1790
1733
2086
1814
2241
1943
1773
2143
2087
1805
1913
2296
2500
2210
2526
2249
2024
2091
2045
1882
1831
1964
1763
1688
2149
1823
2094
2145
1790
1996
2097
1795
1963
2041
1746
2210
2949
3110
3716
3014
1515
1498
1366
1607
1757
1623
1451
1765


Summary of computational transaction
Raw Inputview raw input (R code)
Raw Outputview raw output of R engine
Computing time2 seconds
R Server'Gwilym Jenkins' @ jenkins.wessa.net

\begin{tabular}{lllllllll}
\hline
Summary of computational transaction \tabularnewline
Raw Input & view raw input (R code)  \tabularnewline
Raw Output & view raw output of R engine  \tabularnewline
Computing time & 2 seconds \tabularnewline
R Server & 'Gwilym Jenkins' @ jenkins.wessa.net \tabularnewline
\hline
\end{tabular}
%Source: https://freestatistics.org/blog/index.php?pk=284487&T=0

[TABLE]
[ROW][C]Summary of computational transaction[/C][/ROW]
[ROW][C]Raw Input[/C][C]view raw input (R code) [/C][/ROW]
[ROW][C]Raw Output[/C][C]view raw output of R engine [/C][/ROW]
[ROW][C]Computing time[/C][C]2 seconds[/C][/ROW]
[ROW][C]R Server[/C][C]'Gwilym Jenkins' @ jenkins.wessa.net[/C][/ROW]
[/TABLE]
Source: https://freestatistics.org/blog/index.php?pk=284487&T=0

Globally Unique Identifier (entire table): ba.freestatistics.org/blog/index.php?pk=284487&T=0

As an alternative you can also use a QR Code:  

The GUIDs for individual cells are displayed in the table below:

Summary of computational transaction
Raw Inputview raw input (R code)
Raw Outputview raw output of R engine
Computing time2 seconds
R Server'Gwilym Jenkins' @ jenkins.wessa.net


Estimated Parameters of Exponential Smoothing
ParameterValue
alpha1
beta0
gammaFALSE

\begin{tabular}{lllllllll}
\hline
Estimated Parameters of Exponential Smoothing \tabularnewline
Parameter & Value \tabularnewline
alpha & 1 \tabularnewline
beta & 0 \tabularnewline
gamma & FALSE \tabularnewline
\hline
\end{tabular}
%Source: https://freestatistics.org/blog/index.php?pk=284487&T=1

[TABLE]
[ROW][C]Estimated Parameters of Exponential Smoothing[/C][/ROW]
[ROW][C]Parameter[/C][C]Value[/C][/ROW]
[ROW][C]alpha[/C][C]1[/C][/ROW]
[ROW][C]beta[/C][C]0[/C][/ROW]
[ROW][C]gamma[/C][C]FALSE[/C][/ROW]
[/TABLE]
Source: https://freestatistics.org/blog/index.php?pk=284487&T=1

Globally Unique Identifier (entire table): ba.freestatistics.org/blog/index.php?pk=284487&T=1

As an alternative you can also use a QR Code:  

The GUIDs for individual cells are displayed in the table below:

Estimated Parameters of Exponential Smoothing
ParameterValue
alpha1
beta0
gammaFALSE


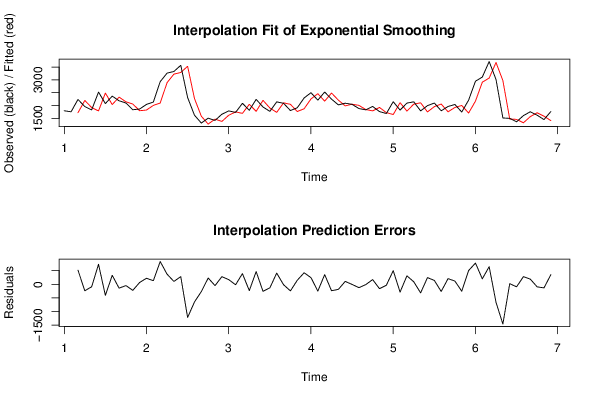
Interpolation Forecasts of Exponential Smoothing
tObservedFittedResiduals
322371717520
419602198-238
518291921-92
625241790734
720772485-408
823662038328
921852327-142
1020982146-48
1118362059-223
121863179766
1320441824220
1421362005131
1529312097834
1632632892371
1733283224104
1835703289281
1923133531-1218
2016232274-651
2113161584-268
2215071277230
2314191468-49
2416601380280
2517901621169
2617331751-18
2720861694392
2818142047-233
2922411775466
3019432202-259
3117731904-131
3221431734409
3320872104-17
3418052048-243
3519131766147
3622961874422
3725002257243
3822102461-251
3925262171355
4022492487-238
4120242210-186
4220911985106
4320452052-7
4418822006-124
4518311843-12
4619641792172
4717631925-162
4816881724-36
4921491649500
5018232110-287
5120941784310
522145205590
5317902106-316
5419961751245
5520971957140
5617952058-263
5719631756207
5820411924117
5917462002-256
6022101707503
6129492171778
6231102910200
6337163071645
6430143677-663
6515152975-1460
661498147622
6713661459-93
6816071327280
6917571568189
7016231718-95
7114511584-133
7217651412353

\begin{tabular}{lllllllll}
\hline
Interpolation Forecasts of Exponential Smoothing \tabularnewline
t & Observed & Fitted & Residuals \tabularnewline
3 & 2237 & 1717 & 520 \tabularnewline
4 & 1960 & 2198 & -238 \tabularnewline
5 & 1829 & 1921 & -92 \tabularnewline
6 & 2524 & 1790 & 734 \tabularnewline
7 & 2077 & 2485 & -408 \tabularnewline
8 & 2366 & 2038 & 328 \tabularnewline
9 & 2185 & 2327 & -142 \tabularnewline
10 & 2098 & 2146 & -48 \tabularnewline
11 & 1836 & 2059 & -223 \tabularnewline
12 & 1863 & 1797 & 66 \tabularnewline
13 & 2044 & 1824 & 220 \tabularnewline
14 & 2136 & 2005 & 131 \tabularnewline
15 & 2931 & 2097 & 834 \tabularnewline
16 & 3263 & 2892 & 371 \tabularnewline
17 & 3328 & 3224 & 104 \tabularnewline
18 & 3570 & 3289 & 281 \tabularnewline
19 & 2313 & 3531 & -1218 \tabularnewline
20 & 1623 & 2274 & -651 \tabularnewline
21 & 1316 & 1584 & -268 \tabularnewline
22 & 1507 & 1277 & 230 \tabularnewline
23 & 1419 & 1468 & -49 \tabularnewline
24 & 1660 & 1380 & 280 \tabularnewline
25 & 1790 & 1621 & 169 \tabularnewline
26 & 1733 & 1751 & -18 \tabularnewline
27 & 2086 & 1694 & 392 \tabularnewline
28 & 1814 & 2047 & -233 \tabularnewline
29 & 2241 & 1775 & 466 \tabularnewline
30 & 1943 & 2202 & -259 \tabularnewline
31 & 1773 & 1904 & -131 \tabularnewline
32 & 2143 & 1734 & 409 \tabularnewline
33 & 2087 & 2104 & -17 \tabularnewline
34 & 1805 & 2048 & -243 \tabularnewline
35 & 1913 & 1766 & 147 \tabularnewline
36 & 2296 & 1874 & 422 \tabularnewline
37 & 2500 & 2257 & 243 \tabularnewline
38 & 2210 & 2461 & -251 \tabularnewline
39 & 2526 & 2171 & 355 \tabularnewline
40 & 2249 & 2487 & -238 \tabularnewline
41 & 2024 & 2210 & -186 \tabularnewline
42 & 2091 & 1985 & 106 \tabularnewline
43 & 2045 & 2052 & -7 \tabularnewline
44 & 1882 & 2006 & -124 \tabularnewline
45 & 1831 & 1843 & -12 \tabularnewline
46 & 1964 & 1792 & 172 \tabularnewline
47 & 1763 & 1925 & -162 \tabularnewline
48 & 1688 & 1724 & -36 \tabularnewline
49 & 2149 & 1649 & 500 \tabularnewline
50 & 1823 & 2110 & -287 \tabularnewline
51 & 2094 & 1784 & 310 \tabularnewline
52 & 2145 & 2055 & 90 \tabularnewline
53 & 1790 & 2106 & -316 \tabularnewline
54 & 1996 & 1751 & 245 \tabularnewline
55 & 2097 & 1957 & 140 \tabularnewline
56 & 1795 & 2058 & -263 \tabularnewline
57 & 1963 & 1756 & 207 \tabularnewline
58 & 2041 & 1924 & 117 \tabularnewline
59 & 1746 & 2002 & -256 \tabularnewline
60 & 2210 & 1707 & 503 \tabularnewline
61 & 2949 & 2171 & 778 \tabularnewline
62 & 3110 & 2910 & 200 \tabularnewline
63 & 3716 & 3071 & 645 \tabularnewline
64 & 3014 & 3677 & -663 \tabularnewline
65 & 1515 & 2975 & -1460 \tabularnewline
66 & 1498 & 1476 & 22 \tabularnewline
67 & 1366 & 1459 & -93 \tabularnewline
68 & 1607 & 1327 & 280 \tabularnewline
69 & 1757 & 1568 & 189 \tabularnewline
70 & 1623 & 1718 & -95 \tabularnewline
71 & 1451 & 1584 & -133 \tabularnewline
72 & 1765 & 1412 & 353 \tabularnewline
\hline
\end{tabular}
%Source: https://freestatistics.org/blog/index.php?pk=284487&T=2

[TABLE]
[ROW][C]Interpolation Forecasts of Exponential Smoothing[/C][/ROW]
[ROW][C]t[/C][C]Observed[/C][C]Fitted[/C][C]Residuals[/C][/ROW]
[ROW][C]3[/C][C]2237[/C][C]1717[/C][C]520[/C][/ROW]
[ROW][C]4[/C][C]1960[/C][C]2198[/C][C]-238[/C][/ROW]
[ROW][C]5[/C][C]1829[/C][C]1921[/C][C]-92[/C][/ROW]
[ROW][C]6[/C][C]2524[/C][C]1790[/C][C]734[/C][/ROW]
[ROW][C]7[/C][C]2077[/C][C]2485[/C][C]-408[/C][/ROW]
[ROW][C]8[/C][C]2366[/C][C]2038[/C][C]328[/C][/ROW]
[ROW][C]9[/C][C]2185[/C][C]2327[/C][C]-142[/C][/ROW]
[ROW][C]10[/C][C]2098[/C][C]2146[/C][C]-48[/C][/ROW]
[ROW][C]11[/C][C]1836[/C][C]2059[/C][C]-223[/C][/ROW]
[ROW][C]12[/C][C]1863[/C][C]1797[/C][C]66[/C][/ROW]
[ROW][C]13[/C][C]2044[/C][C]1824[/C][C]220[/C][/ROW]
[ROW][C]14[/C][C]2136[/C][C]2005[/C][C]131[/C][/ROW]
[ROW][C]15[/C][C]2931[/C][C]2097[/C][C]834[/C][/ROW]
[ROW][C]16[/C][C]3263[/C][C]2892[/C][C]371[/C][/ROW]
[ROW][C]17[/C][C]3328[/C][C]3224[/C][C]104[/C][/ROW]
[ROW][C]18[/C][C]3570[/C][C]3289[/C][C]281[/C][/ROW]
[ROW][C]19[/C][C]2313[/C][C]3531[/C][C]-1218[/C][/ROW]
[ROW][C]20[/C][C]1623[/C][C]2274[/C][C]-651[/C][/ROW]
[ROW][C]21[/C][C]1316[/C][C]1584[/C][C]-268[/C][/ROW]
[ROW][C]22[/C][C]1507[/C][C]1277[/C][C]230[/C][/ROW]
[ROW][C]23[/C][C]1419[/C][C]1468[/C][C]-49[/C][/ROW]
[ROW][C]24[/C][C]1660[/C][C]1380[/C][C]280[/C][/ROW]
[ROW][C]25[/C][C]1790[/C][C]1621[/C][C]169[/C][/ROW]
[ROW][C]26[/C][C]1733[/C][C]1751[/C][C]-18[/C][/ROW]
[ROW][C]27[/C][C]2086[/C][C]1694[/C][C]392[/C][/ROW]
[ROW][C]28[/C][C]1814[/C][C]2047[/C][C]-233[/C][/ROW]
[ROW][C]29[/C][C]2241[/C][C]1775[/C][C]466[/C][/ROW]
[ROW][C]30[/C][C]1943[/C][C]2202[/C][C]-259[/C][/ROW]
[ROW][C]31[/C][C]1773[/C][C]1904[/C][C]-131[/C][/ROW]
[ROW][C]32[/C][C]2143[/C][C]1734[/C][C]409[/C][/ROW]
[ROW][C]33[/C][C]2087[/C][C]2104[/C][C]-17[/C][/ROW]
[ROW][C]34[/C][C]1805[/C][C]2048[/C][C]-243[/C][/ROW]
[ROW][C]35[/C][C]1913[/C][C]1766[/C][C]147[/C][/ROW]
[ROW][C]36[/C][C]2296[/C][C]1874[/C][C]422[/C][/ROW]
[ROW][C]37[/C][C]2500[/C][C]2257[/C][C]243[/C][/ROW]
[ROW][C]38[/C][C]2210[/C][C]2461[/C][C]-251[/C][/ROW]
[ROW][C]39[/C][C]2526[/C][C]2171[/C][C]355[/C][/ROW]
[ROW][C]40[/C][C]2249[/C][C]2487[/C][C]-238[/C][/ROW]
[ROW][C]41[/C][C]2024[/C][C]2210[/C][C]-186[/C][/ROW]
[ROW][C]42[/C][C]2091[/C][C]1985[/C][C]106[/C][/ROW]
[ROW][C]43[/C][C]2045[/C][C]2052[/C][C]-7[/C][/ROW]
[ROW][C]44[/C][C]1882[/C][C]2006[/C][C]-124[/C][/ROW]
[ROW][C]45[/C][C]1831[/C][C]1843[/C][C]-12[/C][/ROW]
[ROW][C]46[/C][C]1964[/C][C]1792[/C][C]172[/C][/ROW]
[ROW][C]47[/C][C]1763[/C][C]1925[/C][C]-162[/C][/ROW]
[ROW][C]48[/C][C]1688[/C][C]1724[/C][C]-36[/C][/ROW]
[ROW][C]49[/C][C]2149[/C][C]1649[/C][C]500[/C][/ROW]
[ROW][C]50[/C][C]1823[/C][C]2110[/C][C]-287[/C][/ROW]
[ROW][C]51[/C][C]2094[/C][C]1784[/C][C]310[/C][/ROW]
[ROW][C]52[/C][C]2145[/C][C]2055[/C][C]90[/C][/ROW]
[ROW][C]53[/C][C]1790[/C][C]2106[/C][C]-316[/C][/ROW]
[ROW][C]54[/C][C]1996[/C][C]1751[/C][C]245[/C][/ROW]
[ROW][C]55[/C][C]2097[/C][C]1957[/C][C]140[/C][/ROW]
[ROW][C]56[/C][C]1795[/C][C]2058[/C][C]-263[/C][/ROW]
[ROW][C]57[/C][C]1963[/C][C]1756[/C][C]207[/C][/ROW]
[ROW][C]58[/C][C]2041[/C][C]1924[/C][C]117[/C][/ROW]
[ROW][C]59[/C][C]1746[/C][C]2002[/C][C]-256[/C][/ROW]
[ROW][C]60[/C][C]2210[/C][C]1707[/C][C]503[/C][/ROW]
[ROW][C]61[/C][C]2949[/C][C]2171[/C][C]778[/C][/ROW]
[ROW][C]62[/C][C]3110[/C][C]2910[/C][C]200[/C][/ROW]
[ROW][C]63[/C][C]3716[/C][C]3071[/C][C]645[/C][/ROW]
[ROW][C]64[/C][C]3014[/C][C]3677[/C][C]-663[/C][/ROW]
[ROW][C]65[/C][C]1515[/C][C]2975[/C][C]-1460[/C][/ROW]
[ROW][C]66[/C][C]1498[/C][C]1476[/C][C]22[/C][/ROW]
[ROW][C]67[/C][C]1366[/C][C]1459[/C][C]-93[/C][/ROW]
[ROW][C]68[/C][C]1607[/C][C]1327[/C][C]280[/C][/ROW]
[ROW][C]69[/C][C]1757[/C][C]1568[/C][C]189[/C][/ROW]
[ROW][C]70[/C][C]1623[/C][C]1718[/C][C]-95[/C][/ROW]
[ROW][C]71[/C][C]1451[/C][C]1584[/C][C]-133[/C][/ROW]
[ROW][C]72[/C][C]1765[/C][C]1412[/C][C]353[/C][/ROW]
[/TABLE]
Source: https://freestatistics.org/blog/index.php?pk=284487&T=2

Globally Unique Identifier (entire table): ba.freestatistics.org/blog/index.php?pk=284487&T=2

As an alternative you can also use a QR Code:  

The GUIDs for individual cells are displayed in the table below:

Interpolation Forecasts of Exponential Smoothing
tObservedFittedResiduals
322371717520
419602198-238
518291921-92
625241790734
720772485-408
823662038328
921852327-142
1020982146-48
1118362059-223
121863179766
1320441824220
1421362005131
1529312097834
1632632892371
1733283224104
1835703289281
1923133531-1218
2016232274-651
2113161584-268
2215071277230
2314191468-49
2416601380280
2517901621169
2617331751-18
2720861694392
2818142047-233
2922411775466
3019432202-259
3117731904-131
3221431734409
3320872104-17
3418052048-243
3519131766147
3622961874422
3725002257243
3822102461-251
3925262171355
4022492487-238
4120242210-186
4220911985106
4320452052-7
4418822006-124
4518311843-12
4619641792172
4717631925-162
4816881724-36
4921491649500
5018232110-287
5120941784310
522145205590
5317902106-316
5419961751245
5520971957140
5617952058-263
5719631756207
5820411924117
5917462002-256
6022101707503
6129492171778
6231102910200
6337163071645
6430143677-663
6515152975-1460
661498147622
6713661459-93
6816071327280
6917571568189
7016231718-95
7114511584-133
7217651412353


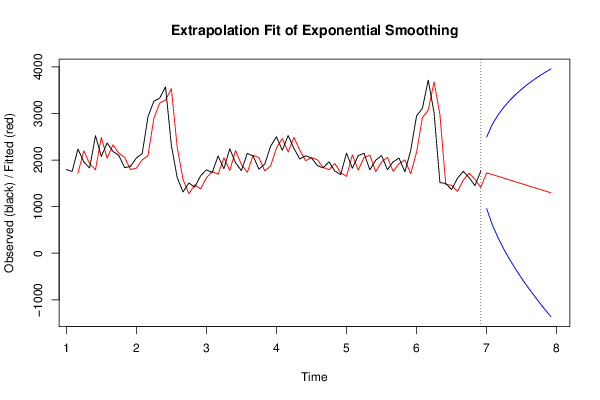
Extrapolation Forecasts of Exponential Smoothing
tForecast95% Lower Bound95% Upper Bound
731726958.7306735160592493.26932648394
741687601.9173124935412772.08268750646
751648319.0505434406612976.94945655934
76160974.46134703211783143.53865296788
771570-145.6663710685723285.66637106857
781531-348.4183451745713410.41834517457
791492-538.0038264845323522.00382648453
801453-717.1653750129193623.16537501292
811414-887.8079794518233715.80797945182
821375-1051.318650472613801.31865047261
831336-1208.744469095933880.74446909593
841297-1360.898913118683954.89891311868

\begin{tabular}{lllllllll}
\hline
Extrapolation Forecasts of Exponential Smoothing \tabularnewline
t & Forecast & 95% Lower Bound & 95% Upper Bound \tabularnewline
73 & 1726 & 958.730673516059 & 2493.26932648394 \tabularnewline
74 & 1687 & 601.917312493541 & 2772.08268750646 \tabularnewline
75 & 1648 & 319.050543440661 & 2976.94945655934 \tabularnewline
76 & 1609 & 74.4613470321178 & 3143.53865296788 \tabularnewline
77 & 1570 & -145.666371068572 & 3285.66637106857 \tabularnewline
78 & 1531 & -348.418345174571 & 3410.41834517457 \tabularnewline
79 & 1492 & -538.003826484532 & 3522.00382648453 \tabularnewline
80 & 1453 & -717.165375012919 & 3623.16537501292 \tabularnewline
81 & 1414 & -887.807979451823 & 3715.80797945182 \tabularnewline
82 & 1375 & -1051.31865047261 & 3801.31865047261 \tabularnewline
83 & 1336 & -1208.74446909593 & 3880.74446909593 \tabularnewline
84 & 1297 & -1360.89891311868 & 3954.89891311868 \tabularnewline
\hline
\end{tabular}
%Source: https://freestatistics.org/blog/index.php?pk=284487&T=3

[TABLE]
[ROW][C]Extrapolation Forecasts of Exponential Smoothing[/C][/ROW]
[ROW][C]t[/C][C]Forecast[/C][C]95% Lower Bound[/C][C]95% Upper Bound[/C][/ROW]
[ROW][C]73[/C][C]1726[/C][C]958.730673516059[/C][C]2493.26932648394[/C][/ROW]
[ROW][C]74[/C][C]1687[/C][C]601.917312493541[/C][C]2772.08268750646[/C][/ROW]
[ROW][C]75[/C][C]1648[/C][C]319.050543440661[/C][C]2976.94945655934[/C][/ROW]
[ROW][C]76[/C][C]1609[/C][C]74.4613470321178[/C][C]3143.53865296788[/C][/ROW]
[ROW][C]77[/C][C]1570[/C][C]-145.666371068572[/C][C]3285.66637106857[/C][/ROW]
[ROW][C]78[/C][C]1531[/C][C]-348.418345174571[/C][C]3410.41834517457[/C][/ROW]
[ROW][C]79[/C][C]1492[/C][C]-538.003826484532[/C][C]3522.00382648453[/C][/ROW]
[ROW][C]80[/C][C]1453[/C][C]-717.165375012919[/C][C]3623.16537501292[/C][/ROW]
[ROW][C]81[/C][C]1414[/C][C]-887.807979451823[/C][C]3715.80797945182[/C][/ROW]
[ROW][C]82[/C][C]1375[/C][C]-1051.31865047261[/C][C]3801.31865047261[/C][/ROW]
[ROW][C]83[/C][C]1336[/C][C]-1208.74446909593[/C][C]3880.74446909593[/C][/ROW]
[ROW][C]84[/C][C]1297[/C][C]-1360.89891311868[/C][C]3954.89891311868[/C][/ROW]
[/TABLE]
Source: https://freestatistics.org/blog/index.php?pk=284487&T=3

Globally Unique Identifier (entire table): ba.freestatistics.org/blog/index.php?pk=284487&T=3

As an alternative you can also use a QR Code:  

The GUIDs for individual cells are displayed in the table below:

Extrapolation Forecasts of Exponential Smoothing
tForecast95% Lower Bound95% Upper Bound
731726958.7306735160592493.26932648394
741687601.9173124935412772.08268750646
751648319.0505434406612976.94945655934
76160974.46134703211783143.53865296788
771570-145.6663710685723285.66637106857
781531-348.4183451745713410.41834517457
791492-538.0038264845323522.00382648453
801453-717.1653750129193623.16537501292
811414-887.8079794518233715.80797945182
821375-1051.318650472613801.31865047261
831336-1208.744469095933880.74446909593
841297-1360.898913118683954.89891311868


Parameters (Session):
par1 = 12 ; par2 = Double ; par3 = additive ;
Parameters (R input):
par1 = 12 ; par2 = Double ; par3 = additive ;
R code (references can be found in the software module):
par1 <- as.numeric(par1)
if (par2 == 'Single') K <- 1
if (par2 == 'Double') K <- 2
if (par2 == 'Triple') K <- par1
nx <- length(x)
nxmK <- nx - K
x <- ts(x, frequency = par1)
if (par2 == 'Single') fit <- HoltWinters(x, gamma=F, beta=F)
if (par2 == 'Double') fit <- HoltWinters(x, gamma=F)
if (par2 == 'Triple') fit <- HoltWinters(x, seasonal=par3)
fit
myresid <- x - fit$fitted[,'xhat']
bitmap(file='test1.png')
op <- par(mfrow=c(2,1))
plot(fit,ylab='Observed (black) / Fitted (red)',main='Interpolation Fit of Exponential Smoothing')
plot(myresid,ylab='Residuals',main='Interpolation Prediction Errors')
par(op)
dev.off()
bitmap(file='test2.png')
p <- predict(fit, par1, prediction.interval=TRUE)
np <- length(p[,1])
plot(fit,p,ylab='Observed (black) / Fitted (red)',main='Extrapolation Fit of Exponential Smoothing')
dev.off()
bitmap(file='test3.png')
op <- par(mfrow = c(2,2))
acf(as.numeric(myresid),lag.max = nx/2,main='Residual ACF')
spectrum(myresid,main='Residals Periodogram')
cpgram(myresid,main='Residal Cumulative Periodogram')
qqnorm(myresid,main='Residual Normal QQ Plot')
qqline(myresid)
par(op)
dev.off()
load(file='createtable')
a<-table.start()
a<-table.row.start(a)
a<-table.element(a,'Estimated Parameters of Exponential Smoothing',2,TRUE)
a<-table.row.end(a)
a<-table.row.start(a)
a<-table.element(a,'Parameter',header=TRUE)
a<-table.element(a,'Value',header=TRUE)
a<-table.row.end(a)
a<-table.row.start(a)
a<-table.element(a,'alpha',header=TRUE)
a<-table.element(a,fit$alpha)
a<-table.row.end(a)
a<-table.row.start(a)
a<-table.element(a,'beta',header=TRUE)
a<-table.element(a,fit$beta)
a<-table.row.end(a)
a<-table.row.start(a)
a<-table.element(a,'gamma',header=TRUE)
a<-table.element(a,fit$gamma)
a<-table.row.end(a)
a<-table.end(a)
table.save(a,file='mytable.tab')
a<-table.start()
a<-table.row.start(a)
a<-table.element(a,'Interpolation Forecasts of Exponential Smoothing',4,TRUE)
a<-table.row.end(a)
a<-table.row.start(a)
a<-table.element(a,'t',header=TRUE)
a<-table.element(a,'Observed',header=TRUE)
a<-table.element(a,'Fitted',header=TRUE)
a<-table.element(a,'Residuals',header=TRUE)
a<-table.row.end(a)
for (i in 1:nxmK) {
a<-table.row.start(a)
a<-table.element(a,i+K,header=TRUE)
a<-table.element(a,x[i+K])
a<-table.element(a,fit$fitted[i,'xhat'])
a<-table.element(a,myresid[i])
a<-table.row.end(a)
}
a<-table.end(a)
table.save(a,file='mytable1.tab')
a<-table.start()
a<-table.row.start(a)
a<-table.element(a,'Extrapolation Forecasts of Exponential Smoothing',4,TRUE)
a<-table.row.end(a)
a<-table.row.start(a)
a<-table.element(a,'t',header=TRUE)
a<-table.element(a,'Forecast',header=TRUE)
a<-table.element(a,'95% Lower Bound',header=TRUE)
a<-table.element(a,'95% Upper Bound',header=TRUE)
a<-table.row.end(a)
for (i in 1:np) {
a<-table.row.start(a)
a<-table.element(a,nx+i,header=TRUE)
a<-table.element(a,p[i,'fit'])
a<-table.element(a,p[i,'lwr'])
a<-table.element(a,p[i,'upr'])
a<-table.row.end(a)
}
a<-table.end(a)
table.save(a,file='mytable2.tab')