Free Statistics

of Irreproducible Research!

Author's title

Author*The author of this computation has been verified*
R Software Modulerwasp_multipleregression.wasp
Title produced by softwareMultiple Regression
Date of computationFri, 27 Nov 2015 10:13:02 +0000
Cite this page as followsStatistical Computations at FreeStatistics.org, Office for Research Development and Education, URL https://freestatistics.org/blog/index.php?v=date/2015/Nov/27/t1448619526u51i1kjjy36rbf5.htm/, Retrieved Wed, 15 May 2024 04:12:05 +0000
Statistical Computations at FreeStatistics.org, Office for Research Development and Education, URL https://freestatistics.org/blog/index.php?pk=284290, Retrieved Wed, 15 May 2024 04:12:05 +0000
QR Codes:

Original text written by user:
IsPrivate?No (this computation is public)
User-defined keywords
Estimated Impact105
Family? (F = Feedback message, R = changed R code, M = changed R Module, P = changed Parameters, D = changed Data)
-       [Multiple Regression] [Multiple regressi...] [2015-11-27 10:13:02] [11e09077693c238f0a6e6f4d2cf77105] [Current]
Feedback Forum

Post a new message
Dataseries X:
NA 501
NA 488
NA 504
NA 578
NA 545
NA 632
NA 728
NA 725
NA 585
NA 542
NA 480
NA 530
NA 518
NA 489
NA 528
NA 599
NA 572
NA 659
NA 739
NA 758
NA 602
NA 587
NA 497
NA 558
NA 555
NA 523
NA 532
NA 623
NA 598
NA 683
NA 774
NA 780
NA 609
NA 604
NA 531
NA 592
76.83 578
77.74 543
80.47 565
79.56 648
82.28 615
100.92 697
113.2 785
90.92 830
86.83 645
82.74 643
83.65 551
80.92 606
83.19 585
83.65 553
83.65 576
83.65 665
86.83 656
100.47 720
91.38 826
101.38 838
95.92 652
88.19 661
88.19 584
80.47 644
80.92 623
79.56 553
80.92 599
88.19 657
91.83 680
96.38 759
97.29 878
102.29 881
99.1 705
92.74 684
87.29 577
85.47 656
91.38 645
92.74 593
89.56 617
88.65 686
93.2 679
99.56 773
109.11 906
124.56 934
115.47 713
96.38 710
92.29 600
86.83 676
87.29 645
85.92 602
85.92 601
88.65 709
91.83 706
112.29 817
101.83 930
125.02 983
102.74 745
95.01 735
91.83 620
86.38 698
87.29 665
88.19 626
89.1 649
89.1 740
103.65 729
127.75 824
125.47 937
125.47 994
109.11 781
100.01 759
95.01 643
85.01 728
86.83 691
86.83 649
86.83 656
86.83 735
100.47 748
111.38 837
105.47 995
102.74 1040
105.01 809
96.38 793
94.1 692
86.83 763
92.74 723
93.2 655
95.47 658
96.38 761
99.56 768
120.47 885
123.2 1067
114.11 1038
120.93 812
102.74 790
101.83 692
95.47 782
100.01 758
100.01 709
98.2 715
100.01 788
103.65 794
114.56 893
134.11 1046
131.84 1075
113.65 812
107.29 822
102.29 714
94.56 802
97.29 748
98.2 731
95.47 748
100.47 827
116.38 788
117.29 937
140.93 1076
120.02 1125
111.38 840
108.65 864
105.92 717
99.1 813
101.83 811
102.74 732
102.74 745
105.47 844
108.65 833
139.57 935
110.47 1110
118.65 1124
120.02 868
109.11 860
108.2 762
101.38 877
106.38 NA
108.65 NA
107.74 NA
105.92 NA
129.56 NA
139.11 NA
125.93 NA
123.65 NA
118.65 NA
110.47 NA
110.02 NA
100.47 NA
104.1 NA
106.6 NA
105.5 NA
107.5 NA
117.9 NA
136.3 NA
156.8 NA
135.8 NA
130 NA
117.5 NA
115.8 NA
105.5 NA
111.6 NA
113.2 NA
113.1 NA
112.5 NA
120 NA
147.6 NA
149.9 NA
131.2 NA
134.6 NA
122.2 NA
117.7 NA
106.8 NA
111.5 NA
111.3 NA
109.5 NA
112.1 NA
127 NA
135.9 NA
150.4 NA
135.6 NA
134.9 NA
124.1 NA
120.8 NA
112.8 NA
117.4 NA
118.6 NA
119.2 NA
119.7 NA
128.6 NA
142.8 NA
170 NA
145.9 NA
140.1 NA
128.7 NA
123.4 NA
114.6 NA
120.2 NA
122 NA
121.3 NA
123.2 NA
141.1 NA
129.7 NA
152.4 NA
141.9 NA
137 NA
129 NA
124.6 NA
117.3 NA
122.7 NA
121 NA
122 NA
122 NA
126.3 NA
158.1 NA
164.9 NA
143.3 NA
151.4 NA
136.8 NA
133.1 NA
124.8 NA
132.6 NA
130.2 NA
129.6 NA
129.7 NA
133.7 NA
148.3 NA
155.1 NA
157.2 NA
147.2 NA
142.7 NA
135.9 NA
123.8 NA
132.3 NA
132.7 NA
130.7 NA
129.9 NA
145.5 NA
156.6 NA
161.7 NA
156 NA
146.1 NA
136.8 NA
132.5 NA
129.5 NA
129.5 NA
134.7 NA
136.6 NA
138.4 NA
149.6 NA
159.5 NA
171.4 NA
162.1 NA
163.1 NA
152.4 NA
145.5 NA
133.9 NA
136.6 NA
139.4 NA
141.2 NA
144.9 NA
181.4 NA
187 NA
211.4 NA
178.1 NA
168 NA
154.4 NA
150.4 NA
139.4 NA
144.7 NA
143 NA
148.3 NA
152.7 NA
173.3 NA
226.3 NA
218.2 NA
184.6 NA
174.9 NA
161.4 NA
161.4 NA
145.8 NA


Summary of computational transaction
Raw Inputview raw input (R code)
Raw Outputview raw output of R engine
Computing time6 seconds
R Server'Herman Ole Andreas Wold' @ wold.wessa.net

\begin{tabular}{lllllllll}
\hline
Summary of computational transaction \tabularnewline
Raw Input & view raw input (R code)  \tabularnewline
Raw Output & view raw output of R engine  \tabularnewline
Computing time & 6 seconds \tabularnewline
R Server & 'Herman Ole Andreas Wold' @ wold.wessa.net \tabularnewline
\hline
\end{tabular}
%Source: https://freestatistics.org/blog/index.php?pk=284290&T=0

[TABLE]
[ROW][C]Summary of computational transaction[/C][/ROW]
[ROW][C]Raw Input[/C][C]view raw input (R code) [/C][/ROW]
[ROW][C]Raw Output[/C][C]view raw output of R engine [/C][/ROW]
[ROW][C]Computing time[/C][C]6 seconds[/C][/ROW]
[ROW][C]R Server[/C][C]'Herman Ole Andreas Wold' @ wold.wessa.net[/C][/ROW]
[/TABLE]
Source: https://freestatistics.org/blog/index.php?pk=284290&T=0

Globally Unique Identifier (entire table): ba.freestatistics.org/blog/index.php?pk=284290&T=0

As an alternative you can also use a QR Code:  

The GUIDs for individual cells are displayed in the table below:

Summary of computational transaction
Raw Inputview raw input (R code)
Raw Outputview raw output of R engine
Computing time6 seconds
R Server'Herman Ole Andreas Wold' @ wold.wessa.net


Multiple Linear Regression - Estimated Regression Equation
water_usage[t] = + 35.2744 + 0.0843447occupied_rooms[t] + e[t]

\begin{tabular}{lllllllll}
\hline
Multiple Linear Regression - Estimated Regression Equation \tabularnewline
water_usage[t] =  +  35.2744 +  0.0843447occupied_rooms[t]  + e[t] \tabularnewline
 \tabularnewline
\hline
\end{tabular}
%Source: https://freestatistics.org/blog/index.php?pk=284290&T=1

[TABLE]
[ROW][C]Multiple Linear Regression - Estimated Regression Equation[/C][/ROW]
[ROW][C]water_usage[t] =  +  35.2744 +  0.0843447occupied_rooms[t]  + e[t][/C][/ROW]
[ROW][C][/C][/ROW]
[/TABLE]
Source: https://freestatistics.org/blog/index.php?pk=284290&T=1

Globally Unique Identifier (entire table): ba.freestatistics.org/blog/index.php?pk=284290&T=1

As an alternative you can also use a QR Code:  

The GUIDs for individual cells are displayed in the table below:

Multiple Linear Regression - Estimated Regression Equation
water_usage[t] = + 35.2744 + 0.0843447occupied_rooms[t] + e[t]


Multiple Linear Regression - Ordinary Least Squares
VariableParameterS.D.T-STATH0: parameter = 02-tail p-value1-tail p-value
(Intercept)+35.27 3.89+9.0670e+00 1.627e-15 8.135e-16
occupied_rooms+0.08435 0.005057+1.6680e+01 4.227e-34 2.113e-34

\begin{tabular}{lllllllll}
\hline
Multiple Linear Regression - Ordinary Least Squares \tabularnewline
Variable & Parameter & S.D. & T-STATH0: parameter = 0 & 2-tail p-value & 1-tail p-value \tabularnewline
(Intercept) & +35.27 &  3.89 & +9.0670e+00 &  1.627e-15 &  8.135e-16 \tabularnewline
occupied_rooms & +0.08435 &  0.005057 & +1.6680e+01 &  4.227e-34 &  2.113e-34 \tabularnewline
\hline
\end{tabular}
%Source: https://freestatistics.org/blog/index.php?pk=284290&T=2

[TABLE]
[ROW][C]Multiple Linear Regression - Ordinary Least Squares[/C][/ROW]
[ROW][C]Variable[/C][C]Parameter[/C][C]S.D.[/C][C]T-STATH0: parameter = 0[/C][C]2-tail p-value[/C][C]1-tail p-value[/C][/ROW]
[ROW][C](Intercept)[/C][C]+35.27[/C][C] 3.89[/C][C]+9.0670e+00[/C][C] 1.627e-15[/C][C] 8.135e-16[/C][/ROW]
[ROW][C]occupied_rooms[/C][C]+0.08435[/C][C] 0.005057[/C][C]+1.6680e+01[/C][C] 4.227e-34[/C][C] 2.113e-34[/C][/ROW]
[/TABLE]
Source: https://freestatistics.org/blog/index.php?pk=284290&T=2

Globally Unique Identifier (entire table): ba.freestatistics.org/blog/index.php?pk=284290&T=2

As an alternative you can also use a QR Code:  

The GUIDs for individual cells are displayed in the table below:

Multiple Linear Regression - Ordinary Least Squares
VariableParameterS.D.T-STATH0: parameter = 02-tail p-value1-tail p-value
(Intercept)+35.27 3.89+9.0670e+00 1.627e-15 8.135e-16
occupied_rooms+0.08435 0.005057+1.6680e+01 4.227e-34 2.113e-34


Multiple Linear Regression - Regression Statistics
Multiple R 0.8255
R-squared 0.6815
Adjusted R-squared 0.6791
F-TEST (value) 278.2
F-TEST (DF numerator)1
F-TEST (DF denominator)130
p-value 0
Multiple Linear Regression - Residual Statistics
Residual Standard Deviation 7.786
Sum Squared Residuals 7880

\begin{tabular}{lllllllll}
\hline
Multiple Linear Regression - Regression Statistics \tabularnewline
Multiple R &  0.8255 \tabularnewline
R-squared &  0.6815 \tabularnewline
Adjusted R-squared &  0.6791 \tabularnewline
F-TEST (value) &  278.2 \tabularnewline
F-TEST (DF numerator) & 1 \tabularnewline
F-TEST (DF denominator) & 130 \tabularnewline
p-value &  0 \tabularnewline
Multiple Linear Regression - Residual Statistics \tabularnewline
Residual Standard Deviation &  7.786 \tabularnewline
Sum Squared Residuals &  7880 \tabularnewline
\hline
\end{tabular}
%Source: https://freestatistics.org/blog/index.php?pk=284290&T=3

[TABLE]
[ROW][C]Multiple Linear Regression - Regression Statistics[/C][/ROW]
[ROW][C]Multiple R[/C][C] 0.8255[/C][/ROW]
[ROW][C]R-squared[/C][C] 0.6815[/C][/ROW]
[ROW][C]Adjusted R-squared[/C][C] 0.6791[/C][/ROW]
[ROW][C]F-TEST (value)[/C][C] 278.2[/C][/ROW]
[ROW][C]F-TEST (DF numerator)[/C][C]1[/C][/ROW]
[ROW][C]F-TEST (DF denominator)[/C][C]130[/C][/ROW]
[ROW][C]p-value[/C][C] 0[/C][/ROW]
[ROW][C]Multiple Linear Regression - Residual Statistics[/C][/ROW]
[ROW][C]Residual Standard Deviation[/C][C] 7.786[/C][/ROW]
[ROW][C]Sum Squared Residuals[/C][C] 7880[/C][/ROW]
[/TABLE]
Source: https://freestatistics.org/blog/index.php?pk=284290&T=3

Globally Unique Identifier (entire table): ba.freestatistics.org/blog/index.php?pk=284290&T=3

As an alternative you can also use a QR Code:  

The GUIDs for individual cells are displayed in the table below:

Multiple Linear Regression - Regression Statistics
Multiple R 0.8255
R-squared 0.6815
Adjusted R-squared 0.6791
F-TEST (value) 278.2
F-TEST (DF numerator)1
F-TEST (DF denominator)130
p-value 0
Multiple Linear Regression - Residual Statistics
Residual Standard Deviation 7.786
Sum Squared Residuals 7880


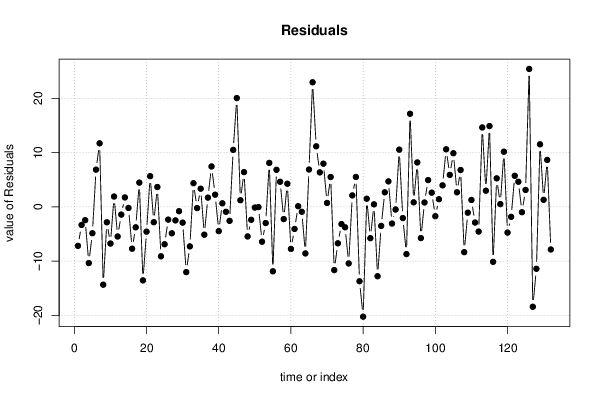
Multiple Linear Regression - Actuals, Interpolation, and Residuals
Time or IndexActualsInterpolationForecastResidualsPrediction Error
1 76.83 84.03-7.196
2 77.74 81.07-3.334
3 80.47 82.93-2.459
4 79.56 89.93-10.37
5 82.28 87.15-4.866
6 100.9 94.06 6.857
7 113.2 101.5 11.71
8 90.92 105.3-14.36
9 86.83 89.68-2.847
10 82.74 89.51-6.768
11 83.65 81.75 1.902
12 80.92 86.39-5.467
13 83.19 84.62-1.426
14 83.65 81.92 1.733
15 83.65 83.86-0.2069
16 83.65 91.36-7.714
17 86.83 90.6-3.775
18 100.5 96 4.467
19 91.38 104.9-13.56
20 101.4 106-4.575
21 95.92 90.27 5.653
22 88.19 91.03-2.836
23 88.19 84.53 3.658
24 80.47 89.59-9.122
25 80.92 87.82-6.901
26 79.56 81.92-2.357
27 80.92 85.8-4.877
28 88.19 90.69-2.499
29 91.83 92.63-0.7988
30 96.38 99.29-2.912
31 97.29 109.3-12.04
32 102.3 109.6-7.292
33 99.1 94.74 4.363
34 92.74 92.97-0.2262
35 87.29 83.94 3.349
36 85.47 90.6-5.135
37 91.38 89.68 1.703
38 92.74 85.29 7.449
39 89.56 87.32 2.245
40 88.65 93.13-4.485
41 93.2 92.54 0.6556
42 99.56 100.5-0.9128
43 109.1 111.7-2.581
44 124.6 114.1 10.51
45 115.5 95.41 20.06
46 96.38 95.16 1.221
47 92.29 85.88 6.409
48 86.83 92.29-5.461
49 87.29 89.68-2.387
50 85.92 86.05-0.1299
51 85.92 85.97-0.04554
52 88.65 95.07-6.425
53 91.83 94.82-2.992
54 112.3 104.2 8.106
55 101.8 113.7-11.88
56 125 118.2 6.835
57 102.7 98.11 4.629
58 95.01 97.27-2.258
59 91.83 87.57 4.262
60 86.38 94.15-7.767
61 87.29 91.36-4.074
62 88.19 88.07 0.1158
63 89.1 90.01-0.9141
64 89.1 97.69-8.589
65 103.7 96.76 6.888
66 127.8 104.8 22.98
67 125.5 114.3 11.16
68 125.5 119.1 6.357
69 109.1 101.1 7.962
70 100 99.29 0.718
71 95.01 89.51 5.502
72 85.01 96.68-11.67
73 86.83 93.56-6.727
74 86.83 90.01-3.184
75 86.83 90.6-3.775
76 86.83 97.27-10.44
77 100.5 98.36 2.106
78 111.4 105.9 5.509
79 105.5 119.2-13.73
80 102.7 123-20.25
81 105 103.5 1.501
82 96.38 102.2-5.78
83 94.1 93.64 0.4591
84 86.83 99.63-12.8
85 92.74 96.26-3.516
86 93.2 90.52 2.68
87 95.47 90.77 4.697
88 96.38 99.46-3.081
89 99.56 100.1-0.4911
90 120.5 109.9 10.55
91 123.2 125.3-2.07
92 114.1 122.8-8.714
93 120.9 103.8 17.17
94 102.7 101.9 0.8333
95 101.8 93.64 8.189
96 95.47 101.2-5.762
97 100 99.21 0.8023
98 100 95.07 4.935
99 98.2 95.58 2.619
100 100 101.7-1.728
101 103.7 102.2 1.406
102 114.6 110.6 3.966
103 134.1 123.5 10.61
104 131.8 125.9 5.895
105 113.7 103.8 9.888
106 107.3 104.6 2.684
107 102.3 95.5 6.793
108 94.56 102.9-8.359
109 97.29 98.36-1.074
110 98.2 96.93 1.27
111 95.47 98.36-2.894
112 100.5 105-4.557
113 116.4 101.7 14.64
114 117.3 114.3 2.985
115 140.9 126 14.9
116 120 130.2-10.14
117 111.4 106.1 5.256
118 108.7 108.1 0.5018
119 105.9 95.75 10.17
120 99.1 103.8-4.747
121 101.8 103.7-1.848
122 102.7 97.01 5.725
123 102.7 98.11 4.629
124 105.5 106.5-0.9913
125 108.7 105.5 3.116
126 139.6 114.1 25.43
127 110.5 128.9-18.43
128 118.7 130.1-11.43
129 120 108.5 11.53
130 109.1 107.8 1.299
131 108.2 99.55 8.655
132 101.4 109.2-7.865

\begin{tabular}{lllllllll}
\hline
Multiple Linear Regression - Actuals, Interpolation, and Residuals \tabularnewline
Time or Index & Actuals & InterpolationForecast & ResidualsPrediction Error \tabularnewline
1 &  76.83 &  84.03 & -7.196 \tabularnewline
2 &  77.74 &  81.07 & -3.334 \tabularnewline
3 &  80.47 &  82.93 & -2.459 \tabularnewline
4 &  79.56 &  89.93 & -10.37 \tabularnewline
5 &  82.28 &  87.15 & -4.866 \tabularnewline
6 &  100.9 &  94.06 &  6.857 \tabularnewline
7 &  113.2 &  101.5 &  11.71 \tabularnewline
8 &  90.92 &  105.3 & -14.36 \tabularnewline
9 &  86.83 &  89.68 & -2.847 \tabularnewline
10 &  82.74 &  89.51 & -6.768 \tabularnewline
11 &  83.65 &  81.75 &  1.902 \tabularnewline
12 &  80.92 &  86.39 & -5.467 \tabularnewline
13 &  83.19 &  84.62 & -1.426 \tabularnewline
14 &  83.65 &  81.92 &  1.733 \tabularnewline
15 &  83.65 &  83.86 & -0.2069 \tabularnewline
16 &  83.65 &  91.36 & -7.714 \tabularnewline
17 &  86.83 &  90.6 & -3.775 \tabularnewline
18 &  100.5 &  96 &  4.467 \tabularnewline
19 &  91.38 &  104.9 & -13.56 \tabularnewline
20 &  101.4 &  106 & -4.575 \tabularnewline
21 &  95.92 &  90.27 &  5.653 \tabularnewline
22 &  88.19 &  91.03 & -2.836 \tabularnewline
23 &  88.19 &  84.53 &  3.658 \tabularnewline
24 &  80.47 &  89.59 & -9.122 \tabularnewline
25 &  80.92 &  87.82 & -6.901 \tabularnewline
26 &  79.56 &  81.92 & -2.357 \tabularnewline
27 &  80.92 &  85.8 & -4.877 \tabularnewline
28 &  88.19 &  90.69 & -2.499 \tabularnewline
29 &  91.83 &  92.63 & -0.7988 \tabularnewline
30 &  96.38 &  99.29 & -2.912 \tabularnewline
31 &  97.29 &  109.3 & -12.04 \tabularnewline
32 &  102.3 &  109.6 & -7.292 \tabularnewline
33 &  99.1 &  94.74 &  4.363 \tabularnewline
34 &  92.74 &  92.97 & -0.2262 \tabularnewline
35 &  87.29 &  83.94 &  3.349 \tabularnewline
36 &  85.47 &  90.6 & -5.135 \tabularnewline
37 &  91.38 &  89.68 &  1.703 \tabularnewline
38 &  92.74 &  85.29 &  7.449 \tabularnewline
39 &  89.56 &  87.32 &  2.245 \tabularnewline
40 &  88.65 &  93.13 & -4.485 \tabularnewline
41 &  93.2 &  92.54 &  0.6556 \tabularnewline
42 &  99.56 &  100.5 & -0.9128 \tabularnewline
43 &  109.1 &  111.7 & -2.581 \tabularnewline
44 &  124.6 &  114.1 &  10.51 \tabularnewline
45 &  115.5 &  95.41 &  20.06 \tabularnewline
46 &  96.38 &  95.16 &  1.221 \tabularnewline
47 &  92.29 &  85.88 &  6.409 \tabularnewline
48 &  86.83 &  92.29 & -5.461 \tabularnewline
49 &  87.29 &  89.68 & -2.387 \tabularnewline
50 &  85.92 &  86.05 & -0.1299 \tabularnewline
51 &  85.92 &  85.97 & -0.04554 \tabularnewline
52 &  88.65 &  95.07 & -6.425 \tabularnewline
53 &  91.83 &  94.82 & -2.992 \tabularnewline
54 &  112.3 &  104.2 &  8.106 \tabularnewline
55 &  101.8 &  113.7 & -11.88 \tabularnewline
56 &  125 &  118.2 &  6.835 \tabularnewline
57 &  102.7 &  98.11 &  4.629 \tabularnewline
58 &  95.01 &  97.27 & -2.258 \tabularnewline
59 &  91.83 &  87.57 &  4.262 \tabularnewline
60 &  86.38 &  94.15 & -7.767 \tabularnewline
61 &  87.29 &  91.36 & -4.074 \tabularnewline
62 &  88.19 &  88.07 &  0.1158 \tabularnewline
63 &  89.1 &  90.01 & -0.9141 \tabularnewline
64 &  89.1 &  97.69 & -8.589 \tabularnewline
65 &  103.7 &  96.76 &  6.888 \tabularnewline
66 &  127.8 &  104.8 &  22.98 \tabularnewline
67 &  125.5 &  114.3 &  11.16 \tabularnewline
68 &  125.5 &  119.1 &  6.357 \tabularnewline
69 &  109.1 &  101.1 &  7.962 \tabularnewline
70 &  100 &  99.29 &  0.718 \tabularnewline
71 &  95.01 &  89.51 &  5.502 \tabularnewline
72 &  85.01 &  96.68 & -11.67 \tabularnewline
73 &  86.83 &  93.56 & -6.727 \tabularnewline
74 &  86.83 &  90.01 & -3.184 \tabularnewline
75 &  86.83 &  90.6 & -3.775 \tabularnewline
76 &  86.83 &  97.27 & -10.44 \tabularnewline
77 &  100.5 &  98.36 &  2.106 \tabularnewline
78 &  111.4 &  105.9 &  5.509 \tabularnewline
79 &  105.5 &  119.2 & -13.73 \tabularnewline
80 &  102.7 &  123 & -20.25 \tabularnewline
81 &  105 &  103.5 &  1.501 \tabularnewline
82 &  96.38 &  102.2 & -5.78 \tabularnewline
83 &  94.1 &  93.64 &  0.4591 \tabularnewline
84 &  86.83 &  99.63 & -12.8 \tabularnewline
85 &  92.74 &  96.26 & -3.516 \tabularnewline
86 &  93.2 &  90.52 &  2.68 \tabularnewline
87 &  95.47 &  90.77 &  4.697 \tabularnewline
88 &  96.38 &  99.46 & -3.081 \tabularnewline
89 &  99.56 &  100.1 & -0.4911 \tabularnewline
90 &  120.5 &  109.9 &  10.55 \tabularnewline
91 &  123.2 &  125.3 & -2.07 \tabularnewline
92 &  114.1 &  122.8 & -8.714 \tabularnewline
93 &  120.9 &  103.8 &  17.17 \tabularnewline
94 &  102.7 &  101.9 &  0.8333 \tabularnewline
95 &  101.8 &  93.64 &  8.189 \tabularnewline
96 &  95.47 &  101.2 & -5.762 \tabularnewline
97 &  100 &  99.21 &  0.8023 \tabularnewline
98 &  100 &  95.07 &  4.935 \tabularnewline
99 &  98.2 &  95.58 &  2.619 \tabularnewline
100 &  100 &  101.7 & -1.728 \tabularnewline
101 &  103.7 &  102.2 &  1.406 \tabularnewline
102 &  114.6 &  110.6 &  3.966 \tabularnewline
103 &  134.1 &  123.5 &  10.61 \tabularnewline
104 &  131.8 &  125.9 &  5.895 \tabularnewline
105 &  113.7 &  103.8 &  9.888 \tabularnewline
106 &  107.3 &  104.6 &  2.684 \tabularnewline
107 &  102.3 &  95.5 &  6.793 \tabularnewline
108 &  94.56 &  102.9 & -8.359 \tabularnewline
109 &  97.29 &  98.36 & -1.074 \tabularnewline
110 &  98.2 &  96.93 &  1.27 \tabularnewline
111 &  95.47 &  98.36 & -2.894 \tabularnewline
112 &  100.5 &  105 & -4.557 \tabularnewline
113 &  116.4 &  101.7 &  14.64 \tabularnewline
114 &  117.3 &  114.3 &  2.985 \tabularnewline
115 &  140.9 &  126 &  14.9 \tabularnewline
116 &  120 &  130.2 & -10.14 \tabularnewline
117 &  111.4 &  106.1 &  5.256 \tabularnewline
118 &  108.7 &  108.1 &  0.5018 \tabularnewline
119 &  105.9 &  95.75 &  10.17 \tabularnewline
120 &  99.1 &  103.8 & -4.747 \tabularnewline
121 &  101.8 &  103.7 & -1.848 \tabularnewline
122 &  102.7 &  97.01 &  5.725 \tabularnewline
123 &  102.7 &  98.11 &  4.629 \tabularnewline
124 &  105.5 &  106.5 & -0.9913 \tabularnewline
125 &  108.7 &  105.5 &  3.116 \tabularnewline
126 &  139.6 &  114.1 &  25.43 \tabularnewline
127 &  110.5 &  128.9 & -18.43 \tabularnewline
128 &  118.7 &  130.1 & -11.43 \tabularnewline
129 &  120 &  108.5 &  11.53 \tabularnewline
130 &  109.1 &  107.8 &  1.299 \tabularnewline
131 &  108.2 &  99.55 &  8.655 \tabularnewline
132 &  101.4 &  109.2 & -7.865 \tabularnewline
\hline
\end{tabular}
%Source: https://freestatistics.org/blog/index.php?pk=284290&T=4

[TABLE]
[ROW][C]Multiple Linear Regression - Actuals, Interpolation, and Residuals[/C][/ROW]
[ROW][C]Time or Index[/C][C]Actuals[/C][C]InterpolationForecast[/C][C]ResidualsPrediction Error[/C][/ROW]
[ROW][C]1[/C][C] 76.83[/C][C] 84.03[/C][C]-7.196[/C][/ROW]
[ROW][C]2[/C][C] 77.74[/C][C] 81.07[/C][C]-3.334[/C][/ROW]
[ROW][C]3[/C][C] 80.47[/C][C] 82.93[/C][C]-2.459[/C][/ROW]
[ROW][C]4[/C][C] 79.56[/C][C] 89.93[/C][C]-10.37[/C][/ROW]
[ROW][C]5[/C][C] 82.28[/C][C] 87.15[/C][C]-4.866[/C][/ROW]
[ROW][C]6[/C][C] 100.9[/C][C] 94.06[/C][C] 6.857[/C][/ROW]
[ROW][C]7[/C][C] 113.2[/C][C] 101.5[/C][C] 11.71[/C][/ROW]
[ROW][C]8[/C][C] 90.92[/C][C] 105.3[/C][C]-14.36[/C][/ROW]
[ROW][C]9[/C][C] 86.83[/C][C] 89.68[/C][C]-2.847[/C][/ROW]
[ROW][C]10[/C][C] 82.74[/C][C] 89.51[/C][C]-6.768[/C][/ROW]
[ROW][C]11[/C][C] 83.65[/C][C] 81.75[/C][C] 1.902[/C][/ROW]
[ROW][C]12[/C][C] 80.92[/C][C] 86.39[/C][C]-5.467[/C][/ROW]
[ROW][C]13[/C][C] 83.19[/C][C] 84.62[/C][C]-1.426[/C][/ROW]
[ROW][C]14[/C][C] 83.65[/C][C] 81.92[/C][C] 1.733[/C][/ROW]
[ROW][C]15[/C][C] 83.65[/C][C] 83.86[/C][C]-0.2069[/C][/ROW]
[ROW][C]16[/C][C] 83.65[/C][C] 91.36[/C][C]-7.714[/C][/ROW]
[ROW][C]17[/C][C] 86.83[/C][C] 90.6[/C][C]-3.775[/C][/ROW]
[ROW][C]18[/C][C] 100.5[/C][C] 96[/C][C] 4.467[/C][/ROW]
[ROW][C]19[/C][C] 91.38[/C][C] 104.9[/C][C]-13.56[/C][/ROW]
[ROW][C]20[/C][C] 101.4[/C][C] 106[/C][C]-4.575[/C][/ROW]
[ROW][C]21[/C][C] 95.92[/C][C] 90.27[/C][C] 5.653[/C][/ROW]
[ROW][C]22[/C][C] 88.19[/C][C] 91.03[/C][C]-2.836[/C][/ROW]
[ROW][C]23[/C][C] 88.19[/C][C] 84.53[/C][C] 3.658[/C][/ROW]
[ROW][C]24[/C][C] 80.47[/C][C] 89.59[/C][C]-9.122[/C][/ROW]
[ROW][C]25[/C][C] 80.92[/C][C] 87.82[/C][C]-6.901[/C][/ROW]
[ROW][C]26[/C][C] 79.56[/C][C] 81.92[/C][C]-2.357[/C][/ROW]
[ROW][C]27[/C][C] 80.92[/C][C] 85.8[/C][C]-4.877[/C][/ROW]
[ROW][C]28[/C][C] 88.19[/C][C] 90.69[/C][C]-2.499[/C][/ROW]
[ROW][C]29[/C][C] 91.83[/C][C] 92.63[/C][C]-0.7988[/C][/ROW]
[ROW][C]30[/C][C] 96.38[/C][C] 99.29[/C][C]-2.912[/C][/ROW]
[ROW][C]31[/C][C] 97.29[/C][C] 109.3[/C][C]-12.04[/C][/ROW]
[ROW][C]32[/C][C] 102.3[/C][C] 109.6[/C][C]-7.292[/C][/ROW]
[ROW][C]33[/C][C] 99.1[/C][C] 94.74[/C][C] 4.363[/C][/ROW]
[ROW][C]34[/C][C] 92.74[/C][C] 92.97[/C][C]-0.2262[/C][/ROW]
[ROW][C]35[/C][C] 87.29[/C][C] 83.94[/C][C] 3.349[/C][/ROW]
[ROW][C]36[/C][C] 85.47[/C][C] 90.6[/C][C]-5.135[/C][/ROW]
[ROW][C]37[/C][C] 91.38[/C][C] 89.68[/C][C] 1.703[/C][/ROW]
[ROW][C]38[/C][C] 92.74[/C][C] 85.29[/C][C] 7.449[/C][/ROW]
[ROW][C]39[/C][C] 89.56[/C][C] 87.32[/C][C] 2.245[/C][/ROW]
[ROW][C]40[/C][C] 88.65[/C][C] 93.13[/C][C]-4.485[/C][/ROW]
[ROW][C]41[/C][C] 93.2[/C][C] 92.54[/C][C] 0.6556[/C][/ROW]
[ROW][C]42[/C][C] 99.56[/C][C] 100.5[/C][C]-0.9128[/C][/ROW]
[ROW][C]43[/C][C] 109.1[/C][C] 111.7[/C][C]-2.581[/C][/ROW]
[ROW][C]44[/C][C] 124.6[/C][C] 114.1[/C][C] 10.51[/C][/ROW]
[ROW][C]45[/C][C] 115.5[/C][C] 95.41[/C][C] 20.06[/C][/ROW]
[ROW][C]46[/C][C] 96.38[/C][C] 95.16[/C][C] 1.221[/C][/ROW]
[ROW][C]47[/C][C] 92.29[/C][C] 85.88[/C][C] 6.409[/C][/ROW]
[ROW][C]48[/C][C] 86.83[/C][C] 92.29[/C][C]-5.461[/C][/ROW]
[ROW][C]49[/C][C] 87.29[/C][C] 89.68[/C][C]-2.387[/C][/ROW]
[ROW][C]50[/C][C] 85.92[/C][C] 86.05[/C][C]-0.1299[/C][/ROW]
[ROW][C]51[/C][C] 85.92[/C][C] 85.97[/C][C]-0.04554[/C][/ROW]
[ROW][C]52[/C][C] 88.65[/C][C] 95.07[/C][C]-6.425[/C][/ROW]
[ROW][C]53[/C][C] 91.83[/C][C] 94.82[/C][C]-2.992[/C][/ROW]
[ROW][C]54[/C][C] 112.3[/C][C] 104.2[/C][C] 8.106[/C][/ROW]
[ROW][C]55[/C][C] 101.8[/C][C] 113.7[/C][C]-11.88[/C][/ROW]
[ROW][C]56[/C][C] 125[/C][C] 118.2[/C][C] 6.835[/C][/ROW]
[ROW][C]57[/C][C] 102.7[/C][C] 98.11[/C][C] 4.629[/C][/ROW]
[ROW][C]58[/C][C] 95.01[/C][C] 97.27[/C][C]-2.258[/C][/ROW]
[ROW][C]59[/C][C] 91.83[/C][C] 87.57[/C][C] 4.262[/C][/ROW]
[ROW][C]60[/C][C] 86.38[/C][C] 94.15[/C][C]-7.767[/C][/ROW]
[ROW][C]61[/C][C] 87.29[/C][C] 91.36[/C][C]-4.074[/C][/ROW]
[ROW][C]62[/C][C] 88.19[/C][C] 88.07[/C][C] 0.1158[/C][/ROW]
[ROW][C]63[/C][C] 89.1[/C][C] 90.01[/C][C]-0.9141[/C][/ROW]
[ROW][C]64[/C][C] 89.1[/C][C] 97.69[/C][C]-8.589[/C][/ROW]
[ROW][C]65[/C][C] 103.7[/C][C] 96.76[/C][C] 6.888[/C][/ROW]
[ROW][C]66[/C][C] 127.8[/C][C] 104.8[/C][C] 22.98[/C][/ROW]
[ROW][C]67[/C][C] 125.5[/C][C] 114.3[/C][C] 11.16[/C][/ROW]
[ROW][C]68[/C][C] 125.5[/C][C] 119.1[/C][C] 6.357[/C][/ROW]
[ROW][C]69[/C][C] 109.1[/C][C] 101.1[/C][C] 7.962[/C][/ROW]
[ROW][C]70[/C][C] 100[/C][C] 99.29[/C][C] 0.718[/C][/ROW]
[ROW][C]71[/C][C] 95.01[/C][C] 89.51[/C][C] 5.502[/C][/ROW]
[ROW][C]72[/C][C] 85.01[/C][C] 96.68[/C][C]-11.67[/C][/ROW]
[ROW][C]73[/C][C] 86.83[/C][C] 93.56[/C][C]-6.727[/C][/ROW]
[ROW][C]74[/C][C] 86.83[/C][C] 90.01[/C][C]-3.184[/C][/ROW]
[ROW][C]75[/C][C] 86.83[/C][C] 90.6[/C][C]-3.775[/C][/ROW]
[ROW][C]76[/C][C] 86.83[/C][C] 97.27[/C][C]-10.44[/C][/ROW]
[ROW][C]77[/C][C] 100.5[/C][C] 98.36[/C][C] 2.106[/C][/ROW]
[ROW][C]78[/C][C] 111.4[/C][C] 105.9[/C][C] 5.509[/C][/ROW]
[ROW][C]79[/C][C] 105.5[/C][C] 119.2[/C][C]-13.73[/C][/ROW]
[ROW][C]80[/C][C] 102.7[/C][C] 123[/C][C]-20.25[/C][/ROW]
[ROW][C]81[/C][C] 105[/C][C] 103.5[/C][C] 1.501[/C][/ROW]
[ROW][C]82[/C][C] 96.38[/C][C] 102.2[/C][C]-5.78[/C][/ROW]
[ROW][C]83[/C][C] 94.1[/C][C] 93.64[/C][C] 0.4591[/C][/ROW]
[ROW][C]84[/C][C] 86.83[/C][C] 99.63[/C][C]-12.8[/C][/ROW]
[ROW][C]85[/C][C] 92.74[/C][C] 96.26[/C][C]-3.516[/C][/ROW]
[ROW][C]86[/C][C] 93.2[/C][C] 90.52[/C][C] 2.68[/C][/ROW]
[ROW][C]87[/C][C] 95.47[/C][C] 90.77[/C][C] 4.697[/C][/ROW]
[ROW][C]88[/C][C] 96.38[/C][C] 99.46[/C][C]-3.081[/C][/ROW]
[ROW][C]89[/C][C] 99.56[/C][C] 100.1[/C][C]-0.4911[/C][/ROW]
[ROW][C]90[/C][C] 120.5[/C][C] 109.9[/C][C] 10.55[/C][/ROW]
[ROW][C]91[/C][C] 123.2[/C][C] 125.3[/C][C]-2.07[/C][/ROW]
[ROW][C]92[/C][C] 114.1[/C][C] 122.8[/C][C]-8.714[/C][/ROW]
[ROW][C]93[/C][C] 120.9[/C][C] 103.8[/C][C] 17.17[/C][/ROW]
[ROW][C]94[/C][C] 102.7[/C][C] 101.9[/C][C] 0.8333[/C][/ROW]
[ROW][C]95[/C][C] 101.8[/C][C] 93.64[/C][C] 8.189[/C][/ROW]
[ROW][C]96[/C][C] 95.47[/C][C] 101.2[/C][C]-5.762[/C][/ROW]
[ROW][C]97[/C][C] 100[/C][C] 99.21[/C][C] 0.8023[/C][/ROW]
[ROW][C]98[/C][C] 100[/C][C] 95.07[/C][C] 4.935[/C][/ROW]
[ROW][C]99[/C][C] 98.2[/C][C] 95.58[/C][C] 2.619[/C][/ROW]
[ROW][C]100[/C][C] 100[/C][C] 101.7[/C][C]-1.728[/C][/ROW]
[ROW][C]101[/C][C] 103.7[/C][C] 102.2[/C][C] 1.406[/C][/ROW]
[ROW][C]102[/C][C] 114.6[/C][C] 110.6[/C][C] 3.966[/C][/ROW]
[ROW][C]103[/C][C] 134.1[/C][C] 123.5[/C][C] 10.61[/C][/ROW]
[ROW][C]104[/C][C] 131.8[/C][C] 125.9[/C][C] 5.895[/C][/ROW]
[ROW][C]105[/C][C] 113.7[/C][C] 103.8[/C][C] 9.888[/C][/ROW]
[ROW][C]106[/C][C] 107.3[/C][C] 104.6[/C][C] 2.684[/C][/ROW]
[ROW][C]107[/C][C] 102.3[/C][C] 95.5[/C][C] 6.793[/C][/ROW]
[ROW][C]108[/C][C] 94.56[/C][C] 102.9[/C][C]-8.359[/C][/ROW]
[ROW][C]109[/C][C] 97.29[/C][C] 98.36[/C][C]-1.074[/C][/ROW]
[ROW][C]110[/C][C] 98.2[/C][C] 96.93[/C][C] 1.27[/C][/ROW]
[ROW][C]111[/C][C] 95.47[/C][C] 98.36[/C][C]-2.894[/C][/ROW]
[ROW][C]112[/C][C] 100.5[/C][C] 105[/C][C]-4.557[/C][/ROW]
[ROW][C]113[/C][C] 116.4[/C][C] 101.7[/C][C] 14.64[/C][/ROW]
[ROW][C]114[/C][C] 117.3[/C][C] 114.3[/C][C] 2.985[/C][/ROW]
[ROW][C]115[/C][C] 140.9[/C][C] 126[/C][C] 14.9[/C][/ROW]
[ROW][C]116[/C][C] 120[/C][C] 130.2[/C][C]-10.14[/C][/ROW]
[ROW][C]117[/C][C] 111.4[/C][C] 106.1[/C][C] 5.256[/C][/ROW]
[ROW][C]118[/C][C] 108.7[/C][C] 108.1[/C][C] 0.5018[/C][/ROW]
[ROW][C]119[/C][C] 105.9[/C][C] 95.75[/C][C] 10.17[/C][/ROW]
[ROW][C]120[/C][C] 99.1[/C][C] 103.8[/C][C]-4.747[/C][/ROW]
[ROW][C]121[/C][C] 101.8[/C][C] 103.7[/C][C]-1.848[/C][/ROW]
[ROW][C]122[/C][C] 102.7[/C][C] 97.01[/C][C] 5.725[/C][/ROW]
[ROW][C]123[/C][C] 102.7[/C][C] 98.11[/C][C] 4.629[/C][/ROW]
[ROW][C]124[/C][C] 105.5[/C][C] 106.5[/C][C]-0.9913[/C][/ROW]
[ROW][C]125[/C][C] 108.7[/C][C] 105.5[/C][C] 3.116[/C][/ROW]
[ROW][C]126[/C][C] 139.6[/C][C] 114.1[/C][C] 25.43[/C][/ROW]
[ROW][C]127[/C][C] 110.5[/C][C] 128.9[/C][C]-18.43[/C][/ROW]
[ROW][C]128[/C][C] 118.7[/C][C] 130.1[/C][C]-11.43[/C][/ROW]
[ROW][C]129[/C][C] 120[/C][C] 108.5[/C][C] 11.53[/C][/ROW]
[ROW][C]130[/C][C] 109.1[/C][C] 107.8[/C][C] 1.299[/C][/ROW]
[ROW][C]131[/C][C] 108.2[/C][C] 99.55[/C][C] 8.655[/C][/ROW]
[ROW][C]132[/C][C] 101.4[/C][C] 109.2[/C][C]-7.865[/C][/ROW]
[/TABLE]
Source: https://freestatistics.org/blog/index.php?pk=284290&T=4

Globally Unique Identifier (entire table): ba.freestatistics.org/blog/index.php?pk=284290&T=4

As an alternative you can also use a QR Code:  

The GUIDs for individual cells are displayed in the table below:

Multiple Linear Regression - Actuals, Interpolation, and Residuals
Time or IndexActualsInterpolationForecastResidualsPrediction Error
1 76.83 84.03-7.196
2 77.74 81.07-3.334
3 80.47 82.93-2.459
4 79.56 89.93-10.37
5 82.28 87.15-4.866
6 100.9 94.06 6.857
7 113.2 101.5 11.71
8 90.92 105.3-14.36
9 86.83 89.68-2.847
10 82.74 89.51-6.768
11 83.65 81.75 1.902
12 80.92 86.39-5.467
13 83.19 84.62-1.426
14 83.65 81.92 1.733
15 83.65 83.86-0.2069
16 83.65 91.36-7.714
17 86.83 90.6-3.775
18 100.5 96 4.467
19 91.38 104.9-13.56
20 101.4 106-4.575
21 95.92 90.27 5.653
22 88.19 91.03-2.836
23 88.19 84.53 3.658
24 80.47 89.59-9.122
25 80.92 87.82-6.901
26 79.56 81.92-2.357
27 80.92 85.8-4.877
28 88.19 90.69-2.499
29 91.83 92.63-0.7988
30 96.38 99.29-2.912
31 97.29 109.3-12.04
32 102.3 109.6-7.292
33 99.1 94.74 4.363
34 92.74 92.97-0.2262
35 87.29 83.94 3.349
36 85.47 90.6-5.135
37 91.38 89.68 1.703
38 92.74 85.29 7.449
39 89.56 87.32 2.245
40 88.65 93.13-4.485
41 93.2 92.54 0.6556
42 99.56 100.5-0.9128
43 109.1 111.7-2.581
44 124.6 114.1 10.51
45 115.5 95.41 20.06
46 96.38 95.16 1.221
47 92.29 85.88 6.409
48 86.83 92.29-5.461
49 87.29 89.68-2.387
50 85.92 86.05-0.1299
51 85.92 85.97-0.04554
52 88.65 95.07-6.425
53 91.83 94.82-2.992
54 112.3 104.2 8.106
55 101.8 113.7-11.88
56 125 118.2 6.835
57 102.7 98.11 4.629
58 95.01 97.27-2.258
59 91.83 87.57 4.262
60 86.38 94.15-7.767
61 87.29 91.36-4.074
62 88.19 88.07 0.1158
63 89.1 90.01-0.9141
64 89.1 97.69-8.589
65 103.7 96.76 6.888
66 127.8 104.8 22.98
67 125.5 114.3 11.16
68 125.5 119.1 6.357
69 109.1 101.1 7.962
70 100 99.29 0.718
71 95.01 89.51 5.502
72 85.01 96.68-11.67
73 86.83 93.56-6.727
74 86.83 90.01-3.184
75 86.83 90.6-3.775
76 86.83 97.27-10.44
77 100.5 98.36 2.106
78 111.4 105.9 5.509
79 105.5 119.2-13.73
80 102.7 123-20.25
81 105 103.5 1.501
82 96.38 102.2-5.78
83 94.1 93.64 0.4591
84 86.83 99.63-12.8
85 92.74 96.26-3.516
86 93.2 90.52 2.68
87 95.47 90.77 4.697
88 96.38 99.46-3.081
89 99.56 100.1-0.4911
90 120.5 109.9 10.55
91 123.2 125.3-2.07
92 114.1 122.8-8.714
93 120.9 103.8 17.17
94 102.7 101.9 0.8333
95 101.8 93.64 8.189
96 95.47 101.2-5.762
97 100 99.21 0.8023
98 100 95.07 4.935
99 98.2 95.58 2.619
100 100 101.7-1.728
101 103.7 102.2 1.406
102 114.6 110.6 3.966
103 134.1 123.5 10.61
104 131.8 125.9 5.895
105 113.7 103.8 9.888
106 107.3 104.6 2.684
107 102.3 95.5 6.793
108 94.56 102.9-8.359
109 97.29 98.36-1.074
110 98.2 96.93 1.27
111 95.47 98.36-2.894
112 100.5 105-4.557
113 116.4 101.7 14.64
114 117.3 114.3 2.985
115 140.9 126 14.9
116 120 130.2-10.14
117 111.4 106.1 5.256
118 108.7 108.1 0.5018
119 105.9 95.75 10.17
120 99.1 103.8-4.747
121 101.8 103.7-1.848
122 102.7 97.01 5.725
123 102.7 98.11 4.629
124 105.5 106.5-0.9913
125 108.7 105.5 3.116
126 139.6 114.1 25.43
127 110.5 128.9-18.43
128 118.7 130.1-11.43
129 120 108.5 11.53
130 109.1 107.8 1.299
131 108.2 99.55 8.655
132 101.4 109.2-7.865


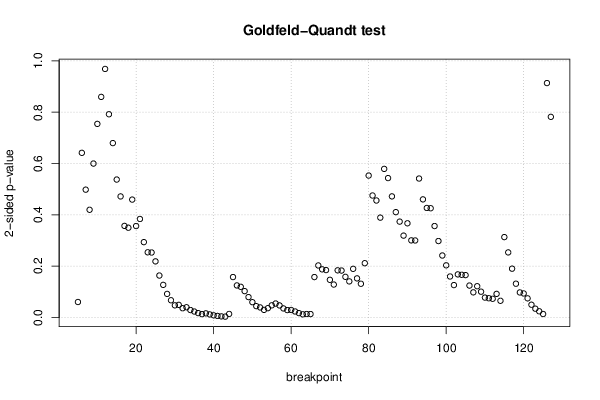
Goldfeld-Quandt test for Heteroskedasticity
p-valuesAlternative Hypothesis
breakpoint indexgreater2-sidedless
5 0.03002 0.06004 0.97
6 0.3208 0.6416 0.6792
7 0.249 0.4979 0.751
8 0.7902 0.4196 0.2098
9 0.7001 0.5997 0.2999
10 0.6228 0.7544 0.3772
11 0.5702 0.8596 0.4298
12 0.4843 0.9685 0.5157
13 0.396 0.792 0.604
14 0.3398 0.6796 0.6602
15 0.2687 0.5374 0.7313
16 0.2358 0.4717 0.7642
17 0.1783 0.3567 0.8217
18 0.1748 0.3496 0.8252
19 0.2297 0.4593 0.7703
20 0.1781 0.3562 0.8219
21 0.1918 0.3837 0.8082
22 0.1467 0.2934 0.8533
23 0.1269 0.2539 0.8731
24 0.1265 0.253 0.8735
25 0.1093 0.2185 0.8907
26 0.0816 0.1632 0.9184
27 0.06341 0.1268 0.9366
28 0.04581 0.09162 0.9542
29 0.03344 0.06688 0.9666
30 0.02351 0.04703 0.9765
31 0.02448 0.04896 0.9755
32 0.01789 0.03578 0.9821
33 0.01979 0.03958 0.9802
34 0.01441 0.02881 0.9856
35 0.01147 0.02294 0.9885
36 0.008483 0.01697 0.9915
37 0.006386 0.01277 0.9936
38 0.007905 0.01581 0.9921
39 0.005816 0.01163 0.9942
40 0.004088 0.008176 0.9959
41 0.002885 0.00577 0.9971
42 0.00204 0.004081 0.998
43 0.001473 0.002946 0.9985
44 0.006731 0.01346 0.9933
45 0.07868 0.1574 0.9213
46 0.06233 0.1247 0.9377
47 0.05968 0.1194 0.9403
48 0.05122 0.1024 0.9488
49 0.03962 0.07924 0.9604
50 0.0297 0.05941 0.9703
51 0.02198 0.04395 0.978
52 0.01946 0.03891 0.9805
53 0.01462 0.02925 0.9854
54 0.01802 0.03603 0.982
55 0.02359 0.04718 0.9764
56 0.02707 0.05413 0.9729
57 0.02335 0.04671 0.9766
58 0.01755 0.0351 0.9824
59 0.01432 0.02864 0.9857
60 0.01446 0.02892 0.9855
61 0.01157 0.02313 0.9884
62 0.008374 0.01675 0.9916
63 0.006023 0.01205 0.994
64 0.006643 0.01329 0.9934
65 0.006573 0.01315 0.9934
66 0.07862 0.1572 0.9214
67 0.1013 0.2025 0.8987
68 0.09371 0.1874 0.9063
69 0.0923 0.1846 0.9077
70 0.07328 0.1466 0.9267
71 0.06406 0.1281 0.9359
72 0.09175 0.1835 0.9083
73 0.09135 0.1827 0.9086
74 0.0791 0.1582 0.9209
75 0.07023 0.1405 0.9298
76 0.09466 0.1893 0.9053
77 0.07609 0.1522 0.9239
78 0.06558 0.1312 0.9344
79 0.1057 0.2114 0.8943
80 0.2765 0.553 0.7235
81 0.2376 0.4752 0.7624
82 0.2279 0.4557 0.7721
83 0.1945 0.3889 0.8055
84 0.2894 0.5789 0.7106
85 0.2716 0.5431 0.7284
86 0.2359 0.4718 0.7641
87 0.2052 0.4104 0.7948
88 0.1867 0.3734 0.8133
89 0.1594 0.3188 0.8406
90 0.1834 0.3669 0.8166
91 0.1502 0.3003 0.8498
92 0.15 0.2999 0.85
93 0.2707 0.5414 0.7293
94 0.2301 0.4601 0.7699
95 0.2133 0.4266 0.7867
96 0.2128 0.4256 0.7872
97 0.1781 0.3562 0.8219
98 0.1489 0.2977 0.8511
99 0.1207 0.2413 0.8793
100 0.1016 0.2031 0.8984
101 0.07975 0.1595 0.9203
102 0.06302 0.126 0.937
103 0.08385 0.1677 0.9162
104 0.08307 0.1661 0.9169
105 0.08244 0.1649 0.9176
106 0.06207 0.1241 0.9379
107 0.04887 0.09775 0.9511
108 0.06078 0.1216 0.9392
109 0.05011 0.1002 0.9499
110 0.03864 0.07728 0.9614
111 0.03735 0.0747 0.9626
112 0.03633 0.07265 0.9637
113 0.04587 0.09174 0.9541
114 0.03241 0.06482 0.9676
115 0.1565 0.313 0.8435
116 0.1267 0.2534 0.8733
117 0.09498 0.19 0.905
118 0.06565 0.1313 0.9343
119 0.04866 0.09733 0.9513
120 0.0467 0.0934 0.9533
121 0.03716 0.07431 0.9628
122 0.02472 0.04945 0.9753
123 0.01699 0.03397 0.983
124 0.01196 0.02392 0.988
125 0.006624 0.01325 0.9934
126 0.4568 0.9136 0.5432
127 0.3909 0.7818 0.6091

\begin{tabular}{lllllllll}
\hline
Goldfeld-Quandt test for Heteroskedasticity \tabularnewline
p-values & Alternative Hypothesis \tabularnewline
breakpoint index & greater & 2-sided & less \tabularnewline
5 &  0.03002 &  0.06004 &  0.97 \tabularnewline
6 &  0.3208 &  0.6416 &  0.6792 \tabularnewline
7 &  0.249 &  0.4979 &  0.751 \tabularnewline
8 &  0.7902 &  0.4196 &  0.2098 \tabularnewline
9 &  0.7001 &  0.5997 &  0.2999 \tabularnewline
10 &  0.6228 &  0.7544 &  0.3772 \tabularnewline
11 &  0.5702 &  0.8596 &  0.4298 \tabularnewline
12 &  0.4843 &  0.9685 &  0.5157 \tabularnewline
13 &  0.396 &  0.792 &  0.604 \tabularnewline
14 &  0.3398 &  0.6796 &  0.6602 \tabularnewline
15 &  0.2687 &  0.5374 &  0.7313 \tabularnewline
16 &  0.2358 &  0.4717 &  0.7642 \tabularnewline
17 &  0.1783 &  0.3567 &  0.8217 \tabularnewline
18 &  0.1748 &  0.3496 &  0.8252 \tabularnewline
19 &  0.2297 &  0.4593 &  0.7703 \tabularnewline
20 &  0.1781 &  0.3562 &  0.8219 \tabularnewline
21 &  0.1918 &  0.3837 &  0.8082 \tabularnewline
22 &  0.1467 &  0.2934 &  0.8533 \tabularnewline
23 &  0.1269 &  0.2539 &  0.8731 \tabularnewline
24 &  0.1265 &  0.253 &  0.8735 \tabularnewline
25 &  0.1093 &  0.2185 &  0.8907 \tabularnewline
26 &  0.0816 &  0.1632 &  0.9184 \tabularnewline
27 &  0.06341 &  0.1268 &  0.9366 \tabularnewline
28 &  0.04581 &  0.09162 &  0.9542 \tabularnewline
29 &  0.03344 &  0.06688 &  0.9666 \tabularnewline
30 &  0.02351 &  0.04703 &  0.9765 \tabularnewline
31 &  0.02448 &  0.04896 &  0.9755 \tabularnewline
32 &  0.01789 &  0.03578 &  0.9821 \tabularnewline
33 &  0.01979 &  0.03958 &  0.9802 \tabularnewline
34 &  0.01441 &  0.02881 &  0.9856 \tabularnewline
35 &  0.01147 &  0.02294 &  0.9885 \tabularnewline
36 &  0.008483 &  0.01697 &  0.9915 \tabularnewline
37 &  0.006386 &  0.01277 &  0.9936 \tabularnewline
38 &  0.007905 &  0.01581 &  0.9921 \tabularnewline
39 &  0.005816 &  0.01163 &  0.9942 \tabularnewline
40 &  0.004088 &  0.008176 &  0.9959 \tabularnewline
41 &  0.002885 &  0.00577 &  0.9971 \tabularnewline
42 &  0.00204 &  0.004081 &  0.998 \tabularnewline
43 &  0.001473 &  0.002946 &  0.9985 \tabularnewline
44 &  0.006731 &  0.01346 &  0.9933 \tabularnewline
45 &  0.07868 &  0.1574 &  0.9213 \tabularnewline
46 &  0.06233 &  0.1247 &  0.9377 \tabularnewline
47 &  0.05968 &  0.1194 &  0.9403 \tabularnewline
48 &  0.05122 &  0.1024 &  0.9488 \tabularnewline
49 &  0.03962 &  0.07924 &  0.9604 \tabularnewline
50 &  0.0297 &  0.05941 &  0.9703 \tabularnewline
51 &  0.02198 &  0.04395 &  0.978 \tabularnewline
52 &  0.01946 &  0.03891 &  0.9805 \tabularnewline
53 &  0.01462 &  0.02925 &  0.9854 \tabularnewline
54 &  0.01802 &  0.03603 &  0.982 \tabularnewline
55 &  0.02359 &  0.04718 &  0.9764 \tabularnewline
56 &  0.02707 &  0.05413 &  0.9729 \tabularnewline
57 &  0.02335 &  0.04671 &  0.9766 \tabularnewline
58 &  0.01755 &  0.0351 &  0.9824 \tabularnewline
59 &  0.01432 &  0.02864 &  0.9857 \tabularnewline
60 &  0.01446 &  0.02892 &  0.9855 \tabularnewline
61 &  0.01157 &  0.02313 &  0.9884 \tabularnewline
62 &  0.008374 &  0.01675 &  0.9916 \tabularnewline
63 &  0.006023 &  0.01205 &  0.994 \tabularnewline
64 &  0.006643 &  0.01329 &  0.9934 \tabularnewline
65 &  0.006573 &  0.01315 &  0.9934 \tabularnewline
66 &  0.07862 &  0.1572 &  0.9214 \tabularnewline
67 &  0.1013 &  0.2025 &  0.8987 \tabularnewline
68 &  0.09371 &  0.1874 &  0.9063 \tabularnewline
69 &  0.0923 &  0.1846 &  0.9077 \tabularnewline
70 &  0.07328 &  0.1466 &  0.9267 \tabularnewline
71 &  0.06406 &  0.1281 &  0.9359 \tabularnewline
72 &  0.09175 &  0.1835 &  0.9083 \tabularnewline
73 &  0.09135 &  0.1827 &  0.9086 \tabularnewline
74 &  0.0791 &  0.1582 &  0.9209 \tabularnewline
75 &  0.07023 &  0.1405 &  0.9298 \tabularnewline
76 &  0.09466 &  0.1893 &  0.9053 \tabularnewline
77 &  0.07609 &  0.1522 &  0.9239 \tabularnewline
78 &  0.06558 &  0.1312 &  0.9344 \tabularnewline
79 &  0.1057 &  0.2114 &  0.8943 \tabularnewline
80 &  0.2765 &  0.553 &  0.7235 \tabularnewline
81 &  0.2376 &  0.4752 &  0.7624 \tabularnewline
82 &  0.2279 &  0.4557 &  0.7721 \tabularnewline
83 &  0.1945 &  0.3889 &  0.8055 \tabularnewline
84 &  0.2894 &  0.5789 &  0.7106 \tabularnewline
85 &  0.2716 &  0.5431 &  0.7284 \tabularnewline
86 &  0.2359 &  0.4718 &  0.7641 \tabularnewline
87 &  0.2052 &  0.4104 &  0.7948 \tabularnewline
88 &  0.1867 &  0.3734 &  0.8133 \tabularnewline
89 &  0.1594 &  0.3188 &  0.8406 \tabularnewline
90 &  0.1834 &  0.3669 &  0.8166 \tabularnewline
91 &  0.1502 &  0.3003 &  0.8498 \tabularnewline
92 &  0.15 &  0.2999 &  0.85 \tabularnewline
93 &  0.2707 &  0.5414 &  0.7293 \tabularnewline
94 &  0.2301 &  0.4601 &  0.7699 \tabularnewline
95 &  0.2133 &  0.4266 &  0.7867 \tabularnewline
96 &  0.2128 &  0.4256 &  0.7872 \tabularnewline
97 &  0.1781 &  0.3562 &  0.8219 \tabularnewline
98 &  0.1489 &  0.2977 &  0.8511 \tabularnewline
99 &  0.1207 &  0.2413 &  0.8793 \tabularnewline
100 &  0.1016 &  0.2031 &  0.8984 \tabularnewline
101 &  0.07975 &  0.1595 &  0.9203 \tabularnewline
102 &  0.06302 &  0.126 &  0.937 \tabularnewline
103 &  0.08385 &  0.1677 &  0.9162 \tabularnewline
104 &  0.08307 &  0.1661 &  0.9169 \tabularnewline
105 &  0.08244 &  0.1649 &  0.9176 \tabularnewline
106 &  0.06207 &  0.1241 &  0.9379 \tabularnewline
107 &  0.04887 &  0.09775 &  0.9511 \tabularnewline
108 &  0.06078 &  0.1216 &  0.9392 \tabularnewline
109 &  0.05011 &  0.1002 &  0.9499 \tabularnewline
110 &  0.03864 &  0.07728 &  0.9614 \tabularnewline
111 &  0.03735 &  0.0747 &  0.9626 \tabularnewline
112 &  0.03633 &  0.07265 &  0.9637 \tabularnewline
113 &  0.04587 &  0.09174 &  0.9541 \tabularnewline
114 &  0.03241 &  0.06482 &  0.9676 \tabularnewline
115 &  0.1565 &  0.313 &  0.8435 \tabularnewline
116 &  0.1267 &  0.2534 &  0.8733 \tabularnewline
117 &  0.09498 &  0.19 &  0.905 \tabularnewline
118 &  0.06565 &  0.1313 &  0.9343 \tabularnewline
119 &  0.04866 &  0.09733 &  0.9513 \tabularnewline
120 &  0.0467 &  0.0934 &  0.9533 \tabularnewline
121 &  0.03716 &  0.07431 &  0.9628 \tabularnewline
122 &  0.02472 &  0.04945 &  0.9753 \tabularnewline
123 &  0.01699 &  0.03397 &  0.983 \tabularnewline
124 &  0.01196 &  0.02392 &  0.988 \tabularnewline
125 &  0.006624 &  0.01325 &  0.9934 \tabularnewline
126 &  0.4568 &  0.9136 &  0.5432 \tabularnewline
127 &  0.3909 &  0.7818 &  0.6091 \tabularnewline
\hline
\end{tabular}
%Source: https://freestatistics.org/blog/index.php?pk=284290&T=5

[TABLE]
[ROW][C]Goldfeld-Quandt test for Heteroskedasticity[/C][/ROW]
[ROW][C]p-values[/C][C]Alternative Hypothesis[/C][/ROW]
[ROW][C]breakpoint index[/C][C]greater[/C][C]2-sided[/C][C]less[/C][/ROW]
[ROW][C]5[/C][C] 0.03002[/C][C] 0.06004[/C][C] 0.97[/C][/ROW]
[ROW][C]6[/C][C] 0.3208[/C][C] 0.6416[/C][C] 0.6792[/C][/ROW]
[ROW][C]7[/C][C] 0.249[/C][C] 0.4979[/C][C] 0.751[/C][/ROW]
[ROW][C]8[/C][C] 0.7902[/C][C] 0.4196[/C][C] 0.2098[/C][/ROW]
[ROW][C]9[/C][C] 0.7001[/C][C] 0.5997[/C][C] 0.2999[/C][/ROW]
[ROW][C]10[/C][C] 0.6228[/C][C] 0.7544[/C][C] 0.3772[/C][/ROW]
[ROW][C]11[/C][C] 0.5702[/C][C] 0.8596[/C][C] 0.4298[/C][/ROW]
[ROW][C]12[/C][C] 0.4843[/C][C] 0.9685[/C][C] 0.5157[/C][/ROW]
[ROW][C]13[/C][C] 0.396[/C][C] 0.792[/C][C] 0.604[/C][/ROW]
[ROW][C]14[/C][C] 0.3398[/C][C] 0.6796[/C][C] 0.6602[/C][/ROW]
[ROW][C]15[/C][C] 0.2687[/C][C] 0.5374[/C][C] 0.7313[/C][/ROW]
[ROW][C]16[/C][C] 0.2358[/C][C] 0.4717[/C][C] 0.7642[/C][/ROW]
[ROW][C]17[/C][C] 0.1783[/C][C] 0.3567[/C][C] 0.8217[/C][/ROW]
[ROW][C]18[/C][C] 0.1748[/C][C] 0.3496[/C][C] 0.8252[/C][/ROW]
[ROW][C]19[/C][C] 0.2297[/C][C] 0.4593[/C][C] 0.7703[/C][/ROW]
[ROW][C]20[/C][C] 0.1781[/C][C] 0.3562[/C][C] 0.8219[/C][/ROW]
[ROW][C]21[/C][C] 0.1918[/C][C] 0.3837[/C][C] 0.8082[/C][/ROW]
[ROW][C]22[/C][C] 0.1467[/C][C] 0.2934[/C][C] 0.8533[/C][/ROW]
[ROW][C]23[/C][C] 0.1269[/C][C] 0.2539[/C][C] 0.8731[/C][/ROW]
[ROW][C]24[/C][C] 0.1265[/C][C] 0.253[/C][C] 0.8735[/C][/ROW]
[ROW][C]25[/C][C] 0.1093[/C][C] 0.2185[/C][C] 0.8907[/C][/ROW]
[ROW][C]26[/C][C] 0.0816[/C][C] 0.1632[/C][C] 0.9184[/C][/ROW]
[ROW][C]27[/C][C] 0.06341[/C][C] 0.1268[/C][C] 0.9366[/C][/ROW]
[ROW][C]28[/C][C] 0.04581[/C][C] 0.09162[/C][C] 0.9542[/C][/ROW]
[ROW][C]29[/C][C] 0.03344[/C][C] 0.06688[/C][C] 0.9666[/C][/ROW]
[ROW][C]30[/C][C] 0.02351[/C][C] 0.04703[/C][C] 0.9765[/C][/ROW]
[ROW][C]31[/C][C] 0.02448[/C][C] 0.04896[/C][C] 0.9755[/C][/ROW]
[ROW][C]32[/C][C] 0.01789[/C][C] 0.03578[/C][C] 0.9821[/C][/ROW]
[ROW][C]33[/C][C] 0.01979[/C][C] 0.03958[/C][C] 0.9802[/C][/ROW]
[ROW][C]34[/C][C] 0.01441[/C][C] 0.02881[/C][C] 0.9856[/C][/ROW]
[ROW][C]35[/C][C] 0.01147[/C][C] 0.02294[/C][C] 0.9885[/C][/ROW]
[ROW][C]36[/C][C] 0.008483[/C][C] 0.01697[/C][C] 0.9915[/C][/ROW]
[ROW][C]37[/C][C] 0.006386[/C][C] 0.01277[/C][C] 0.9936[/C][/ROW]
[ROW][C]38[/C][C] 0.007905[/C][C] 0.01581[/C][C] 0.9921[/C][/ROW]
[ROW][C]39[/C][C] 0.005816[/C][C] 0.01163[/C][C] 0.9942[/C][/ROW]
[ROW][C]40[/C][C] 0.004088[/C][C] 0.008176[/C][C] 0.9959[/C][/ROW]
[ROW][C]41[/C][C] 0.002885[/C][C] 0.00577[/C][C] 0.9971[/C][/ROW]
[ROW][C]42[/C][C] 0.00204[/C][C] 0.004081[/C][C] 0.998[/C][/ROW]
[ROW][C]43[/C][C] 0.001473[/C][C] 0.002946[/C][C] 0.9985[/C][/ROW]
[ROW][C]44[/C][C] 0.006731[/C][C] 0.01346[/C][C] 0.9933[/C][/ROW]
[ROW][C]45[/C][C] 0.07868[/C][C] 0.1574[/C][C] 0.9213[/C][/ROW]
[ROW][C]46[/C][C] 0.06233[/C][C] 0.1247[/C][C] 0.9377[/C][/ROW]
[ROW][C]47[/C][C] 0.05968[/C][C] 0.1194[/C][C] 0.9403[/C][/ROW]
[ROW][C]48[/C][C] 0.05122[/C][C] 0.1024[/C][C] 0.9488[/C][/ROW]
[ROW][C]49[/C][C] 0.03962[/C][C] 0.07924[/C][C] 0.9604[/C][/ROW]
[ROW][C]50[/C][C] 0.0297[/C][C] 0.05941[/C][C] 0.9703[/C][/ROW]
[ROW][C]51[/C][C] 0.02198[/C][C] 0.04395[/C][C] 0.978[/C][/ROW]
[ROW][C]52[/C][C] 0.01946[/C][C] 0.03891[/C][C] 0.9805[/C][/ROW]
[ROW][C]53[/C][C] 0.01462[/C][C] 0.02925[/C][C] 0.9854[/C][/ROW]
[ROW][C]54[/C][C] 0.01802[/C][C] 0.03603[/C][C] 0.982[/C][/ROW]
[ROW][C]55[/C][C] 0.02359[/C][C] 0.04718[/C][C] 0.9764[/C][/ROW]
[ROW][C]56[/C][C] 0.02707[/C][C] 0.05413[/C][C] 0.9729[/C][/ROW]
[ROW][C]57[/C][C] 0.02335[/C][C] 0.04671[/C][C] 0.9766[/C][/ROW]
[ROW][C]58[/C][C] 0.01755[/C][C] 0.0351[/C][C] 0.9824[/C][/ROW]
[ROW][C]59[/C][C] 0.01432[/C][C] 0.02864[/C][C] 0.9857[/C][/ROW]
[ROW][C]60[/C][C] 0.01446[/C][C] 0.02892[/C][C] 0.9855[/C][/ROW]
[ROW][C]61[/C][C] 0.01157[/C][C] 0.02313[/C][C] 0.9884[/C][/ROW]
[ROW][C]62[/C][C] 0.008374[/C][C] 0.01675[/C][C] 0.9916[/C][/ROW]
[ROW][C]63[/C][C] 0.006023[/C][C] 0.01205[/C][C] 0.994[/C][/ROW]
[ROW][C]64[/C][C] 0.006643[/C][C] 0.01329[/C][C] 0.9934[/C][/ROW]
[ROW][C]65[/C][C] 0.006573[/C][C] 0.01315[/C][C] 0.9934[/C][/ROW]
[ROW][C]66[/C][C] 0.07862[/C][C] 0.1572[/C][C] 0.9214[/C][/ROW]
[ROW][C]67[/C][C] 0.1013[/C][C] 0.2025[/C][C] 0.8987[/C][/ROW]
[ROW][C]68[/C][C] 0.09371[/C][C] 0.1874[/C][C] 0.9063[/C][/ROW]
[ROW][C]69[/C][C] 0.0923[/C][C] 0.1846[/C][C] 0.9077[/C][/ROW]
[ROW][C]70[/C][C] 0.07328[/C][C] 0.1466[/C][C] 0.9267[/C][/ROW]
[ROW][C]71[/C][C] 0.06406[/C][C] 0.1281[/C][C] 0.9359[/C][/ROW]
[ROW][C]72[/C][C] 0.09175[/C][C] 0.1835[/C][C] 0.9083[/C][/ROW]
[ROW][C]73[/C][C] 0.09135[/C][C] 0.1827[/C][C] 0.9086[/C][/ROW]
[ROW][C]74[/C][C] 0.0791[/C][C] 0.1582[/C][C] 0.9209[/C][/ROW]
[ROW][C]75[/C][C] 0.07023[/C][C] 0.1405[/C][C] 0.9298[/C][/ROW]
[ROW][C]76[/C][C] 0.09466[/C][C] 0.1893[/C][C] 0.9053[/C][/ROW]
[ROW][C]77[/C][C] 0.07609[/C][C] 0.1522[/C][C] 0.9239[/C][/ROW]
[ROW][C]78[/C][C] 0.06558[/C][C] 0.1312[/C][C] 0.9344[/C][/ROW]
[ROW][C]79[/C][C] 0.1057[/C][C] 0.2114[/C][C] 0.8943[/C][/ROW]
[ROW][C]80[/C][C] 0.2765[/C][C] 0.553[/C][C] 0.7235[/C][/ROW]
[ROW][C]81[/C][C] 0.2376[/C][C] 0.4752[/C][C] 0.7624[/C][/ROW]
[ROW][C]82[/C][C] 0.2279[/C][C] 0.4557[/C][C] 0.7721[/C][/ROW]
[ROW][C]83[/C][C] 0.1945[/C][C] 0.3889[/C][C] 0.8055[/C][/ROW]
[ROW][C]84[/C][C] 0.2894[/C][C] 0.5789[/C][C] 0.7106[/C][/ROW]
[ROW][C]85[/C][C] 0.2716[/C][C] 0.5431[/C][C] 0.7284[/C][/ROW]
[ROW][C]86[/C][C] 0.2359[/C][C] 0.4718[/C][C] 0.7641[/C][/ROW]
[ROW][C]87[/C][C] 0.2052[/C][C] 0.4104[/C][C] 0.7948[/C][/ROW]
[ROW][C]88[/C][C] 0.1867[/C][C] 0.3734[/C][C] 0.8133[/C][/ROW]
[ROW][C]89[/C][C] 0.1594[/C][C] 0.3188[/C][C] 0.8406[/C][/ROW]
[ROW][C]90[/C][C] 0.1834[/C][C] 0.3669[/C][C] 0.8166[/C][/ROW]
[ROW][C]91[/C][C] 0.1502[/C][C] 0.3003[/C][C] 0.8498[/C][/ROW]
[ROW][C]92[/C][C] 0.15[/C][C] 0.2999[/C][C] 0.85[/C][/ROW]
[ROW][C]93[/C][C] 0.2707[/C][C] 0.5414[/C][C] 0.7293[/C][/ROW]
[ROW][C]94[/C][C] 0.2301[/C][C] 0.4601[/C][C] 0.7699[/C][/ROW]
[ROW][C]95[/C][C] 0.2133[/C][C] 0.4266[/C][C] 0.7867[/C][/ROW]
[ROW][C]96[/C][C] 0.2128[/C][C] 0.4256[/C][C] 0.7872[/C][/ROW]
[ROW][C]97[/C][C] 0.1781[/C][C] 0.3562[/C][C] 0.8219[/C][/ROW]
[ROW][C]98[/C][C] 0.1489[/C][C] 0.2977[/C][C] 0.8511[/C][/ROW]
[ROW][C]99[/C][C] 0.1207[/C][C] 0.2413[/C][C] 0.8793[/C][/ROW]
[ROW][C]100[/C][C] 0.1016[/C][C] 0.2031[/C][C] 0.8984[/C][/ROW]
[ROW][C]101[/C][C] 0.07975[/C][C] 0.1595[/C][C] 0.9203[/C][/ROW]
[ROW][C]102[/C][C] 0.06302[/C][C] 0.126[/C][C] 0.937[/C][/ROW]
[ROW][C]103[/C][C] 0.08385[/C][C] 0.1677[/C][C] 0.9162[/C][/ROW]
[ROW][C]104[/C][C] 0.08307[/C][C] 0.1661[/C][C] 0.9169[/C][/ROW]
[ROW][C]105[/C][C] 0.08244[/C][C] 0.1649[/C][C] 0.9176[/C][/ROW]
[ROW][C]106[/C][C] 0.06207[/C][C] 0.1241[/C][C] 0.9379[/C][/ROW]
[ROW][C]107[/C][C] 0.04887[/C][C] 0.09775[/C][C] 0.9511[/C][/ROW]
[ROW][C]108[/C][C] 0.06078[/C][C] 0.1216[/C][C] 0.9392[/C][/ROW]
[ROW][C]109[/C][C] 0.05011[/C][C] 0.1002[/C][C] 0.9499[/C][/ROW]
[ROW][C]110[/C][C] 0.03864[/C][C] 0.07728[/C][C] 0.9614[/C][/ROW]
[ROW][C]111[/C][C] 0.03735[/C][C] 0.0747[/C][C] 0.9626[/C][/ROW]
[ROW][C]112[/C][C] 0.03633[/C][C] 0.07265[/C][C] 0.9637[/C][/ROW]
[ROW][C]113[/C][C] 0.04587[/C][C] 0.09174[/C][C] 0.9541[/C][/ROW]
[ROW][C]114[/C][C] 0.03241[/C][C] 0.06482[/C][C] 0.9676[/C][/ROW]
[ROW][C]115[/C][C] 0.1565[/C][C] 0.313[/C][C] 0.8435[/C][/ROW]
[ROW][C]116[/C][C] 0.1267[/C][C] 0.2534[/C][C] 0.8733[/C][/ROW]
[ROW][C]117[/C][C] 0.09498[/C][C] 0.19[/C][C] 0.905[/C][/ROW]
[ROW][C]118[/C][C] 0.06565[/C][C] 0.1313[/C][C] 0.9343[/C][/ROW]
[ROW][C]119[/C][C] 0.04866[/C][C] 0.09733[/C][C] 0.9513[/C][/ROW]
[ROW][C]120[/C][C] 0.0467[/C][C] 0.0934[/C][C] 0.9533[/C][/ROW]
[ROW][C]121[/C][C] 0.03716[/C][C] 0.07431[/C][C] 0.9628[/C][/ROW]
[ROW][C]122[/C][C] 0.02472[/C][C] 0.04945[/C][C] 0.9753[/C][/ROW]
[ROW][C]123[/C][C] 0.01699[/C][C] 0.03397[/C][C] 0.983[/C][/ROW]
[ROW][C]124[/C][C] 0.01196[/C][C] 0.02392[/C][C] 0.988[/C][/ROW]
[ROW][C]125[/C][C] 0.006624[/C][C] 0.01325[/C][C] 0.9934[/C][/ROW]
[ROW][C]126[/C][C] 0.4568[/C][C] 0.9136[/C][C] 0.5432[/C][/ROW]
[ROW][C]127[/C][C] 0.3909[/C][C] 0.7818[/C][C] 0.6091[/C][/ROW]
[/TABLE]
Source: https://freestatistics.org/blog/index.php?pk=284290&T=5

Globally Unique Identifier (entire table): ba.freestatistics.org/blog/index.php?pk=284290&T=5

As an alternative you can also use a QR Code:  

The GUIDs for individual cells are displayed in the table below:

Goldfeld-Quandt test for Heteroskedasticity
p-valuesAlternative Hypothesis
breakpoint indexgreater2-sidedless
5 0.03002 0.06004 0.97
6 0.3208 0.6416 0.6792
7 0.249 0.4979 0.751
8 0.7902 0.4196 0.2098
9 0.7001 0.5997 0.2999
10 0.6228 0.7544 0.3772
11 0.5702 0.8596 0.4298
12 0.4843 0.9685 0.5157
13 0.396 0.792 0.604
14 0.3398 0.6796 0.6602
15 0.2687 0.5374 0.7313
16 0.2358 0.4717 0.7642
17 0.1783 0.3567 0.8217
18 0.1748 0.3496 0.8252
19 0.2297 0.4593 0.7703
20 0.1781 0.3562 0.8219
21 0.1918 0.3837 0.8082
22 0.1467 0.2934 0.8533
23 0.1269 0.2539 0.8731
24 0.1265 0.253 0.8735
25 0.1093 0.2185 0.8907
26 0.0816 0.1632 0.9184
27 0.06341 0.1268 0.9366
28 0.04581 0.09162 0.9542
29 0.03344 0.06688 0.9666
30 0.02351 0.04703 0.9765
31 0.02448 0.04896 0.9755
32 0.01789 0.03578 0.9821
33 0.01979 0.03958 0.9802
34 0.01441 0.02881 0.9856
35 0.01147 0.02294 0.9885
36 0.008483 0.01697 0.9915
37 0.006386 0.01277 0.9936
38 0.007905 0.01581 0.9921
39 0.005816 0.01163 0.9942
40 0.004088 0.008176 0.9959
41 0.002885 0.00577 0.9971
42 0.00204 0.004081 0.998
43 0.001473 0.002946 0.9985
44 0.006731 0.01346 0.9933
45 0.07868 0.1574 0.9213
46 0.06233 0.1247 0.9377
47 0.05968 0.1194 0.9403
48 0.05122 0.1024 0.9488
49 0.03962 0.07924 0.9604
50 0.0297 0.05941 0.9703
51 0.02198 0.04395 0.978
52 0.01946 0.03891 0.9805
53 0.01462 0.02925 0.9854
54 0.01802 0.03603 0.982
55 0.02359 0.04718 0.9764
56 0.02707 0.05413 0.9729
57 0.02335 0.04671 0.9766
58 0.01755 0.0351 0.9824
59 0.01432 0.02864 0.9857
60 0.01446 0.02892 0.9855
61 0.01157 0.02313 0.9884
62 0.008374 0.01675 0.9916
63 0.006023 0.01205 0.994
64 0.006643 0.01329 0.9934
65 0.006573 0.01315 0.9934
66 0.07862 0.1572 0.9214
67 0.1013 0.2025 0.8987
68 0.09371 0.1874 0.9063
69 0.0923 0.1846 0.9077
70 0.07328 0.1466 0.9267
71 0.06406 0.1281 0.9359
72 0.09175 0.1835 0.9083
73 0.09135 0.1827 0.9086
74 0.0791 0.1582 0.9209
75 0.07023 0.1405 0.9298
76 0.09466 0.1893 0.9053
77 0.07609 0.1522 0.9239
78 0.06558 0.1312 0.9344
79 0.1057 0.2114 0.8943
80 0.2765 0.553 0.7235
81 0.2376 0.4752 0.7624
82 0.2279 0.4557 0.7721
83 0.1945 0.3889 0.8055
84 0.2894 0.5789 0.7106
85 0.2716 0.5431 0.7284
86 0.2359 0.4718 0.7641
87 0.2052 0.4104 0.7948
88 0.1867 0.3734 0.8133
89 0.1594 0.3188 0.8406
90 0.1834 0.3669 0.8166
91 0.1502 0.3003 0.8498
92 0.15 0.2999 0.85
93 0.2707 0.5414 0.7293
94 0.2301 0.4601 0.7699
95 0.2133 0.4266 0.7867
96 0.2128 0.4256 0.7872
97 0.1781 0.3562 0.8219
98 0.1489 0.2977 0.8511
99 0.1207 0.2413 0.8793
100 0.1016 0.2031 0.8984
101 0.07975 0.1595 0.9203
102 0.06302 0.126 0.937
103 0.08385 0.1677 0.9162
104 0.08307 0.1661 0.9169
105 0.08244 0.1649 0.9176
106 0.06207 0.1241 0.9379
107 0.04887 0.09775 0.9511
108 0.06078 0.1216 0.9392
109 0.05011 0.1002 0.9499
110 0.03864 0.07728 0.9614
111 0.03735 0.0747 0.9626
112 0.03633 0.07265 0.9637
113 0.04587 0.09174 0.9541
114 0.03241 0.06482 0.9676
115 0.1565 0.313 0.8435
116 0.1267 0.2534 0.8733
117 0.09498 0.19 0.905
118 0.06565 0.1313 0.9343
119 0.04866 0.09733 0.9513
120 0.0467 0.0934 0.9533
121 0.03716 0.07431 0.9628
122 0.02472 0.04945 0.9753
123 0.01699 0.03397 0.983
124 0.01196 0.02392 0.988
125 0.006624 0.01325 0.9934
126 0.4568 0.9136 0.5432
127 0.3909 0.7818 0.6091


Meta Analysis of Goldfeld-Quandt test for Heteroskedasticity
Description# significant tests% significant testsOK/NOK
1% type I error level4 0.03252NOK
5% type I error level330.268293NOK
10% type I error level480.390244NOK

\begin{tabular}{lllllllll}
\hline
Meta Analysis of Goldfeld-Quandt test for Heteroskedasticity \tabularnewline
Description & # significant tests & % significant tests & OK/NOK \tabularnewline
1% type I error level & 4 &  0.03252 & NOK \tabularnewline
5% type I error level & 33 & 0.268293 & NOK \tabularnewline
10% type I error level & 48 & 0.390244 & NOK \tabularnewline
\hline
\end{tabular}
%Source: https://freestatistics.org/blog/index.php?pk=284290&T=6

[TABLE]
[ROW][C]Meta Analysis of Goldfeld-Quandt test for Heteroskedasticity[/C][/ROW]
[ROW][C]Description[/C][C]# significant tests[/C][C]% significant tests[/C][C]OK/NOK[/C][/ROW]
[ROW][C]1% type I error level[/C][C]4[/C][C] 0.03252[/C][C]NOK[/C][/ROW]
[ROW][C]5% type I error level[/C][C]33[/C][C]0.268293[/C][C]NOK[/C][/ROW]
[ROW][C]10% type I error level[/C][C]48[/C][C]0.390244[/C][C]NOK[/C][/ROW]
[/TABLE]
Source: https://freestatistics.org/blog/index.php?pk=284290&T=6

Globally Unique Identifier (entire table): ba.freestatistics.org/blog/index.php?pk=284290&T=6

As an alternative you can also use a QR Code:  

The GUIDs for individual cells are displayed in the table below:

Meta Analysis of Goldfeld-Quandt test for Heteroskedasticity
Description# significant tests% significant testsOK/NOK
1% type I error level4 0.03252NOK
5% type I error level330.268293NOK
10% type I error level480.390244NOK


Parameters (Session):
par1 = 1 ; par2 = Do not include Seasonal Dummies ; par3 = No Linear Trend ;
Parameters (R input):
par1 = 1 ; par2 = Do not include Seasonal Dummies ; par3 = No Linear Trend ;
R code (references can be found in the software module):
library(lattice)
library(lmtest)
n25 <- 25 #minimum number of obs. for Goldfeld-Quandt test
mywarning <- ''
par1 <- as.numeric(par1)
if(is.na(par1)) {
par1 <- 1
mywarning = 'Warning: you did not specify the column number of the endogenous series! The first column was selected by default.'
}
x <- na.omit(t(y))
k <- length(x[1,])
n <- length(x[,1])
x1 <- cbind(x[,par1], x[,1:k!=par1])
mycolnames <- c(colnames(x)[par1], colnames(x)[1:k!=par1])
colnames(x1) <- mycolnames #colnames(x)[par1]
x <- x1
if (par3 == 'First Differences'){
x2 <- array(0, dim=c(n-1,k), dimnames=list(1:(n-1), paste('(1-B)',colnames(x),sep='')))
for (i in 1:n-1) {
for (j in 1:k) {
x2[i,j] <- x[i+1,j] - x[i,j]
}
}
x <- x2
}
if (par2 == 'Include Monthly Dummies'){
x2 <- array(0, dim=c(n,11), dimnames=list(1:n, paste('M', seq(1:11), sep ='')))
for (i in 1:11){
x2[seq(i,n,12),i] <- 1
}
x <- cbind(x, x2)
}
if (par2 == 'Include Quarterly Dummies'){
x2 <- array(0, dim=c(n,3), dimnames=list(1:n, paste('Q', seq(1:3), sep ='')))
for (i in 1:3){
x2[seq(i,n,4),i] <- 1
}
x <- cbind(x, x2)
}
k <- length(x[1,])
if (par3 == 'Linear Trend'){
x <- cbind(x, c(1:n))
colnames(x)[k+1] <- 't'
}
x
k <- length(x[1,])
df <- as.data.frame(x)
(mylm <- lm(df))
(mysum <- summary(mylm))
if (n > n25) {
kp3 <- k + 3
nmkm3 <- n - k - 3
gqarr <- array(NA, dim=c(nmkm3-kp3+1,3))
numgqtests <- 0
numsignificant1 <- 0
numsignificant5 <- 0
numsignificant10 <- 0
for (mypoint in kp3:nmkm3) {
j <- 0
numgqtests <- numgqtests + 1
for (myalt in c('greater', 'two.sided', 'less')) {
j <- j + 1
gqarr[mypoint-kp3+1,j] <- gqtest(mylm, point=mypoint, alternative=myalt)$p.value
}
if (gqarr[mypoint-kp3+1,2] < 0.01) numsignificant1 <- numsignificant1 + 1
if (gqarr[mypoint-kp3+1,2] < 0.05) numsignificant5 <- numsignificant5 + 1
if (gqarr[mypoint-kp3+1,2] < 0.10) numsignificant10 <- numsignificant10 + 1
}
gqarr
}
bitmap(file='test0.png')
plot(x[,1], type='l', main='Actuals and Interpolation', ylab='value of Actuals and Interpolation (dots)', xlab='time or index')
points(x[,1]-mysum$resid)
grid()
dev.off()
bitmap(file='test1.png')
plot(mysum$resid, type='b', pch=19, main='Residuals', ylab='value of Residuals', xlab='time or index')
grid()
dev.off()
bitmap(file='test2.png')
hist(mysum$resid, main='Residual Histogram', xlab='values of Residuals')
grid()
dev.off()
bitmap(file='test3.png')
densityplot(~mysum$resid,col='black',main='Residual Density Plot', xlab='values of Residuals')
dev.off()
bitmap(file='test4.png')
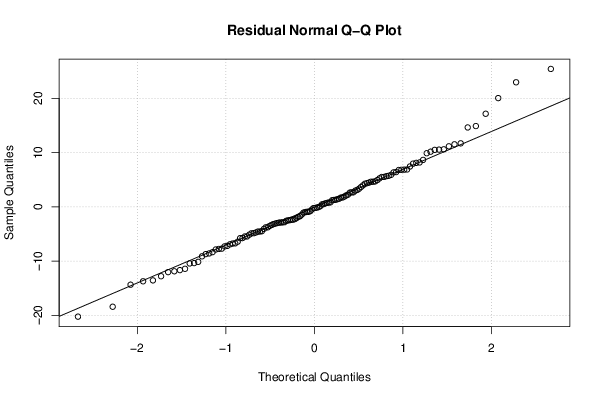
qqnorm(mysum$resid, main='Residual Normal Q-Q Plot')
qqline(mysum$resid)
grid()
dev.off()
(myerror <- as.ts(mysum$resid))
bitmap(file='test5.png')
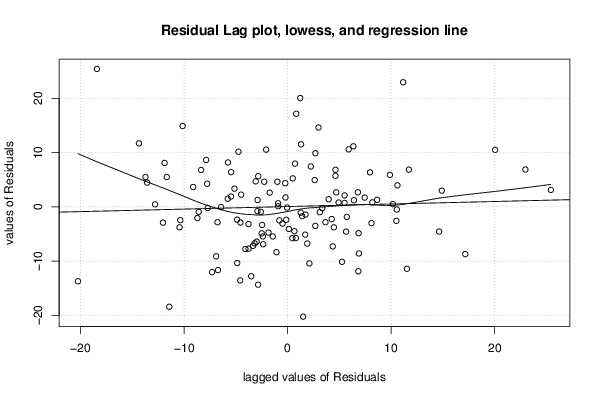
dum <- cbind(lag(myerror,k=1),myerror)
dum
dum1 <- dum[2:length(myerror),]
dum1
z <- as.data.frame(dum1)
z
plot(z,main=paste('Residual Lag plot, lowess, and regression line'), ylab='values of Residuals', xlab='lagged values of Residuals')
lines(lowess(z))
abline(lm(z))
grid()
dev.off()
bitmap(file='test6.png')
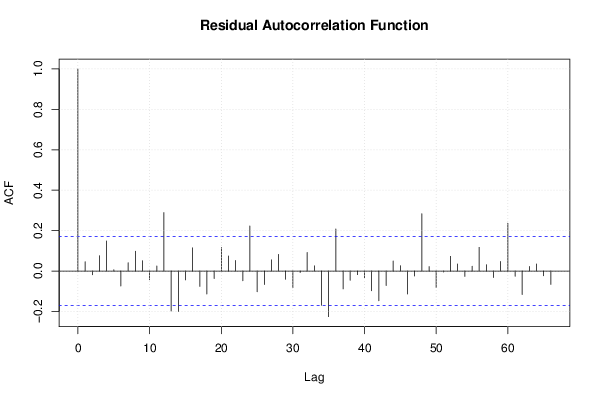
acf(mysum$resid, lag.max=length(mysum$resid)/2, main='Residual Autocorrelation Function')
grid()
dev.off()
bitmap(file='test7.png')
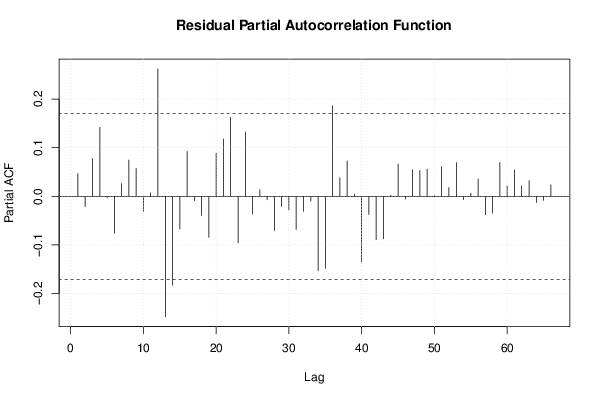
pacf(mysum$resid, lag.max=length(mysum$resid)/2, main='Residual Partial Autocorrelation Function')
grid()
dev.off()
bitmap(file='test8.png')
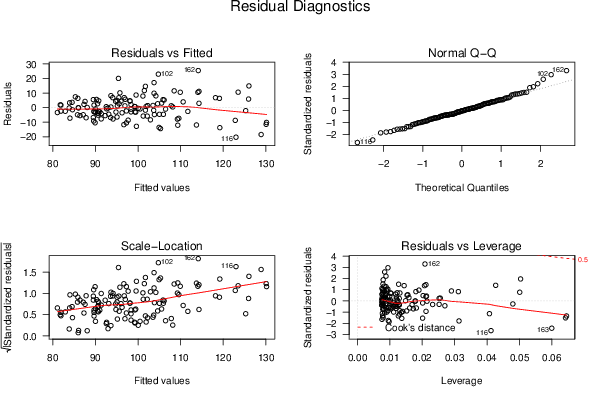
opar <- par(mfrow = c(2,2), oma = c(0, 0, 1.1, 0))
plot(mylm, las = 1, sub='Residual Diagnostics')
par(opar)
dev.off()
if (n > n25) {
bitmap(file='test9.png')
plot(kp3:nmkm3,gqarr[,2], main='Goldfeld-Quandt test',ylab='2-sided p-value',xlab='breakpoint')
grid()
dev.off()
}
load(file='createtable')
a<-table.start()
a<-table.row.start(a)
a<-table.element(a, 'Multiple Linear Regression - Estimated Regression Equation', 1, TRUE)
a<-table.row.end(a)
myeq <- colnames(x)[1]
myeq <- paste(myeq, '[t] = ', sep='')
for (i in 1:k){
if (mysum$coefficients[i,1] > 0) myeq <- paste(myeq, '+', '')
myeq <- paste(myeq, signif(mysum$coefficients[i,1],6), sep=' ')
if (rownames(mysum$coefficients)[i] != '(Intercept)') {
myeq <- paste(myeq, rownames(mysum$coefficients)[i], sep='')
if (rownames(mysum$coefficients)[i] != 't') myeq <- paste(myeq, '[t]', sep='')
}
}
myeq <- paste(myeq, ' + e[t]')
a<-table.row.start(a)
a<-table.element(a, myeq)
a<-table.row.end(a)
a<-table.row.start(a)
a<-table.element(a, mywarning)
a<-table.row.end(a)
a<-table.end(a)
table.save(a,file='mytable1.tab')
a<-table.start()
a<-table.row.start(a)
a<-table.element(a,hyperlink('ols1.htm','Multiple Linear Regression - Ordinary Least Squares',''), 6, TRUE)
a<-table.row.end(a)
a<-table.row.start(a)
a<-table.element(a,'Variable',header=TRUE)
a<-table.element(a,'Parameter',header=TRUE)
a<-table.element(a,'S.D.',header=TRUE)
a<-table.element(a,'T-STAT
H0: parameter = 0',header=TRUE)
a<-table.element(a,'2-tail p-value',header=TRUE)
a<-table.element(a,'1-tail p-value',header=TRUE)
a<-table.row.end(a)
for (i in 1:k){
a<-table.row.start(a)
a<-table.element(a,rownames(mysum$coefficients)[i],header=TRUE)
a<-table.element(a,formatC(signif(mysum$coefficients[i,1],5),format='g',flag='+'))
a<-table.element(a,formatC(signif(mysum$coefficients[i,2],5),format='g',flag=' '))
a<-table.element(a,formatC(signif(mysum$coefficients[i,3],4),format='e',flag='+'))
a<-table.element(a,formatC(signif(mysum$coefficients[i,4],4),format='g',flag=' '))
a<-table.element(a,formatC(signif(mysum$coefficients[i,4]/2,4),format='g',flag=' '))
a<-table.row.end(a)
}
a<-table.end(a)
table.save(a,file='mytable2.tab')
a<-table.start()
a<-table.row.start(a)
a<-table.element(a, 'Multiple Linear Regression - Regression Statistics', 2, TRUE)
a<-table.row.end(a)
a<-table.row.start(a)
a<-table.element(a, 'Multiple R',1,TRUE)
a<-table.element(a,formatC(signif(sqrt(mysum$r.squared),6),format='g',flag=' '))
a<-table.row.end(a)
a<-table.row.start(a)
a<-table.element(a, 'R-squared',1,TRUE)
a<-table.element(a,formatC(signif(mysum$r.squared,6),format='g',flag=' '))
a<-table.row.end(a)
a<-table.row.start(a)
a<-table.element(a, 'Adjusted R-squared',1,TRUE)
a<-table.element(a,formatC(signif(mysum$adj.r.squared,6),format='g',flag=' '))
a<-table.row.end(a)
a<-table.row.start(a)
a<-table.element(a, 'F-TEST (value)',1,TRUE)
a<-table.element(a,formatC(signif(mysum$fstatistic[1],6),format='g',flag=' '))
a<-table.row.end(a)
a<-table.row.start(a)
a<-table.element(a, 'F-TEST (DF numerator)',1,TRUE)
a<-table.element(a, signif(mysum$fstatistic[2],6))
a<-table.row.end(a)
a<-table.row.start(a)
a<-table.element(a, 'F-TEST (DF denominator)',1,TRUE)
a<-table.element(a, signif(mysum$fstatistic[3],6))
a<-table.row.end(a)
a<-table.row.start(a)
a<-table.element(a, 'p-value',1,TRUE)
a<-table.element(a,formatC(signif(1-pf(mysum$fstatistic[1],mysum$fstatistic[2],mysum$fstatistic[3]),6),format='g',flag=' '))
a<-table.row.end(a)
a<-table.row.start(a)
a<-table.element(a, 'Multiple Linear Regression - Residual Statistics', 2, TRUE)
a<-table.row.end(a)
a<-table.row.start(a)
a<-table.element(a, 'Residual Standard Deviation',1,TRUE)
a<-table.element(a,formatC(signif(mysum$sigma,6),format='g',flag=' '))
a<-table.row.end(a)
a<-table.row.start(a)
a<-table.element(a, 'Sum Squared Residuals',1,TRUE)
a<-table.element(a,formatC(signif(sum(myerror*myerror),6),format='g',flag=' '))
a<-table.row.end(a)
a<-table.end(a)
table.save(a,file='mytable3.tab')
if(n < 200) {
a<-table.start()
a<-table.row.start(a)
a<-table.element(a, 'Multiple Linear Regression - Actuals, Interpolation, and Residuals', 4, TRUE)
a<-table.row.end(a)
a<-table.row.start(a)
a<-table.element(a, 'Time or Index', 1, TRUE)
a<-table.element(a, 'Actuals', 1, TRUE)
a<-table.element(a, 'Interpolation
Forecast', 1, TRUE)
a<-table.element(a, 'Residuals
Prediction Error', 1, TRUE)
a<-table.row.end(a)
for (i in 1:n) {
a<-table.row.start(a)
a<-table.element(a,i, 1, TRUE)
a<-table.element(a,formatC(signif(x[i],6),format='g',flag=' '))
a<-table.element(a,formatC(signif(x[i]-mysum$resid[i],6),format='g',flag=' '))
a<-table.element(a,formatC(signif(mysum$resid[i],6),format='g',flag=' '))
a<-table.row.end(a)
}
a<-table.end(a)
table.save(a,file='mytable4.tab')
if (n > n25) {
a<-table.start()
a<-table.row.start(a)
a<-table.element(a,'Goldfeld-Quandt test for Heteroskedasticity',4,TRUE)
a<-table.row.end(a)
a<-table.row.start(a)
a<-table.element(a,'p-values',header=TRUE)
a<-table.element(a,'Alternative Hypothesis',3,header=TRUE)
a<-table.row.end(a)
a<-table.row.start(a)
a<-table.element(a,'breakpoint index',header=TRUE)
a<-table.element(a,'greater',header=TRUE)
a<-table.element(a,'2-sided',header=TRUE)
a<-table.element(a,'less',header=TRUE)
a<-table.row.end(a)
for (mypoint in kp3:nmkm3) {
a<-table.row.start(a)
a<-table.element(a,mypoint,header=TRUE)
a<-table.element(a,formatC(signif(gqarr[mypoint-kp3+1,1],6),format='g',flag=' '))
a<-table.element(a,formatC(signif(gqarr[mypoint-kp3+1,2],6),format='g',flag=' '))
a<-table.element(a,formatC(signif(gqarr[mypoint-kp3+1,3],6),format='g',flag=' '))
a<-table.row.end(a)
}
a<-table.end(a)
table.save(a,file='mytable5.tab')
a<-table.start()
a<-table.row.start(a)
a<-table.element(a,'Meta Analysis of Goldfeld-Quandt test for Heteroskedasticity',4,TRUE)
a<-table.row.end(a)
a<-table.row.start(a)
a<-table.element(a,'Description',header=TRUE)
a<-table.element(a,'# significant tests',header=TRUE)
a<-table.element(a,'% significant tests',header=TRUE)
a<-table.element(a,'OK/NOK',header=TRUE)
a<-table.row.end(a)
a<-table.row.start(a)
a<-table.element(a,'1% type I error level',header=TRUE)
a<-table.element(a,signif(numsignificant1,6))
a<-table.element(a,formatC(signif(numsignificant1/numgqtests,6),format='g',flag=' '))
if (numsignificant1/numgqtests < 0.01) dum <- 'OK' else dum <- 'NOK'
a<-table.element(a,dum)
a<-table.row.end(a)
a<-table.row.start(a)
a<-table.element(a,'5% type I error level',header=TRUE)
a<-table.element(a,signif(numsignificant5,6))
a<-table.element(a,signif(numsignificant5/numgqtests,6))
if (numsignificant5/numgqtests < 0.05) dum <- 'OK' else dum <- 'NOK'
a<-table.element(a,dum)
a<-table.row.end(a)
a<-table.row.start(a)
a<-table.element(a,'10% type I error level',header=TRUE)
a<-table.element(a,signif(numsignificant10,6))
a<-table.element(a,signif(numsignificant10/numgqtests,6))
if (numsignificant10/numgqtests < 0.1) dum <- 'OK' else dum <- 'NOK'
a<-table.element(a,dum)
a<-table.row.end(a)
a<-table.end(a)
table.save(a,file='mytable6.tab')
}
}