Free Statistics

of Irreproducible Research!

Author's title

Author*The author of this computation has been verified*
R Software Modulerwasp_spectrum.wasp
Title produced by softwareSpectral Analysis
Date of computationThu, 26 Nov 2015 19:42:48 +0000
Cite this page as followsStatistical Computations at FreeStatistics.org, Office for Research Development and Education, URL https://freestatistics.org/blog/index.php?v=date/2015/Nov/26/t1448567014k0du6xpks93mzfx.htm/, Retrieved Mon, 13 May 2024 23:28:55 +0000
Statistical Computations at FreeStatistics.org, Office for Research Development and Education, URL https://freestatistics.org/blog/index.php?pk=284274, Retrieved Mon, 13 May 2024 23:28:55 +0000
QR Codes:

Original text written by user:
IsPrivate?No (this computation is public)
User-defined keywords
Estimated Impact111
Family? (F = Feedback message, R = changed R code, M = changed R Module, P = changed Parameters, D = changed Data)
-       [Spectral Analysis] [Periodogram China] [2015-11-26 19:42:48] [60fe8c82fc27b8a1ae22563c57c4f789] [Current]
Feedback Forum

Post a new message
Dataseries X:
7705
6654
6913
9215
11079
12499
13481
11358
12904
12138
9951
8565
6844
6404
8514
14379
15854
15061
18152
15009
15906
13025
11128
9771
7892
8349
10585
18132
16297
18512
21652
19304
19299
16079
11049
10008
8397
7973
13087
20052
19550
22343
28189
24835
20874
19596
14016
12135
8658
11786
16060
23387
24952
22371
26667
26529
20670
21079
16853
14073


Summary of computational transaction
Raw Inputview raw input (R code)
Raw Outputview raw output of R engine
Computing time1 seconds
R Server'Herman Ole Andreas Wold' @ wold.wessa.net

\begin{tabular}{lllllllll}
\hline
Summary of computational transaction \tabularnewline
Raw Input & view raw input (R code)  \tabularnewline
Raw Output & view raw output of R engine  \tabularnewline
Computing time & 1 seconds \tabularnewline
R Server & 'Herman Ole Andreas Wold' @ wold.wessa.net \tabularnewline
\hline
\end{tabular}
%Source: https://freestatistics.org/blog/index.php?pk=284274&T=0

[TABLE]
[ROW][C]Summary of computational transaction[/C][/ROW]
[ROW][C]Raw Input[/C][C]view raw input (R code) [/C][/ROW]
[ROW][C]Raw Output[/C][C]view raw output of R engine [/C][/ROW]
[ROW][C]Computing time[/C][C]1 seconds[/C][/ROW]
[ROW][C]R Server[/C][C]'Herman Ole Andreas Wold' @ wold.wessa.net[/C][/ROW]
[/TABLE]
Source: https://freestatistics.org/blog/index.php?pk=284274&T=0

Globally Unique Identifier (entire table): ba.freestatistics.org/blog/index.php?pk=284274&T=0

As an alternative you can also use a QR Code:  

The GUIDs for individual cells are displayed in the table below:

Summary of computational transaction
Raw Inputview raw input (R code)
Raw Outputview raw output of R engine
Computing time1 seconds
R Server'Herman Ole Andreas Wold' @ wold.wessa.net


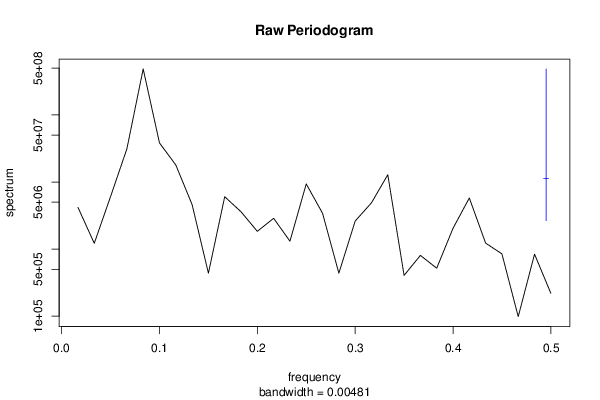
Raw Periodogram
ParameterValue
Box-Cox transformation parameter (lambda)1
Degree of non-seasonal differencing (d)0
Degree of seasonal differencing (D)0
Seasonal Period (s)12
Frequency (Period)Spectrum
0.0167 (60)4186513.416955
0.0333 (30)1219380.169013
0.05 (20)6077673.116123
0.0667 (15)31245593.100367
0.0833 (12)485592009.145208
0.1 (10)38277166.596574
0.1167 (8.5714)17981904.096872
0.1333 (7.5)4607293.284668
0.15 (6.6667)437260.017797
0.1667 (6)6039357.752681
0.1833 (5.4545)3597870.090301
0.2 (5)1839762.504227
0.2167 (4.6154)2877742.313703
0.2333 (4.2857)1312862.241606
0.25 (4)9359048.347077
0.2667 (3.75)3418573.634503
0.2833 (3.5294)437523.206179
0.3 (3.3333)2614984.7465
0.3167 (3.1579)4901872.470738
0.3333 (3)12836883.805994
0.35 (2.8571)405419.166028
0.3667 (2.7273)805632.13216
0.3833 (2.6087)518707.992395
0.4 (2.5)2039761.57901
0.4167 (2.4)5780055.323869
0.4333 (2.3077)1226642.68298
0.45 (2.2222)848781.489512
0.4667 (2.1429)98250.08084
0.4833 (2.069)839363.965606
0.5 (2)219176.491989

\begin{tabular}{lllllllll}
\hline
Raw Periodogram \tabularnewline
Parameter & Value \tabularnewline
Box-Cox transformation parameter (lambda) & 1 \tabularnewline
Degree of non-seasonal differencing (d) & 0 \tabularnewline
Degree of seasonal differencing (D) & 0 \tabularnewline
Seasonal Period (s) & 12 \tabularnewline
Frequency (Period) & Spectrum \tabularnewline
0.0167 (60) & 4186513.416955 \tabularnewline
0.0333 (30) & 1219380.169013 \tabularnewline
0.05 (20) & 6077673.116123 \tabularnewline
0.0667 (15) & 31245593.100367 \tabularnewline
0.0833 (12) & 485592009.145208 \tabularnewline
0.1 (10) & 38277166.596574 \tabularnewline
0.1167 (8.5714) & 17981904.096872 \tabularnewline
0.1333 (7.5) & 4607293.284668 \tabularnewline
0.15 (6.6667) & 437260.017797 \tabularnewline
0.1667 (6) & 6039357.752681 \tabularnewline
0.1833 (5.4545) & 3597870.090301 \tabularnewline
0.2 (5) & 1839762.504227 \tabularnewline
0.2167 (4.6154) & 2877742.313703 \tabularnewline
0.2333 (4.2857) & 1312862.241606 \tabularnewline
0.25 (4) & 9359048.347077 \tabularnewline
0.2667 (3.75) & 3418573.634503 \tabularnewline
0.2833 (3.5294) & 437523.206179 \tabularnewline
0.3 (3.3333) & 2614984.7465 \tabularnewline
0.3167 (3.1579) & 4901872.470738 \tabularnewline
0.3333 (3) & 12836883.805994 \tabularnewline
0.35 (2.8571) & 405419.166028 \tabularnewline
0.3667 (2.7273) & 805632.13216 \tabularnewline
0.3833 (2.6087) & 518707.992395 \tabularnewline
0.4 (2.5) & 2039761.57901 \tabularnewline
0.4167 (2.4) & 5780055.323869 \tabularnewline
0.4333 (2.3077) & 1226642.68298 \tabularnewline
0.45 (2.2222) & 848781.489512 \tabularnewline
0.4667 (2.1429) & 98250.08084 \tabularnewline
0.4833 (2.069) & 839363.965606 \tabularnewline
0.5 (2) & 219176.491989 \tabularnewline
\hline
\end{tabular}
%Source: https://freestatistics.org/blog/index.php?pk=284274&T=1

[TABLE]
[ROW][C]Raw Periodogram[/C][/ROW]
[ROW][C]Parameter[/C][C]Value[/C][/ROW]
[ROW][C]Box-Cox transformation parameter (lambda)[/C][C]1[/C][/ROW]
[ROW][C]Degree of non-seasonal differencing (d)[/C][C]0[/C][/ROW]
[ROW][C]Degree of seasonal differencing (D)[/C][C]0[/C][/ROW]
[ROW][C]Seasonal Period (s)[/C][C]12[/C][/ROW]
[ROW][C]Frequency (Period)[/C][C]Spectrum[/C][/ROW]
[ROW][C]0.0167 (60)[/C][C]4186513.416955[/C][/ROW]
[ROW][C]0.0333 (30)[/C][C]1219380.169013[/C][/ROW]
[ROW][C]0.05 (20)[/C][C]6077673.116123[/C][/ROW]
[ROW][C]0.0667 (15)[/C][C]31245593.100367[/C][/ROW]
[ROW][C]0.0833 (12)[/C][C]485592009.145208[/C][/ROW]
[ROW][C]0.1 (10)[/C][C]38277166.596574[/C][/ROW]
[ROW][C]0.1167 (8.5714)[/C][C]17981904.096872[/C][/ROW]
[ROW][C]0.1333 (7.5)[/C][C]4607293.284668[/C][/ROW]
[ROW][C]0.15 (6.6667)[/C][C]437260.017797[/C][/ROW]
[ROW][C]0.1667 (6)[/C][C]6039357.752681[/C][/ROW]
[ROW][C]0.1833 (5.4545)[/C][C]3597870.090301[/C][/ROW]
[ROW][C]0.2 (5)[/C][C]1839762.504227[/C][/ROW]
[ROW][C]0.2167 (4.6154)[/C][C]2877742.313703[/C][/ROW]
[ROW][C]0.2333 (4.2857)[/C][C]1312862.241606[/C][/ROW]
[ROW][C]0.25 (4)[/C][C]9359048.347077[/C][/ROW]
[ROW][C]0.2667 (3.75)[/C][C]3418573.634503[/C][/ROW]
[ROW][C]0.2833 (3.5294)[/C][C]437523.206179[/C][/ROW]
[ROW][C]0.3 (3.3333)[/C][C]2614984.7465[/C][/ROW]
[ROW][C]0.3167 (3.1579)[/C][C]4901872.470738[/C][/ROW]
[ROW][C]0.3333 (3)[/C][C]12836883.805994[/C][/ROW]
[ROW][C]0.35 (2.8571)[/C][C]405419.166028[/C][/ROW]
[ROW][C]0.3667 (2.7273)[/C][C]805632.13216[/C][/ROW]
[ROW][C]0.3833 (2.6087)[/C][C]518707.992395[/C][/ROW]
[ROW][C]0.4 (2.5)[/C][C]2039761.57901[/C][/ROW]
[ROW][C]0.4167 (2.4)[/C][C]5780055.323869[/C][/ROW]
[ROW][C]0.4333 (2.3077)[/C][C]1226642.68298[/C][/ROW]
[ROW][C]0.45 (2.2222)[/C][C]848781.489512[/C][/ROW]
[ROW][C]0.4667 (2.1429)[/C][C]98250.08084[/C][/ROW]
[ROW][C]0.4833 (2.069)[/C][C]839363.965606[/C][/ROW]
[ROW][C]0.5 (2)[/C][C]219176.491989[/C][/ROW]
[/TABLE]
Source: https://freestatistics.org/blog/index.php?pk=284274&T=1

Globally Unique Identifier (entire table): ba.freestatistics.org/blog/index.php?pk=284274&T=1

As an alternative you can also use a QR Code:  

The GUIDs for individual cells are displayed in the table below:

Raw Periodogram
ParameterValue
Box-Cox transformation parameter (lambda)1
Degree of non-seasonal differencing (d)0
Degree of seasonal differencing (D)0
Seasonal Period (s)12
Frequency (Period)Spectrum
0.0167 (60)4186513.416955
0.0333 (30)1219380.169013
0.05 (20)6077673.116123
0.0667 (15)31245593.100367
0.0833 (12)485592009.145208
0.1 (10)38277166.596574
0.1167 (8.5714)17981904.096872
0.1333 (7.5)4607293.284668
0.15 (6.6667)437260.017797
0.1667 (6)6039357.752681
0.1833 (5.4545)3597870.090301
0.2 (5)1839762.504227
0.2167 (4.6154)2877742.313703
0.2333 (4.2857)1312862.241606
0.25 (4)9359048.347077
0.2667 (3.75)3418573.634503
0.2833 (3.5294)437523.206179
0.3 (3.3333)2614984.7465
0.3167 (3.1579)4901872.470738
0.3333 (3)12836883.805994
0.35 (2.8571)405419.166028
0.3667 (2.7273)805632.13216
0.3833 (2.6087)518707.992395
0.4 (2.5)2039761.57901
0.4167 (2.4)5780055.323869
0.4333 (2.3077)1226642.68298
0.45 (2.2222)848781.489512
0.4667 (2.1429)98250.08084
0.4833 (2.069)839363.965606
0.5 (2)219176.491989


Parameters (Session):
par1 = Default ; par2 = 1 ; par3 = 1 ; par4 = 1 ; par5 = 12 ; par6 = White Noise ; par7 = 0.95 ;
Parameters (R input):
par1 = 1 ; par2 = 0 ; par3 = 0 ; par4 = 12 ;
R code (references can be found in the software module):
par1 <- as.numeric(par1)
par2 <- as.numeric(par2)
par3 <- as.numeric(par3)
par4 <- as.numeric(par4)
if (par1 == 0) {
x <- log(x)
} else {
x <- (x ^ par1 - 1) / par1
}
if (par2 > 0) x <- diff(x,lag=1,difference=par2)
if (par3 > 0) x <- diff(x,lag=par4,difference=par3)
bitmap(file='test1.png')
r <- spectrum(x,main='Raw Periodogram')
dev.off()
bitmap(file='test2.png')
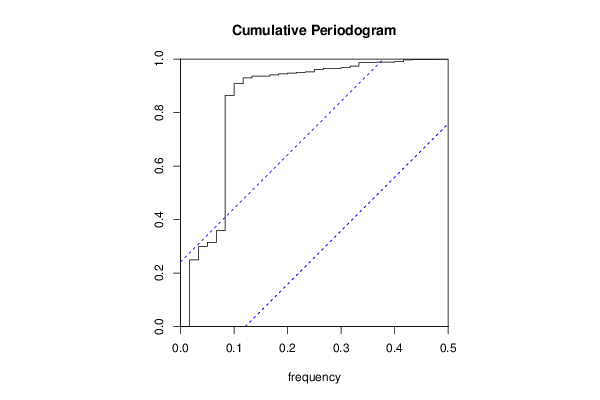
cpgram(x,main='Cumulative Periodogram')
dev.off()
load(file='createtable')
a<-table.start()
a<-table.row.start(a)
a<-table.element(a,'Raw Periodogram',2,TRUE)
a<-table.row.end(a)
a<-table.row.start(a)
a<-table.element(a,'Parameter',header=TRUE)
a<-table.element(a,'Value',header=TRUE)
a<-table.row.end(a)
a<-table.row.start(a)
a<-table.element(a,'Box-Cox transformation parameter (lambda)',header=TRUE)
a<-table.element(a,par1)
a<-table.row.end(a)
a<-table.row.start(a)
a<-table.element(a,'Degree of non-seasonal differencing (d)',header=TRUE)
a<-table.element(a,par2)
a<-table.row.end(a)
a<-table.row.start(a)
a<-table.element(a,'Degree of seasonal differencing (D)',header=TRUE)
a<-table.element(a,par3)
a<-table.row.end(a)
a<-table.row.start(a)
a<-table.element(a,'Seasonal Period (s)',header=TRUE)
a<-table.element(a,par4)
a<-table.row.end(a)
a<-table.row.start(a)
a<-table.element(a,'Frequency (Period)',header=TRUE)
a<-table.element(a,'Spectrum',header=TRUE)
a<-table.row.end(a)
for (i in 1:length(r$freq)) {
a<-table.row.start(a)
mylab <- round(r$freq[i],4)
mylab <- paste(mylab,' (',sep='')
mylab <- paste(mylab,round(1/r$freq[i],4),sep='')
mylab <- paste(mylab,')',sep='')
a<-table.element(a,mylab,header=TRUE)
a<-table.element(a,round(r$spec[i],6))
a<-table.row.end(a)
}
a<-table.end(a)
table.save(a,file='mytable.tab')