Free Statistics

of Irreproducible Research!

Author's title

Author*Unverified author*
R Software Modulerwasp_exponentialsmoothing.wasp
Title produced by softwareExponential Smoothing
Date of computationThu, 26 Nov 2015 17:29:37 +0000
Cite this page as followsStatistical Computations at FreeStatistics.org, Office for Research Development and Education, URL https://freestatistics.org/blog/index.php?v=date/2015/Nov/26/t14485590265r2iiqcl1ov6yqi.htm/, Retrieved Tue, 14 May 2024 09:02:51 +0000
Statistical Computations at FreeStatistics.org, Office for Research Development and Education, URL https://freestatistics.org/blog/index.php?pk=284263, Retrieved Tue, 14 May 2024 09:02:51 +0000
QR Codes:

Original text written by user:
IsPrivate?No (this computation is public)
User-defined keywords
Estimated Impact89
Family? (F = Feedback message, R = changed R code, M = changed R Module, P = changed Parameters, D = changed Data)
-     [Classical Decomposition] [Decompositie Werk...] [2015-11-26 14:27:06] [caeec4f3373338cbe0826e56549ed528]
- RMP     [Exponential Smoothing] [Exponential smoot...] [2015-11-26 17:29:37] [ad5e328aab07d5d247de986d4dfd18ff] [Current]
Feedback Forum

Post a new message
Dataseries X:
467
475
470
442
433
427
410
406
429
425
431
408
454
459
441
420
416
400
401
398
442
458
476
447
511
514
513
511
498
490
495
486
530
539
555
548
615
634
645
634
630
635
642
637
675
679
676
660
716
730
717
694
670
641
626
604
630
634
635
619


Summary of computational transaction
Raw Inputview raw input (R code)
Raw Outputview raw output of R engine
Computing time2 seconds
R Server'Sir Maurice George Kendall' @ kendall.wessa.net

\begin{tabular}{lllllllll}
\hline
Summary of computational transaction \tabularnewline
Raw Input & view raw input (R code)  \tabularnewline
Raw Output & view raw output of R engine  \tabularnewline
Computing time & 2 seconds \tabularnewline
R Server & 'Sir Maurice George Kendall' @ kendall.wessa.net \tabularnewline
\hline
\end{tabular}
%Source: https://freestatistics.org/blog/index.php?pk=284263&T=0

[TABLE]
[ROW][C]Summary of computational transaction[/C][/ROW]
[ROW][C]Raw Input[/C][C]view raw input (R code) [/C][/ROW]
[ROW][C]Raw Output[/C][C]view raw output of R engine [/C][/ROW]
[ROW][C]Computing time[/C][C]2 seconds[/C][/ROW]
[ROW][C]R Server[/C][C]'Sir Maurice George Kendall' @ kendall.wessa.net[/C][/ROW]
[/TABLE]
Source: https://freestatistics.org/blog/index.php?pk=284263&T=0

Globally Unique Identifier (entire table): ba.freestatistics.org/blog/index.php?pk=284263&T=0

As an alternative you can also use a QR Code:  

The GUIDs for individual cells are displayed in the table below:

Summary of computational transaction
Raw Inputview raw input (R code)
Raw Outputview raw output of R engine
Computing time2 seconds
R Server'Sir Maurice George Kendall' @ kendall.wessa.net


Estimated Parameters of Exponential Smoothing
ParameterValue
alpha0.809222856365867
beta0.508101619219372
gamma1

\begin{tabular}{lllllllll}
\hline
Estimated Parameters of Exponential Smoothing \tabularnewline
Parameter & Value \tabularnewline
alpha & 0.809222856365867 \tabularnewline
beta & 0.508101619219372 \tabularnewline
gamma & 1 \tabularnewline
\hline
\end{tabular}
%Source: https://freestatistics.org/blog/index.php?pk=284263&T=1

[TABLE]
[ROW][C]Estimated Parameters of Exponential Smoothing[/C][/ROW]
[ROW][C]Parameter[/C][C]Value[/C][/ROW]
[ROW][C]alpha[/C][C]0.809222856365867[/C][/ROW]
[ROW][C]beta[/C][C]0.508101619219372[/C][/ROW]
[ROW][C]gamma[/C][C]1[/C][/ROW]
[/TABLE]
Source: https://freestatistics.org/blog/index.php?pk=284263&T=1

Globally Unique Identifier (entire table): ba.freestatistics.org/blog/index.php?pk=284263&T=1

As an alternative you can also use a QR Code:  

The GUIDs for individual cells are displayed in the table below:

Estimated Parameters of Exponential Smoothing
ParameterValue
alpha0.809222856365867
beta0.508101619219372
gamma1


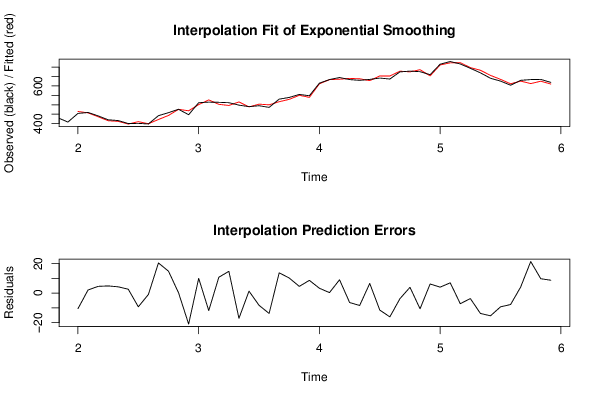
Interpolation Forecasts of Exponential Smoothing
tObservedFittedResiduals
13454464.514155982906-10.5141559829061
14459456.8973799108342.10262008916584
15441436.4382496702514.56175032974886
16420415.1364137153514.8635862846491
17416411.7452453202234.25475467977697
18400397.3608130797062.63918692029381
19401410.254174221484-9.25417422148371
20398398.926473864111-0.926473864111188
21442421.62346975326220.3765302467379
22458443.18750932974514.8124906702554
23476475.8394148298780.160585170122147
24447467.909024237208-20.9090242372077
25511500.99232011356310.0076798864366
26514525.830138246212-11.8301382462117
27513502.27761378784410.7223862121556
28511496.26390794325714.736092056743
29498515.050118017702-17.0501180177023
30490488.6616846957811.33831530421912
31495503.243095528787-8.24309552878742
32486499.747766890725-13.747766890725
33530516.28735625627613.7126437437239
34539528.81111237335310.1888876266474
35555550.4389462764584.56105372354239
36548539.3719472663318.62805273366928
37615611.7222376220453.27776237795479
38634633.6474893220270.352510677973441
39645635.9646508400839.03534915991668
40634640.366526495616-6.36652649561597
41630638.350270325227-8.35027032522726
42635628.4254769055596.57452309444113
43642653.48462226134-11.4846222613402
44637653.051590051574-16.0515900515738
45675678.754014111456-3.7540141114564
46679675.077700631123.92229936887964
47676686.590790223704-10.5907902237043
48660653.8385025036196.16149749638055
49716711.9579589355974.04204106440272
50730723.0437298297226.95627017027834
51717724.176661076076-7.17666107607624
52694697.670600336978-3.67060033697794
53670683.71549199872-13.7154919987205
54641656.348339296335-15.3483392963353
55626635.259755141855-9.25975514185484
56604611.708680094163-7.70868009416347
57630625.8916238579794.10837614202126
58634612.65811020349321.3418897965073
59635625.2770419737039.72295802629674
60619610.2896864078668.71031359213362

\begin{tabular}{lllllllll}
\hline
Interpolation Forecasts of Exponential Smoothing \tabularnewline
t & Observed & Fitted & Residuals \tabularnewline
13 & 454 & 464.514155982906 & -10.5141559829061 \tabularnewline
14 & 459 & 456.897379910834 & 2.10262008916584 \tabularnewline
15 & 441 & 436.438249670251 & 4.56175032974886 \tabularnewline
16 & 420 & 415.136413715351 & 4.8635862846491 \tabularnewline
17 & 416 & 411.745245320223 & 4.25475467977697 \tabularnewline
18 & 400 & 397.360813079706 & 2.63918692029381 \tabularnewline
19 & 401 & 410.254174221484 & -9.25417422148371 \tabularnewline
20 & 398 & 398.926473864111 & -0.926473864111188 \tabularnewline
21 & 442 & 421.623469753262 & 20.3765302467379 \tabularnewline
22 & 458 & 443.187509329745 & 14.8124906702554 \tabularnewline
23 & 476 & 475.839414829878 & 0.160585170122147 \tabularnewline
24 & 447 & 467.909024237208 & -20.9090242372077 \tabularnewline
25 & 511 & 500.992320113563 & 10.0076798864366 \tabularnewline
26 & 514 & 525.830138246212 & -11.8301382462117 \tabularnewline
27 & 513 & 502.277613787844 & 10.7223862121556 \tabularnewline
28 & 511 & 496.263907943257 & 14.736092056743 \tabularnewline
29 & 498 & 515.050118017702 & -17.0501180177023 \tabularnewline
30 & 490 & 488.661684695781 & 1.33831530421912 \tabularnewline
31 & 495 & 503.243095528787 & -8.24309552878742 \tabularnewline
32 & 486 & 499.747766890725 & -13.747766890725 \tabularnewline
33 & 530 & 516.287356256276 & 13.7126437437239 \tabularnewline
34 & 539 & 528.811112373353 & 10.1888876266474 \tabularnewline
35 & 555 & 550.438946276458 & 4.56105372354239 \tabularnewline
36 & 548 & 539.371947266331 & 8.62805273366928 \tabularnewline
37 & 615 & 611.722237622045 & 3.27776237795479 \tabularnewline
38 & 634 & 633.647489322027 & 0.352510677973441 \tabularnewline
39 & 645 & 635.964650840083 & 9.03534915991668 \tabularnewline
40 & 634 & 640.366526495616 & -6.36652649561597 \tabularnewline
41 & 630 & 638.350270325227 & -8.35027032522726 \tabularnewline
42 & 635 & 628.425476905559 & 6.57452309444113 \tabularnewline
43 & 642 & 653.48462226134 & -11.4846222613402 \tabularnewline
44 & 637 & 653.051590051574 & -16.0515900515738 \tabularnewline
45 & 675 & 678.754014111456 & -3.7540141114564 \tabularnewline
46 & 679 & 675.07770063112 & 3.92229936887964 \tabularnewline
47 & 676 & 686.590790223704 & -10.5907902237043 \tabularnewline
48 & 660 & 653.838502503619 & 6.16149749638055 \tabularnewline
49 & 716 & 711.957958935597 & 4.04204106440272 \tabularnewline
50 & 730 & 723.043729829722 & 6.95627017027834 \tabularnewline
51 & 717 & 724.176661076076 & -7.17666107607624 \tabularnewline
52 & 694 & 697.670600336978 & -3.67060033697794 \tabularnewline
53 & 670 & 683.71549199872 & -13.7154919987205 \tabularnewline
54 & 641 & 656.348339296335 & -15.3483392963353 \tabularnewline
55 & 626 & 635.259755141855 & -9.25975514185484 \tabularnewline
56 & 604 & 611.708680094163 & -7.70868009416347 \tabularnewline
57 & 630 & 625.891623857979 & 4.10837614202126 \tabularnewline
58 & 634 & 612.658110203493 & 21.3418897965073 \tabularnewline
59 & 635 & 625.277041973703 & 9.72295802629674 \tabularnewline
60 & 619 & 610.289686407866 & 8.71031359213362 \tabularnewline
\hline
\end{tabular}
%Source: https://freestatistics.org/blog/index.php?pk=284263&T=2

[TABLE]
[ROW][C]Interpolation Forecasts of Exponential Smoothing[/C][/ROW]
[ROW][C]t[/C][C]Observed[/C][C]Fitted[/C][C]Residuals[/C][/ROW]
[ROW][C]13[/C][C]454[/C][C]464.514155982906[/C][C]-10.5141559829061[/C][/ROW]
[ROW][C]14[/C][C]459[/C][C]456.897379910834[/C][C]2.10262008916584[/C][/ROW]
[ROW][C]15[/C][C]441[/C][C]436.438249670251[/C][C]4.56175032974886[/C][/ROW]
[ROW][C]16[/C][C]420[/C][C]415.136413715351[/C][C]4.8635862846491[/C][/ROW]
[ROW][C]17[/C][C]416[/C][C]411.745245320223[/C][C]4.25475467977697[/C][/ROW]
[ROW][C]18[/C][C]400[/C][C]397.360813079706[/C][C]2.63918692029381[/C][/ROW]
[ROW][C]19[/C][C]401[/C][C]410.254174221484[/C][C]-9.25417422148371[/C][/ROW]
[ROW][C]20[/C][C]398[/C][C]398.926473864111[/C][C]-0.926473864111188[/C][/ROW]
[ROW][C]21[/C][C]442[/C][C]421.623469753262[/C][C]20.3765302467379[/C][/ROW]
[ROW][C]22[/C][C]458[/C][C]443.187509329745[/C][C]14.8124906702554[/C][/ROW]
[ROW][C]23[/C][C]476[/C][C]475.839414829878[/C][C]0.160585170122147[/C][/ROW]
[ROW][C]24[/C][C]447[/C][C]467.909024237208[/C][C]-20.9090242372077[/C][/ROW]
[ROW][C]25[/C][C]511[/C][C]500.992320113563[/C][C]10.0076798864366[/C][/ROW]
[ROW][C]26[/C][C]514[/C][C]525.830138246212[/C][C]-11.8301382462117[/C][/ROW]
[ROW][C]27[/C][C]513[/C][C]502.277613787844[/C][C]10.7223862121556[/C][/ROW]
[ROW][C]28[/C][C]511[/C][C]496.263907943257[/C][C]14.736092056743[/C][/ROW]
[ROW][C]29[/C][C]498[/C][C]515.050118017702[/C][C]-17.0501180177023[/C][/ROW]
[ROW][C]30[/C][C]490[/C][C]488.661684695781[/C][C]1.33831530421912[/C][/ROW]
[ROW][C]31[/C][C]495[/C][C]503.243095528787[/C][C]-8.24309552878742[/C][/ROW]
[ROW][C]32[/C][C]486[/C][C]499.747766890725[/C][C]-13.747766890725[/C][/ROW]
[ROW][C]33[/C][C]530[/C][C]516.287356256276[/C][C]13.7126437437239[/C][/ROW]
[ROW][C]34[/C][C]539[/C][C]528.811112373353[/C][C]10.1888876266474[/C][/ROW]
[ROW][C]35[/C][C]555[/C][C]550.438946276458[/C][C]4.56105372354239[/C][/ROW]
[ROW][C]36[/C][C]548[/C][C]539.371947266331[/C][C]8.62805273366928[/C][/ROW]
[ROW][C]37[/C][C]615[/C][C]611.722237622045[/C][C]3.27776237795479[/C][/ROW]
[ROW][C]38[/C][C]634[/C][C]633.647489322027[/C][C]0.352510677973441[/C][/ROW]
[ROW][C]39[/C][C]645[/C][C]635.964650840083[/C][C]9.03534915991668[/C][/ROW]
[ROW][C]40[/C][C]634[/C][C]640.366526495616[/C][C]-6.36652649561597[/C][/ROW]
[ROW][C]41[/C][C]630[/C][C]638.350270325227[/C][C]-8.35027032522726[/C][/ROW]
[ROW][C]42[/C][C]635[/C][C]628.425476905559[/C][C]6.57452309444113[/C][/ROW]
[ROW][C]43[/C][C]642[/C][C]653.48462226134[/C][C]-11.4846222613402[/C][/ROW]
[ROW][C]44[/C][C]637[/C][C]653.051590051574[/C][C]-16.0515900515738[/C][/ROW]
[ROW][C]45[/C][C]675[/C][C]678.754014111456[/C][C]-3.7540141114564[/C][/ROW]
[ROW][C]46[/C][C]679[/C][C]675.07770063112[/C][C]3.92229936887964[/C][/ROW]
[ROW][C]47[/C][C]676[/C][C]686.590790223704[/C][C]-10.5907902237043[/C][/ROW]
[ROW][C]48[/C][C]660[/C][C]653.838502503619[/C][C]6.16149749638055[/C][/ROW]
[ROW][C]49[/C][C]716[/C][C]711.957958935597[/C][C]4.04204106440272[/C][/ROW]
[ROW][C]50[/C][C]730[/C][C]723.043729829722[/C][C]6.95627017027834[/C][/ROW]
[ROW][C]51[/C][C]717[/C][C]724.176661076076[/C][C]-7.17666107607624[/C][/ROW]
[ROW][C]52[/C][C]694[/C][C]697.670600336978[/C][C]-3.67060033697794[/C][/ROW]
[ROW][C]53[/C][C]670[/C][C]683.71549199872[/C][C]-13.7154919987205[/C][/ROW]
[ROW][C]54[/C][C]641[/C][C]656.348339296335[/C][C]-15.3483392963353[/C][/ROW]
[ROW][C]55[/C][C]626[/C][C]635.259755141855[/C][C]-9.25975514185484[/C][/ROW]
[ROW][C]56[/C][C]604[/C][C]611.708680094163[/C][C]-7.70868009416347[/C][/ROW]
[ROW][C]57[/C][C]630[/C][C]625.891623857979[/C][C]4.10837614202126[/C][/ROW]
[ROW][C]58[/C][C]634[/C][C]612.658110203493[/C][C]21.3418897965073[/C][/ROW]
[ROW][C]59[/C][C]635[/C][C]625.277041973703[/C][C]9.72295802629674[/C][/ROW]
[ROW][C]60[/C][C]619[/C][C]610.289686407866[/C][C]8.71031359213362[/C][/ROW]
[/TABLE]
Source: https://freestatistics.org/blog/index.php?pk=284263&T=2

Globally Unique Identifier (entire table): ba.freestatistics.org/blog/index.php?pk=284263&T=2

As an alternative you can also use a QR Code:  

The GUIDs for individual cells are displayed in the table below:

Interpolation Forecasts of Exponential Smoothing
tObservedFittedResiduals
13454464.514155982906-10.5141559829061
14459456.8973799108342.10262008916584
15441436.4382496702514.56175032974886
16420415.1364137153514.8635862846491
17416411.7452453202234.25475467977697
18400397.3608130797062.63918692029381
19401410.254174221484-9.25417422148371
20398398.926473864111-0.926473864111188
21442421.62346975326220.3765302467379
22458443.18750932974514.8124906702554
23476475.8394148298780.160585170122147
24447467.909024237208-20.9090242372077
25511500.99232011356310.0076798864366
26514525.830138246212-11.8301382462117
27513502.27761378784410.7223862121556
28511496.26390794325714.736092056743
29498515.050118017702-17.0501180177023
30490488.6616846957811.33831530421912
31495503.243095528787-8.24309552878742
32486499.747766890725-13.747766890725
33530516.28735625627613.7126437437239
34539528.81111237335310.1888876266474
35555550.4389462764584.56105372354239
36548539.3719472663318.62805273366928
37615611.7222376220453.27776237795479
38634633.6474893220270.352510677973441
39645635.9646508400839.03534915991668
40634640.366526495616-6.36652649561597
41630638.350270325227-8.35027032522726
42635628.4254769055596.57452309444113
43642653.48462226134-11.4846222613402
44637653.051590051574-16.0515900515738
45675678.754014111456-3.7540141114564
46679675.077700631123.92229936887964
47676686.590790223704-10.5907902237043
48660653.8385025036196.16149749638055
49716711.9579589355974.04204106440272
50730723.0437298297226.95627017027834
51717724.176661076076-7.17666107607624
52694697.670600336978-3.67060033697794
53670683.71549199872-13.7154919987205
54641656.348339296335-15.3483392963353
55626635.259755141855-9.25975514185484
56604611.708680094163-7.70868009416347
57630625.8916238579794.10837614202126
58634612.65811020349321.3418897965073
59635625.2770419737039.72295802629674
60619610.2896864078668.71031359213362


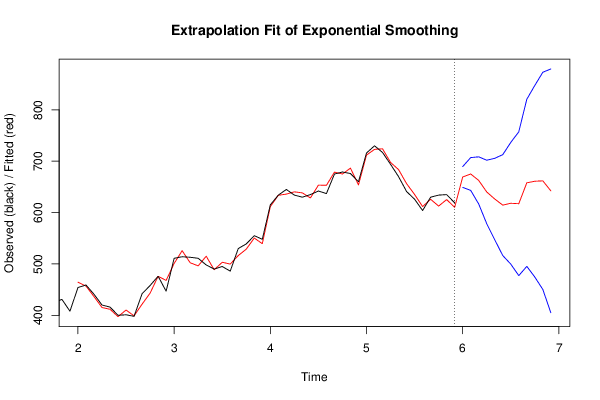
Extrapolation Forecasts of Exponential Smoothing
tForecast95% Lower Bound95% Upper Bound
61669.245978606732649.015679087256689.476278126208
62675.133469468074643.21474626497707.052192671178
63662.597459498309616.681662001347708.513256995272
64640.1750744311578.401201944391701.948946917808
65626.390476643429547.141267976455705.639685310404
66614.56657999317516.383499406166712.749660580174
67618.126399314619499.666145911207736.586652718032
68617.238363105844477.247078949863757.229647261825
69657.957253183856495.253593360135820.660913007577
70661.041159601384474.504366784692847.577952418077
71661.752280904085450.313349533077873.191212275092
72642.285093432099404.919973012691879.650213851507

\begin{tabular}{lllllllll}
\hline
Extrapolation Forecasts of Exponential Smoothing \tabularnewline
t & Forecast & 95% Lower Bound & 95% Upper Bound \tabularnewline
61 & 669.245978606732 & 649.015679087256 & 689.476278126208 \tabularnewline
62 & 675.133469468074 & 643.21474626497 & 707.052192671178 \tabularnewline
63 & 662.597459498309 & 616.681662001347 & 708.513256995272 \tabularnewline
64 & 640.1750744311 & 578.401201944391 & 701.948946917808 \tabularnewline
65 & 626.390476643429 & 547.141267976455 & 705.639685310404 \tabularnewline
66 & 614.56657999317 & 516.383499406166 & 712.749660580174 \tabularnewline
67 & 618.126399314619 & 499.666145911207 & 736.586652718032 \tabularnewline
68 & 617.238363105844 & 477.247078949863 & 757.229647261825 \tabularnewline
69 & 657.957253183856 & 495.253593360135 & 820.660913007577 \tabularnewline
70 & 661.041159601384 & 474.504366784692 & 847.577952418077 \tabularnewline
71 & 661.752280904085 & 450.313349533077 & 873.191212275092 \tabularnewline
72 & 642.285093432099 & 404.919973012691 & 879.650213851507 \tabularnewline
\hline
\end{tabular}
%Source: https://freestatistics.org/blog/index.php?pk=284263&T=3

[TABLE]
[ROW][C]Extrapolation Forecasts of Exponential Smoothing[/C][/ROW]
[ROW][C]t[/C][C]Forecast[/C][C]95% Lower Bound[/C][C]95% Upper Bound[/C][/ROW]
[ROW][C]61[/C][C]669.245978606732[/C][C]649.015679087256[/C][C]689.476278126208[/C][/ROW]
[ROW][C]62[/C][C]675.133469468074[/C][C]643.21474626497[/C][C]707.052192671178[/C][/ROW]
[ROW][C]63[/C][C]662.597459498309[/C][C]616.681662001347[/C][C]708.513256995272[/C][/ROW]
[ROW][C]64[/C][C]640.1750744311[/C][C]578.401201944391[/C][C]701.948946917808[/C][/ROW]
[ROW][C]65[/C][C]626.390476643429[/C][C]547.141267976455[/C][C]705.639685310404[/C][/ROW]
[ROW][C]66[/C][C]614.56657999317[/C][C]516.383499406166[/C][C]712.749660580174[/C][/ROW]
[ROW][C]67[/C][C]618.126399314619[/C][C]499.666145911207[/C][C]736.586652718032[/C][/ROW]
[ROW][C]68[/C][C]617.238363105844[/C][C]477.247078949863[/C][C]757.229647261825[/C][/ROW]
[ROW][C]69[/C][C]657.957253183856[/C][C]495.253593360135[/C][C]820.660913007577[/C][/ROW]
[ROW][C]70[/C][C]661.041159601384[/C][C]474.504366784692[/C][C]847.577952418077[/C][/ROW]
[ROW][C]71[/C][C]661.752280904085[/C][C]450.313349533077[/C][C]873.191212275092[/C][/ROW]
[ROW][C]72[/C][C]642.285093432099[/C][C]404.919973012691[/C][C]879.650213851507[/C][/ROW]
[/TABLE]
Source: https://freestatistics.org/blog/index.php?pk=284263&T=3

Globally Unique Identifier (entire table): ba.freestatistics.org/blog/index.php?pk=284263&T=3

As an alternative you can also use a QR Code:  

The GUIDs for individual cells are displayed in the table below:

Extrapolation Forecasts of Exponential Smoothing
tForecast95% Lower Bound95% Upper Bound
61669.245978606732649.015679087256689.476278126208
62675.133469468074643.21474626497707.052192671178
63662.597459498309616.681662001347708.513256995272
64640.1750744311578.401201944391701.948946917808
65626.390476643429547.141267976455705.639685310404
66614.56657999317516.383499406166712.749660580174
67618.126399314619499.666145911207736.586652718032
68617.238363105844477.247078949863757.229647261825
69657.957253183856495.253593360135820.660913007577
70661.041159601384474.504366784692847.577952418077
71661.752280904085450.313349533077873.191212275092
72642.285093432099404.919973012691879.650213851507


Parameters (Session):
par1 = 12 ; par2 = Triple ; par3 = additive ;
Parameters (R input):
par1 = 12 ; par2 = Triple ; par3 = additive ;
R code (references can be found in the software module):
par1 <- as.numeric(par1)
if (par2 == 'Single') K <- 1
if (par2 == 'Double') K <- 2
if (par2 == 'Triple') K <- par1
nx <- length(x)
nxmK <- nx - K
x <- ts(x, frequency = par1)
if (par2 == 'Single') fit <- HoltWinters(x, gamma=F, beta=F)
if (par2 == 'Double') fit <- HoltWinters(x, gamma=F)
if (par2 == 'Triple') fit <- HoltWinters(x, seasonal=par3)
fit
myresid <- x - fit$fitted[,'xhat']
bitmap(file='test1.png')
op <- par(mfrow=c(2,1))
plot(fit,ylab='Observed (black) / Fitted (red)',main='Interpolation Fit of Exponential Smoothing')
plot(myresid,ylab='Residuals',main='Interpolation Prediction Errors')
par(op)
dev.off()
bitmap(file='test2.png')
p <- predict(fit, par1, prediction.interval=TRUE)
np <- length(p[,1])
plot(fit,p,ylab='Observed (black) / Fitted (red)',main='Extrapolation Fit of Exponential Smoothing')
dev.off()
bitmap(file='test3.png')
op <- par(mfrow = c(2,2))
acf(as.numeric(myresid),lag.max = nx/2,main='Residual ACF')
spectrum(myresid,main='Residals Periodogram')
cpgram(myresid,main='Residal Cumulative Periodogram')
qqnorm(myresid,main='Residual Normal QQ Plot')
qqline(myresid)
par(op)
dev.off()
load(file='createtable')
a<-table.start()
a<-table.row.start(a)
a<-table.element(a,'Estimated Parameters of Exponential Smoothing',2,TRUE)
a<-table.row.end(a)
a<-table.row.start(a)
a<-table.element(a,'Parameter',header=TRUE)
a<-table.element(a,'Value',header=TRUE)
a<-table.row.end(a)
a<-table.row.start(a)
a<-table.element(a,'alpha',header=TRUE)
a<-table.element(a,fit$alpha)
a<-table.row.end(a)
a<-table.row.start(a)
a<-table.element(a,'beta',header=TRUE)
a<-table.element(a,fit$beta)
a<-table.row.end(a)
a<-table.row.start(a)
a<-table.element(a,'gamma',header=TRUE)
a<-table.element(a,fit$gamma)
a<-table.row.end(a)
a<-table.end(a)
table.save(a,file='mytable.tab')
a<-table.start()
a<-table.row.start(a)
a<-table.element(a,'Interpolation Forecasts of Exponential Smoothing',4,TRUE)
a<-table.row.end(a)
a<-table.row.start(a)
a<-table.element(a,'t',header=TRUE)
a<-table.element(a,'Observed',header=TRUE)
a<-table.element(a,'Fitted',header=TRUE)
a<-table.element(a,'Residuals',header=TRUE)
a<-table.row.end(a)
for (i in 1:nxmK) {
a<-table.row.start(a)
a<-table.element(a,i+K,header=TRUE)
a<-table.element(a,x[i+K])
a<-table.element(a,fit$fitted[i,'xhat'])
a<-table.element(a,myresid[i])
a<-table.row.end(a)
}
a<-table.end(a)
table.save(a,file='mytable1.tab')
a<-table.start()
a<-table.row.start(a)
a<-table.element(a,'Extrapolation Forecasts of Exponential Smoothing',4,TRUE)
a<-table.row.end(a)
a<-table.row.start(a)
a<-table.element(a,'t',header=TRUE)
a<-table.element(a,'Forecast',header=TRUE)
a<-table.element(a,'95% Lower Bound',header=TRUE)
a<-table.element(a,'95% Upper Bound',header=TRUE)
a<-table.row.end(a)
for (i in 1:np) {
a<-table.row.start(a)
a<-table.element(a,nx+i,header=TRUE)
a<-table.element(a,p[i,'fit'])
a<-table.element(a,p[i,'lwr'])
a<-table.element(a,p[i,'upr'])
a<-table.row.end(a)
}
a<-table.end(a)
table.save(a,file='mytable2.tab')