Free Statistics

of Irreproducible Research!

Author's title

Author*Unverified author*
R Software Modulerwasp_exponentialsmoothing.wasp
Title produced by softwareExponential Smoothing
Date of computationThu, 26 Nov 2015 16:36:27 +0000
Cite this page as followsStatistical Computations at FreeStatistics.org, Office for Research Development and Education, URL https://freestatistics.org/blog/index.php?v=date/2015/Nov/26/t1448555823aom6nwwk0w46yjw.htm/, Retrieved Tue, 14 May 2024 19:04:06 +0000
Statistical Computations at FreeStatistics.org, Office for Research Development and Education, URL https://freestatistics.org/blog/index.php?pk=284258, Retrieved Tue, 14 May 2024 19:04:06 +0000
QR Codes:

Original text written by user:
IsPrivate?No (this computation is public)
User-defined keywords
Estimated Impact129
Family? (F = Feedback message, R = changed R code, M = changed R Module, P = changed Parameters, D = changed Data)
-       [Exponential Smoothing] [exponential smoot...] [2015-11-26 16:36:27] [31d3819645a417a2d8d176ca2e093c99] [Current]
Feedback Forum

Post a new message
Dataseries X:
790
766
1040
949
758
1023
921
775
907
835
871
836
789
811
996
778
603
990
735
800
706
766
870
647
726
784
884
696
893
674
703
799
793
799
1022
758
1021
944
915
864
1022
891
1087
822
890
1092
967
833
1104
1063
1103
1039
1185
1047
1155
878
879
1133
920
943
938
900
781
1040
792
653
866
679
799
760
699
762


Summary of computational transaction
Raw Inputview raw input (R code)
Raw Outputview raw output of R engine
Computing time1 seconds
R Server'Sir Ronald Aylmer Fisher' @ fisher.wessa.net

\begin{tabular}{lllllllll}
\hline
Summary of computational transaction \tabularnewline
Raw Input & view raw input (R code)  \tabularnewline
Raw Output & view raw output of R engine  \tabularnewline
Computing time & 1 seconds \tabularnewline
R Server & 'Sir Ronald Aylmer Fisher' @ fisher.wessa.net \tabularnewline
\hline
\end{tabular}
%Source: https://freestatistics.org/blog/index.php?pk=284258&T=0

[TABLE]
[ROW][C]Summary of computational transaction[/C][/ROW]
[ROW][C]Raw Input[/C][C]view raw input (R code) [/C][/ROW]
[ROW][C]Raw Output[/C][C]view raw output of R engine [/C][/ROW]
[ROW][C]Computing time[/C][C]1 seconds[/C][/ROW]
[ROW][C]R Server[/C][C]'Sir Ronald Aylmer Fisher' @ fisher.wessa.net[/C][/ROW]
[/TABLE]
Source: https://freestatistics.org/blog/index.php?pk=284258&T=0

Globally Unique Identifier (entire table): ba.freestatistics.org/blog/index.php?pk=284258&T=0

As an alternative you can also use a QR Code:  

The GUIDs for individual cells are displayed in the table below:

Summary of computational transaction
Raw Inputview raw input (R code)
Raw Outputview raw output of R engine
Computing time1 seconds
R Server'Sir Ronald Aylmer Fisher' @ fisher.wessa.net


Estimated Parameters of Exponential Smoothing
ParameterValue
alpha0.243097251796176
beta0
gamma0.789744024169352

\begin{tabular}{lllllllll}
\hline
Estimated Parameters of Exponential Smoothing \tabularnewline
Parameter & Value \tabularnewline
alpha & 0.243097251796176 \tabularnewline
beta & 0 \tabularnewline
gamma & 0.789744024169352 \tabularnewline
\hline
\end{tabular}
%Source: https://freestatistics.org/blog/index.php?pk=284258&T=1

[TABLE]
[ROW][C]Estimated Parameters of Exponential Smoothing[/C][/ROW]
[ROW][C]Parameter[/C][C]Value[/C][/ROW]
[ROW][C]alpha[/C][C]0.243097251796176[/C][/ROW]
[ROW][C]beta[/C][C]0[/C][/ROW]
[ROW][C]gamma[/C][C]0.789744024169352[/C][/ROW]
[/TABLE]
Source: https://freestatistics.org/blog/index.php?pk=284258&T=1

Globally Unique Identifier (entire table): ba.freestatistics.org/blog/index.php?pk=284258&T=1

As an alternative you can also use a QR Code:  

The GUIDs for individual cells are displayed in the table below:

Estimated Parameters of Exponential Smoothing
ParameterValue
alpha0.243097251796176
beta0
gamma0.789744024169352


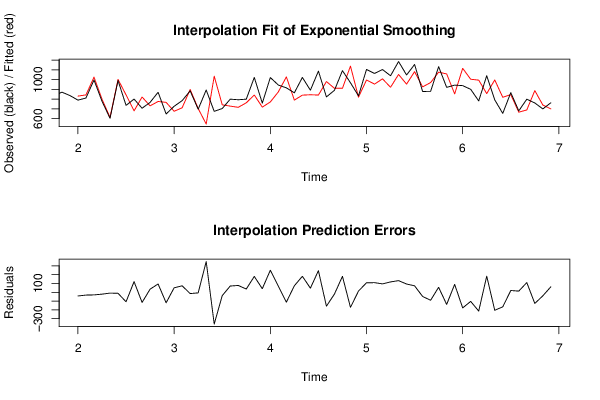
Interpolation Forecasts of Exponential Smoothing
tObservedFittedResiduals
13789830.584730051405-41.5847300514048
14811842.757228470835-31.7572284708347
159961025.47916410276-29.4791641027641
16778799.19352000869-21.1935200086905
17603611.988890143471-8.98889014347083
189901001.69252734166-11.6925273416591
19735842.685688202096-107.685688202096
20800678.908871024397121.091128975603
21706821.08633767568-115.08633767568
22766730.3901928036535.6098071963496
23870775.44737567757694.5526243224241
24647765.948814057358-118.948814057358
25726674.94406007443451.0559399255661
26784710.54117267785573.4588273221449
27884898.518201882641-14.5182018826412
28696702.613554853225-6.61355485322542
29893543.62785127942349.37214872058
306741034.76349361734-360.763493617337
31703740.858882346672-37.8588823466717
32799727.70536908236271.2946309176384
33793715.2559169156177.7440830843896
34799761.73762697827537.2623730217246
351022841.880714202248180.119285797752
36758717.16280585583640.837194144164
371021770.319331287655250.680668712345
38944873.58228991394370.4177100860572
399151027.58113475967-112.581134759665
40864789.35349846265674.6465015373443
411022840.192601476244181.807398523756
42891844.39152203731446.6084779626857
431087841.177920478521245.822079521479
44822979.685905983722-157.685905983722
45890910.429086729255-20.429086729255
461092910.323095821177181.676904178823
479671138.30526826974-171.305268269745
48833819.07350804748513.9264919525154
491104995.836069587564108.163930412436
501063953.457950834012109.542049165988
5111031007.4611406505195.5388593494863
521039921.055685281173117.944314718827
5311851052.4687865505132.531213449503
541047953.0098700739693.9901299260396
5511551081.4173017126773.5826982873305
56878925.200421178682-47.2004211786821
57879969.390705513761-90.3907055137612
5811331075.9020076845457.0979923154568
599201058.1443680503-138.144368050301
60943852.79349496020390.2065050397965
619381115.31026111251-177.310261112511
629001003.39757035325-103.397570353251
63781994.270354002263-213.270354002263
641040856.123915281063183.876084718937
65792996.105689013427-204.105689013427
66653818.133787928535-165.133787928535
67866845.70072299637420.2992770036255
68679665.36706560739913.6329343926005
69799688.533335978941110.466664021059
70760886.74963038836-126.74963038836
71699739.049207462286-40.0492074622864
72762699.26150677526362.7384932247371

\begin{tabular}{lllllllll}
\hline
Interpolation Forecasts of Exponential Smoothing \tabularnewline
t & Observed & Fitted & Residuals \tabularnewline
13 & 789 & 830.584730051405 & -41.5847300514048 \tabularnewline
14 & 811 & 842.757228470835 & -31.7572284708347 \tabularnewline
15 & 996 & 1025.47916410276 & -29.4791641027641 \tabularnewline
16 & 778 & 799.19352000869 & -21.1935200086905 \tabularnewline
17 & 603 & 611.988890143471 & -8.98889014347083 \tabularnewline
18 & 990 & 1001.69252734166 & -11.6925273416591 \tabularnewline
19 & 735 & 842.685688202096 & -107.685688202096 \tabularnewline
20 & 800 & 678.908871024397 & 121.091128975603 \tabularnewline
21 & 706 & 821.08633767568 & -115.08633767568 \tabularnewline
22 & 766 & 730.39019280365 & 35.6098071963496 \tabularnewline
23 & 870 & 775.447375677576 & 94.5526243224241 \tabularnewline
24 & 647 & 765.948814057358 & -118.948814057358 \tabularnewline
25 & 726 & 674.944060074434 & 51.0559399255661 \tabularnewline
26 & 784 & 710.541172677855 & 73.4588273221449 \tabularnewline
27 & 884 & 898.518201882641 & -14.5182018826412 \tabularnewline
28 & 696 & 702.613554853225 & -6.61355485322542 \tabularnewline
29 & 893 & 543.62785127942 & 349.37214872058 \tabularnewline
30 & 674 & 1034.76349361734 & -360.763493617337 \tabularnewline
31 & 703 & 740.858882346672 & -37.8588823466717 \tabularnewline
32 & 799 & 727.705369082362 & 71.2946309176384 \tabularnewline
33 & 793 & 715.25591691561 & 77.7440830843896 \tabularnewline
34 & 799 & 761.737626978275 & 37.2623730217246 \tabularnewline
35 & 1022 & 841.880714202248 & 180.119285797752 \tabularnewline
36 & 758 & 717.162805855836 & 40.837194144164 \tabularnewline
37 & 1021 & 770.319331287655 & 250.680668712345 \tabularnewline
38 & 944 & 873.582289913943 & 70.4177100860572 \tabularnewline
39 & 915 & 1027.58113475967 & -112.581134759665 \tabularnewline
40 & 864 & 789.353498462656 & 74.6465015373443 \tabularnewline
41 & 1022 & 840.192601476244 & 181.807398523756 \tabularnewline
42 & 891 & 844.391522037314 & 46.6084779626857 \tabularnewline
43 & 1087 & 841.177920478521 & 245.822079521479 \tabularnewline
44 & 822 & 979.685905983722 & -157.685905983722 \tabularnewline
45 & 890 & 910.429086729255 & -20.429086729255 \tabularnewline
46 & 1092 & 910.323095821177 & 181.676904178823 \tabularnewline
47 & 967 & 1138.30526826974 & -171.305268269745 \tabularnewline
48 & 833 & 819.073508047485 & 13.9264919525154 \tabularnewline
49 & 1104 & 995.836069587564 & 108.163930412436 \tabularnewline
50 & 1063 & 953.457950834012 & 109.542049165988 \tabularnewline
51 & 1103 & 1007.46114065051 & 95.5388593494863 \tabularnewline
52 & 1039 & 921.055685281173 & 117.944314718827 \tabularnewline
53 & 1185 & 1052.4687865505 & 132.531213449503 \tabularnewline
54 & 1047 & 953.00987007396 & 93.9901299260396 \tabularnewline
55 & 1155 & 1081.41730171267 & 73.5826982873305 \tabularnewline
56 & 878 & 925.200421178682 & -47.2004211786821 \tabularnewline
57 & 879 & 969.390705513761 & -90.3907055137612 \tabularnewline
58 & 1133 & 1075.90200768454 & 57.0979923154568 \tabularnewline
59 & 920 & 1058.1443680503 & -138.144368050301 \tabularnewline
60 & 943 & 852.793494960203 & 90.2065050397965 \tabularnewline
61 & 938 & 1115.31026111251 & -177.310261112511 \tabularnewline
62 & 900 & 1003.39757035325 & -103.397570353251 \tabularnewline
63 & 781 & 994.270354002263 & -213.270354002263 \tabularnewline
64 & 1040 & 856.123915281063 & 183.876084718937 \tabularnewline
65 & 792 & 996.105689013427 & -204.105689013427 \tabularnewline
66 & 653 & 818.133787928535 & -165.133787928535 \tabularnewline
67 & 866 & 845.700722996374 & 20.2992770036255 \tabularnewline
68 & 679 & 665.367065607399 & 13.6329343926005 \tabularnewline
69 & 799 & 688.533335978941 & 110.466664021059 \tabularnewline
70 & 760 & 886.74963038836 & -126.74963038836 \tabularnewline
71 & 699 & 739.049207462286 & -40.0492074622864 \tabularnewline
72 & 762 & 699.261506775263 & 62.7384932247371 \tabularnewline
\hline
\end{tabular}
%Source: https://freestatistics.org/blog/index.php?pk=284258&T=2

[TABLE]
[ROW][C]Interpolation Forecasts of Exponential Smoothing[/C][/ROW]
[ROW][C]t[/C][C]Observed[/C][C]Fitted[/C][C]Residuals[/C][/ROW]
[ROW][C]13[/C][C]789[/C][C]830.584730051405[/C][C]-41.5847300514048[/C][/ROW]
[ROW][C]14[/C][C]811[/C][C]842.757228470835[/C][C]-31.7572284708347[/C][/ROW]
[ROW][C]15[/C][C]996[/C][C]1025.47916410276[/C][C]-29.4791641027641[/C][/ROW]
[ROW][C]16[/C][C]778[/C][C]799.19352000869[/C][C]-21.1935200086905[/C][/ROW]
[ROW][C]17[/C][C]603[/C][C]611.988890143471[/C][C]-8.98889014347083[/C][/ROW]
[ROW][C]18[/C][C]990[/C][C]1001.69252734166[/C][C]-11.6925273416591[/C][/ROW]
[ROW][C]19[/C][C]735[/C][C]842.685688202096[/C][C]-107.685688202096[/C][/ROW]
[ROW][C]20[/C][C]800[/C][C]678.908871024397[/C][C]121.091128975603[/C][/ROW]
[ROW][C]21[/C][C]706[/C][C]821.08633767568[/C][C]-115.08633767568[/C][/ROW]
[ROW][C]22[/C][C]766[/C][C]730.39019280365[/C][C]35.6098071963496[/C][/ROW]
[ROW][C]23[/C][C]870[/C][C]775.447375677576[/C][C]94.5526243224241[/C][/ROW]
[ROW][C]24[/C][C]647[/C][C]765.948814057358[/C][C]-118.948814057358[/C][/ROW]
[ROW][C]25[/C][C]726[/C][C]674.944060074434[/C][C]51.0559399255661[/C][/ROW]
[ROW][C]26[/C][C]784[/C][C]710.541172677855[/C][C]73.4588273221449[/C][/ROW]
[ROW][C]27[/C][C]884[/C][C]898.518201882641[/C][C]-14.5182018826412[/C][/ROW]
[ROW][C]28[/C][C]696[/C][C]702.613554853225[/C][C]-6.61355485322542[/C][/ROW]
[ROW][C]29[/C][C]893[/C][C]543.62785127942[/C][C]349.37214872058[/C][/ROW]
[ROW][C]30[/C][C]674[/C][C]1034.76349361734[/C][C]-360.763493617337[/C][/ROW]
[ROW][C]31[/C][C]703[/C][C]740.858882346672[/C][C]-37.8588823466717[/C][/ROW]
[ROW][C]32[/C][C]799[/C][C]727.705369082362[/C][C]71.2946309176384[/C][/ROW]
[ROW][C]33[/C][C]793[/C][C]715.25591691561[/C][C]77.7440830843896[/C][/ROW]
[ROW][C]34[/C][C]799[/C][C]761.737626978275[/C][C]37.2623730217246[/C][/ROW]
[ROW][C]35[/C][C]1022[/C][C]841.880714202248[/C][C]180.119285797752[/C][/ROW]
[ROW][C]36[/C][C]758[/C][C]717.162805855836[/C][C]40.837194144164[/C][/ROW]
[ROW][C]37[/C][C]1021[/C][C]770.319331287655[/C][C]250.680668712345[/C][/ROW]
[ROW][C]38[/C][C]944[/C][C]873.582289913943[/C][C]70.4177100860572[/C][/ROW]
[ROW][C]39[/C][C]915[/C][C]1027.58113475967[/C][C]-112.581134759665[/C][/ROW]
[ROW][C]40[/C][C]864[/C][C]789.353498462656[/C][C]74.6465015373443[/C][/ROW]
[ROW][C]41[/C][C]1022[/C][C]840.192601476244[/C][C]181.807398523756[/C][/ROW]
[ROW][C]42[/C][C]891[/C][C]844.391522037314[/C][C]46.6084779626857[/C][/ROW]
[ROW][C]43[/C][C]1087[/C][C]841.177920478521[/C][C]245.822079521479[/C][/ROW]
[ROW][C]44[/C][C]822[/C][C]979.685905983722[/C][C]-157.685905983722[/C][/ROW]
[ROW][C]45[/C][C]890[/C][C]910.429086729255[/C][C]-20.429086729255[/C][/ROW]
[ROW][C]46[/C][C]1092[/C][C]910.323095821177[/C][C]181.676904178823[/C][/ROW]
[ROW][C]47[/C][C]967[/C][C]1138.30526826974[/C][C]-171.305268269745[/C][/ROW]
[ROW][C]48[/C][C]833[/C][C]819.073508047485[/C][C]13.9264919525154[/C][/ROW]
[ROW][C]49[/C][C]1104[/C][C]995.836069587564[/C][C]108.163930412436[/C][/ROW]
[ROW][C]50[/C][C]1063[/C][C]953.457950834012[/C][C]109.542049165988[/C][/ROW]
[ROW][C]51[/C][C]1103[/C][C]1007.46114065051[/C][C]95.5388593494863[/C][/ROW]
[ROW][C]52[/C][C]1039[/C][C]921.055685281173[/C][C]117.944314718827[/C][/ROW]
[ROW][C]53[/C][C]1185[/C][C]1052.4687865505[/C][C]132.531213449503[/C][/ROW]
[ROW][C]54[/C][C]1047[/C][C]953.00987007396[/C][C]93.9901299260396[/C][/ROW]
[ROW][C]55[/C][C]1155[/C][C]1081.41730171267[/C][C]73.5826982873305[/C][/ROW]
[ROW][C]56[/C][C]878[/C][C]925.200421178682[/C][C]-47.2004211786821[/C][/ROW]
[ROW][C]57[/C][C]879[/C][C]969.390705513761[/C][C]-90.3907055137612[/C][/ROW]
[ROW][C]58[/C][C]1133[/C][C]1075.90200768454[/C][C]57.0979923154568[/C][/ROW]
[ROW][C]59[/C][C]920[/C][C]1058.1443680503[/C][C]-138.144368050301[/C][/ROW]
[ROW][C]60[/C][C]943[/C][C]852.793494960203[/C][C]90.2065050397965[/C][/ROW]
[ROW][C]61[/C][C]938[/C][C]1115.31026111251[/C][C]-177.310261112511[/C][/ROW]
[ROW][C]62[/C][C]900[/C][C]1003.39757035325[/C][C]-103.397570353251[/C][/ROW]
[ROW][C]63[/C][C]781[/C][C]994.270354002263[/C][C]-213.270354002263[/C][/ROW]
[ROW][C]64[/C][C]1040[/C][C]856.123915281063[/C][C]183.876084718937[/C][/ROW]
[ROW][C]65[/C][C]792[/C][C]996.105689013427[/C][C]-204.105689013427[/C][/ROW]
[ROW][C]66[/C][C]653[/C][C]818.133787928535[/C][C]-165.133787928535[/C][/ROW]
[ROW][C]67[/C][C]866[/C][C]845.700722996374[/C][C]20.2992770036255[/C][/ROW]
[ROW][C]68[/C][C]679[/C][C]665.367065607399[/C][C]13.6329343926005[/C][/ROW]
[ROW][C]69[/C][C]799[/C][C]688.533335978941[/C][C]110.466664021059[/C][/ROW]
[ROW][C]70[/C][C]760[/C][C]886.74963038836[/C][C]-126.74963038836[/C][/ROW]
[ROW][C]71[/C][C]699[/C][C]739.049207462286[/C][C]-40.0492074622864[/C][/ROW]
[ROW][C]72[/C][C]762[/C][C]699.261506775263[/C][C]62.7384932247371[/C][/ROW]
[/TABLE]
Source: https://freestatistics.org/blog/index.php?pk=284258&T=2

Globally Unique Identifier (entire table): ba.freestatistics.org/blog/index.php?pk=284258&T=2

As an alternative you can also use a QR Code:  

The GUIDs for individual cells are displayed in the table below:

Interpolation Forecasts of Exponential Smoothing
tObservedFittedResiduals
13789830.584730051405-41.5847300514048
14811842.757228470835-31.7572284708347
159961025.47916410276-29.4791641027641
16778799.19352000869-21.1935200086905
17603611.988890143471-8.98889014347083
189901001.69252734166-11.6925273416591
19735842.685688202096-107.685688202096
20800678.908871024397121.091128975603
21706821.08633767568-115.08633767568
22766730.3901928036535.6098071963496
23870775.44737567757694.5526243224241
24647765.948814057358-118.948814057358
25726674.94406007443451.0559399255661
26784710.54117267785573.4588273221449
27884898.518201882641-14.5182018826412
28696702.613554853225-6.61355485322542
29893543.62785127942349.37214872058
306741034.76349361734-360.763493617337
31703740.858882346672-37.8588823466717
32799727.70536908236271.2946309176384
33793715.2559169156177.7440830843896
34799761.73762697827537.2623730217246
351022841.880714202248180.119285797752
36758717.16280585583640.837194144164
371021770.319331287655250.680668712345
38944873.58228991394370.4177100860572
399151027.58113475967-112.581134759665
40864789.35349846265674.6465015373443
411022840.192601476244181.807398523756
42891844.39152203731446.6084779626857
431087841.177920478521245.822079521479
44822979.685905983722-157.685905983722
45890910.429086729255-20.429086729255
461092910.323095821177181.676904178823
479671138.30526826974-171.305268269745
48833819.07350804748513.9264919525154
491104995.836069587564108.163930412436
501063953.457950834012109.542049165988
5111031007.4611406505195.5388593494863
521039921.055685281173117.944314718827
5311851052.4687865505132.531213449503
541047953.0098700739693.9901299260396
5511551081.4173017126773.5826982873305
56878925.200421178682-47.2004211786821
57879969.390705513761-90.3907055137612
5811331075.9020076845457.0979923154568
599201058.1443680503-138.144368050301
60943852.79349496020390.2065050397965
619381115.31026111251-177.310261112511
629001003.39757035325-103.397570353251
63781994.270354002263-213.270354002263
641040856.123915281063183.876084718937
65792996.105689013427-204.105689013427
66653818.133787928535-165.133787928535
67866845.70072299637420.2992770036255
68679665.36706560739913.6329343926005
69799688.533335978941110.466664021059
70760886.74963038836-126.74963038836
71699739.049207462286-40.0492074622864
72762699.26150677526362.7384932247371


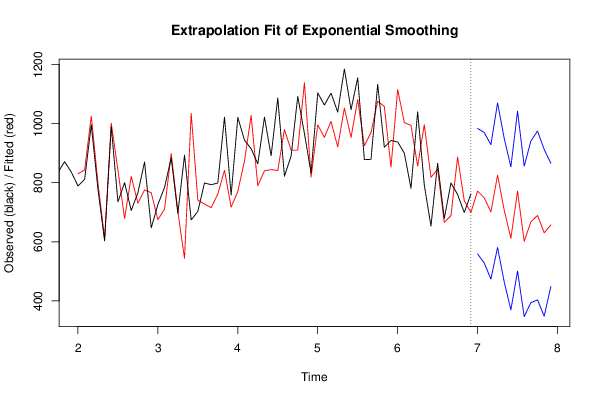
Extrapolation Forecasts of Exponential Smoothing
tForecast95% Lower Bound95% Upper Bound
73771.416074473598559.027527898545983.804621048652
74748.862330133994528.093631910411969.631028357576
75701.151435566977473.691419739355928.611451394599
76825.191946628498580.5865270408411069.79736621615
77706.973132795305464.102100433543949.844165157066
78611.54095416633369.44120409017853.64070424249
79771.352275012543500.7627265419171041.94182348317
80601.383152753236346.558824293434856.207481213038
81667.385549489613393.799138011345940.971960967881
82689.122167842951403.317698924227974.926636761675
83630.494684122805348.199022802071912.790345443539
84656.996811970354448.437973146827865.55565079388

\begin{tabular}{lllllllll}
\hline
Extrapolation Forecasts of Exponential Smoothing \tabularnewline
t & Forecast & 95% Lower Bound & 95% Upper Bound \tabularnewline
73 & 771.416074473598 & 559.027527898545 & 983.804621048652 \tabularnewline
74 & 748.862330133994 & 528.093631910411 & 969.631028357576 \tabularnewline
75 & 701.151435566977 & 473.691419739355 & 928.611451394599 \tabularnewline
76 & 825.191946628498 & 580.586527040841 & 1069.79736621615 \tabularnewline
77 & 706.973132795305 & 464.102100433543 & 949.844165157066 \tabularnewline
78 & 611.54095416633 & 369.44120409017 & 853.64070424249 \tabularnewline
79 & 771.352275012543 & 500.762726541917 & 1041.94182348317 \tabularnewline
80 & 601.383152753236 & 346.558824293434 & 856.207481213038 \tabularnewline
81 & 667.385549489613 & 393.799138011345 & 940.971960967881 \tabularnewline
82 & 689.122167842951 & 403.317698924227 & 974.926636761675 \tabularnewline
83 & 630.494684122805 & 348.199022802071 & 912.790345443539 \tabularnewline
84 & 656.996811970354 & 448.437973146827 & 865.55565079388 \tabularnewline
\hline
\end{tabular}
%Source: https://freestatistics.org/blog/index.php?pk=284258&T=3

[TABLE]
[ROW][C]Extrapolation Forecasts of Exponential Smoothing[/C][/ROW]
[ROW][C]t[/C][C]Forecast[/C][C]95% Lower Bound[/C][C]95% Upper Bound[/C][/ROW]
[ROW][C]73[/C][C]771.416074473598[/C][C]559.027527898545[/C][C]983.804621048652[/C][/ROW]
[ROW][C]74[/C][C]748.862330133994[/C][C]528.093631910411[/C][C]969.631028357576[/C][/ROW]
[ROW][C]75[/C][C]701.151435566977[/C][C]473.691419739355[/C][C]928.611451394599[/C][/ROW]
[ROW][C]76[/C][C]825.191946628498[/C][C]580.586527040841[/C][C]1069.79736621615[/C][/ROW]
[ROW][C]77[/C][C]706.973132795305[/C][C]464.102100433543[/C][C]949.844165157066[/C][/ROW]
[ROW][C]78[/C][C]611.54095416633[/C][C]369.44120409017[/C][C]853.64070424249[/C][/ROW]
[ROW][C]79[/C][C]771.352275012543[/C][C]500.762726541917[/C][C]1041.94182348317[/C][/ROW]
[ROW][C]80[/C][C]601.383152753236[/C][C]346.558824293434[/C][C]856.207481213038[/C][/ROW]
[ROW][C]81[/C][C]667.385549489613[/C][C]393.799138011345[/C][C]940.971960967881[/C][/ROW]
[ROW][C]82[/C][C]689.122167842951[/C][C]403.317698924227[/C][C]974.926636761675[/C][/ROW]
[ROW][C]83[/C][C]630.494684122805[/C][C]348.199022802071[/C][C]912.790345443539[/C][/ROW]
[ROW][C]84[/C][C]656.996811970354[/C][C]448.437973146827[/C][C]865.55565079388[/C][/ROW]
[/TABLE]
Source: https://freestatistics.org/blog/index.php?pk=284258&T=3

Globally Unique Identifier (entire table): ba.freestatistics.org/blog/index.php?pk=284258&T=3

As an alternative you can also use a QR Code:  

The GUIDs for individual cells are displayed in the table below:

Extrapolation Forecasts of Exponential Smoothing
tForecast95% Lower Bound95% Upper Bound
73771.416074473598559.027527898545983.804621048652
74748.862330133994528.093631910411969.631028357576
75701.151435566977473.691419739355928.611451394599
76825.191946628498580.5865270408411069.79736621615
77706.973132795305464.102100433543949.844165157066
78611.54095416633369.44120409017853.64070424249
79771.352275012543500.7627265419171041.94182348317
80601.383152753236346.558824293434856.207481213038
81667.385549489613393.799138011345940.971960967881
82689.122167842951403.317698924227974.926636761675
83630.494684122805348.199022802071912.790345443539
84656.996811970354448.437973146827865.55565079388


Parameters (Session):
par1 = 12 ; par2 = Triple ; par3 = multiplicative ;
Parameters (R input):
par1 = 12 ; par2 = Triple ; par3 = multiplicative ;
R code (references can be found in the software module):
par1 <- as.numeric(par1)
if (par2 == 'Single') K <- 1
if (par2 == 'Double') K <- 2
if (par2 == 'Triple') K <- par1
nx <- length(x)
nxmK <- nx - K
x <- ts(x, frequency = par1)
if (par2 == 'Single') fit <- HoltWinters(x, gamma=F, beta=F)
if (par2 == 'Double') fit <- HoltWinters(x, gamma=F)
if (par2 == 'Triple') fit <- HoltWinters(x, seasonal=par3)
fit
myresid <- x - fit$fitted[,'xhat']
bitmap(file='test1.png')
op <- par(mfrow=c(2,1))
plot(fit,ylab='Observed (black) / Fitted (red)',main='Interpolation Fit of Exponential Smoothing')
plot(myresid,ylab='Residuals',main='Interpolation Prediction Errors')
par(op)
dev.off()
bitmap(file='test2.png')
p <- predict(fit, par1, prediction.interval=TRUE)
np <- length(p[,1])
plot(fit,p,ylab='Observed (black) / Fitted (red)',main='Extrapolation Fit of Exponential Smoothing')
dev.off()
bitmap(file='test3.png')
op <- par(mfrow = c(2,2))
acf(as.numeric(myresid),lag.max = nx/2,main='Residual ACF')
spectrum(myresid,main='Residals Periodogram')
cpgram(myresid,main='Residal Cumulative Periodogram')
qqnorm(myresid,main='Residual Normal QQ Plot')
qqline(myresid)
par(op)
dev.off()
load(file='createtable')
a<-table.start()
a<-table.row.start(a)
a<-table.element(a,'Estimated Parameters of Exponential Smoothing',2,TRUE)
a<-table.row.end(a)
a<-table.row.start(a)
a<-table.element(a,'Parameter',header=TRUE)
a<-table.element(a,'Value',header=TRUE)
a<-table.row.end(a)
a<-table.row.start(a)
a<-table.element(a,'alpha',header=TRUE)
a<-table.element(a,fit$alpha)
a<-table.row.end(a)
a<-table.row.start(a)
a<-table.element(a,'beta',header=TRUE)
a<-table.element(a,fit$beta)
a<-table.row.end(a)
a<-table.row.start(a)
a<-table.element(a,'gamma',header=TRUE)
a<-table.element(a,fit$gamma)
a<-table.row.end(a)
a<-table.end(a)
table.save(a,file='mytable.tab')
a<-table.start()
a<-table.row.start(a)
a<-table.element(a,'Interpolation Forecasts of Exponential Smoothing',4,TRUE)
a<-table.row.end(a)
a<-table.row.start(a)
a<-table.element(a,'t',header=TRUE)
a<-table.element(a,'Observed',header=TRUE)
a<-table.element(a,'Fitted',header=TRUE)
a<-table.element(a,'Residuals',header=TRUE)
a<-table.row.end(a)
for (i in 1:nxmK) {
a<-table.row.start(a)
a<-table.element(a,i+K,header=TRUE)
a<-table.element(a,x[i+K])
a<-table.element(a,fit$fitted[i,'xhat'])
a<-table.element(a,myresid[i])
a<-table.row.end(a)
}
a<-table.end(a)
table.save(a,file='mytable1.tab')
a<-table.start()
a<-table.row.start(a)
a<-table.element(a,'Extrapolation Forecasts of Exponential Smoothing',4,TRUE)
a<-table.row.end(a)
a<-table.row.start(a)
a<-table.element(a,'t',header=TRUE)
a<-table.element(a,'Forecast',header=TRUE)
a<-table.element(a,'95% Lower Bound',header=TRUE)
a<-table.element(a,'95% Upper Bound',header=TRUE)
a<-table.row.end(a)
for (i in 1:np) {
a<-table.row.start(a)
a<-table.element(a,nx+i,header=TRUE)
a<-table.element(a,p[i,'fit'])
a<-table.element(a,p[i,'lwr'])
a<-table.element(a,p[i,'upr'])
a<-table.row.end(a)
}
a<-table.end(a)
table.save(a,file='mytable2.tab')