Free Statistics

of Irreproducible Research!

Author's title

Author*Unverified author*
R Software Modulerwasp_exponentialsmoothing.wasp
Title produced by softwareExponential Smoothing
Date of computationThu, 26 Nov 2015 16:31:17 +0000
Cite this page as followsStatistical Computations at FreeStatistics.org, Office for Research Development and Education, URL https://freestatistics.org/blog/index.php?v=date/2015/Nov/26/t14485554889xc9hstl8zbyycy.htm/, Retrieved Tue, 14 May 2024 13:35:20 +0000
Statistical Computations at FreeStatistics.org, Office for Research Development and Education, URL https://freestatistics.org/blog/index.php?pk=284255, Retrieved Tue, 14 May 2024 13:35:20 +0000
QR Codes:

Original text written by user:
IsPrivate?No (this computation is public)
User-defined keywords
Estimated Impact81
Family? (F = Feedback message, R = changed R code, M = changed R Module, P = changed Parameters, D = changed Data)
-       [Exponential Smoothing] [] [2015-11-26 16:31:17] [51347023fbb3308e181ecc8c43b3ca65] [Current]
Feedback Forum

Post a new message
Dataseries X:
6678
6554
6513
6210
5928
6268
5582
5869
5764
6082
6062
6810
6727
6537
6175
6014
6109


Summary of computational transaction
Raw Inputview raw input (R code)
Raw Outputview raw output of R engine
Computing time2 seconds
R Server'George Udny Yule' @ yule.wessa.net

\begin{tabular}{lllllllll}
\hline
Summary of computational transaction \tabularnewline
Raw Input & view raw input (R code)  \tabularnewline
Raw Output & view raw output of R engine  \tabularnewline
Computing time & 2 seconds \tabularnewline
R Server & 'George Udny Yule' @ yule.wessa.net \tabularnewline
\hline
\end{tabular}
%Source: https://freestatistics.org/blog/index.php?pk=284255&T=0

[TABLE]
[ROW][C]Summary of computational transaction[/C][/ROW]
[ROW][C]Raw Input[/C][C]view raw input (R code) [/C][/ROW]
[ROW][C]Raw Output[/C][C]view raw output of R engine [/C][/ROW]
[ROW][C]Computing time[/C][C]2 seconds[/C][/ROW]
[ROW][C]R Server[/C][C]'George Udny Yule' @ yule.wessa.net[/C][/ROW]
[/TABLE]
Source: https://freestatistics.org/blog/index.php?pk=284255&T=0

Globally Unique Identifier (entire table): ba.freestatistics.org/blog/index.php?pk=284255&T=0

As an alternative you can also use a QR Code:  

The GUIDs for individual cells are displayed in the table below:

Summary of computational transaction
Raw Inputview raw input (R code)
Raw Outputview raw output of R engine
Computing time2 seconds
R Server'George Udny Yule' @ yule.wessa.net


Estimated Parameters of Exponential Smoothing
ParameterValue
alpha0.819010821000572
betaFALSE
gammaFALSE

\begin{tabular}{lllllllll}
\hline
Estimated Parameters of Exponential Smoothing \tabularnewline
Parameter & Value \tabularnewline
alpha & 0.819010821000572 \tabularnewline
beta & FALSE \tabularnewline
gamma & FALSE \tabularnewline
\hline
\end{tabular}
%Source: https://freestatistics.org/blog/index.php?pk=284255&T=1

[TABLE]
[ROW][C]Estimated Parameters of Exponential Smoothing[/C][/ROW]
[ROW][C]Parameter[/C][C]Value[/C][/ROW]
[ROW][C]alpha[/C][C]0.819010821000572[/C][/ROW]
[ROW][C]beta[/C][C]FALSE[/C][/ROW]
[ROW][C]gamma[/C][C]FALSE[/C][/ROW]
[/TABLE]
Source: https://freestatistics.org/blog/index.php?pk=284255&T=1

Globally Unique Identifier (entire table): ba.freestatistics.org/blog/index.php?pk=284255&T=1

As an alternative you can also use a QR Code:  

The GUIDs for individual cells are displayed in the table below:

Estimated Parameters of Exponential Smoothing
ParameterValue
alpha0.819010821000572
betaFALSE
gammaFALSE


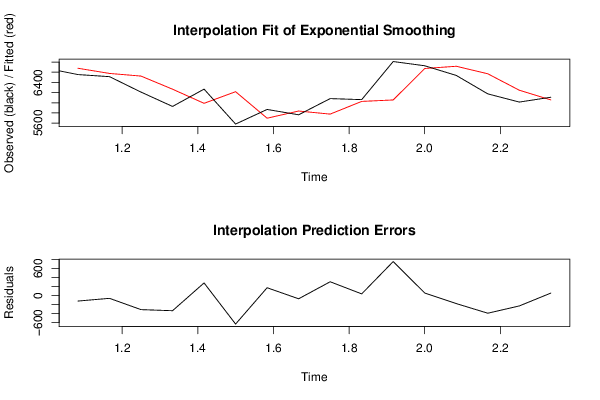
Interpolation Forecasts of Exponential Smoothing
tObservedFittedResiduals
265546678-124
365136576.44265819593-63.4426581959287
462106524.48243462042-314.482434620422
559286266.91791765169-338.917917651692
662685989.34047566398278.659524336024
755826217.56564147005-635.565641470052
858695697.03050364991171.969496350091
957645837.87538204265-73.8753820426518
1060825777.37064474417304.629355255831
1160626026.8653830931235.1346169068775
1268106055.64101453156754.358985468435
1367276673.4691865492353.5308134507741
1465376717.31150202237-180.311502022372
1561756569.63443071518-394.634430715183
1660146246.42456162005-232.424561620048
1761096056.0663305869152.9336694130852

\begin{tabular}{lllllllll}
\hline
Interpolation Forecasts of Exponential Smoothing \tabularnewline
t & Observed & Fitted & Residuals \tabularnewline
2 & 6554 & 6678 & -124 \tabularnewline
3 & 6513 & 6576.44265819593 & -63.4426581959287 \tabularnewline
4 & 6210 & 6524.48243462042 & -314.482434620422 \tabularnewline
5 & 5928 & 6266.91791765169 & -338.917917651692 \tabularnewline
6 & 6268 & 5989.34047566398 & 278.659524336024 \tabularnewline
7 & 5582 & 6217.56564147005 & -635.565641470052 \tabularnewline
8 & 5869 & 5697.03050364991 & 171.969496350091 \tabularnewline
9 & 5764 & 5837.87538204265 & -73.8753820426518 \tabularnewline
10 & 6082 & 5777.37064474417 & 304.629355255831 \tabularnewline
11 & 6062 & 6026.86538309312 & 35.1346169068775 \tabularnewline
12 & 6810 & 6055.64101453156 & 754.358985468435 \tabularnewline
13 & 6727 & 6673.46918654923 & 53.5308134507741 \tabularnewline
14 & 6537 & 6717.31150202237 & -180.311502022372 \tabularnewline
15 & 6175 & 6569.63443071518 & -394.634430715183 \tabularnewline
16 & 6014 & 6246.42456162005 & -232.424561620048 \tabularnewline
17 & 6109 & 6056.06633058691 & 52.9336694130852 \tabularnewline
\hline
\end{tabular}
%Source: https://freestatistics.org/blog/index.php?pk=284255&T=2

[TABLE]
[ROW][C]Interpolation Forecasts of Exponential Smoothing[/C][/ROW]
[ROW][C]t[/C][C]Observed[/C][C]Fitted[/C][C]Residuals[/C][/ROW]
[ROW][C]2[/C][C]6554[/C][C]6678[/C][C]-124[/C][/ROW]
[ROW][C]3[/C][C]6513[/C][C]6576.44265819593[/C][C]-63.4426581959287[/C][/ROW]
[ROW][C]4[/C][C]6210[/C][C]6524.48243462042[/C][C]-314.482434620422[/C][/ROW]
[ROW][C]5[/C][C]5928[/C][C]6266.91791765169[/C][C]-338.917917651692[/C][/ROW]
[ROW][C]6[/C][C]6268[/C][C]5989.34047566398[/C][C]278.659524336024[/C][/ROW]
[ROW][C]7[/C][C]5582[/C][C]6217.56564147005[/C][C]-635.565641470052[/C][/ROW]
[ROW][C]8[/C][C]5869[/C][C]5697.03050364991[/C][C]171.969496350091[/C][/ROW]
[ROW][C]9[/C][C]5764[/C][C]5837.87538204265[/C][C]-73.8753820426518[/C][/ROW]
[ROW][C]10[/C][C]6082[/C][C]5777.37064474417[/C][C]304.629355255831[/C][/ROW]
[ROW][C]11[/C][C]6062[/C][C]6026.86538309312[/C][C]35.1346169068775[/C][/ROW]
[ROW][C]12[/C][C]6810[/C][C]6055.64101453156[/C][C]754.358985468435[/C][/ROW]
[ROW][C]13[/C][C]6727[/C][C]6673.46918654923[/C][C]53.5308134507741[/C][/ROW]
[ROW][C]14[/C][C]6537[/C][C]6717.31150202237[/C][C]-180.311502022372[/C][/ROW]
[ROW][C]15[/C][C]6175[/C][C]6569.63443071518[/C][C]-394.634430715183[/C][/ROW]
[ROW][C]16[/C][C]6014[/C][C]6246.42456162005[/C][C]-232.424561620048[/C][/ROW]
[ROW][C]17[/C][C]6109[/C][C]6056.06633058691[/C][C]52.9336694130852[/C][/ROW]
[/TABLE]
Source: https://freestatistics.org/blog/index.php?pk=284255&T=2

Globally Unique Identifier (entire table): ba.freestatistics.org/blog/index.php?pk=284255&T=2

As an alternative you can also use a QR Code:  

The GUIDs for individual cells are displayed in the table below:

Interpolation Forecasts of Exponential Smoothing
tObservedFittedResiduals
265546678-124
365136576.44265819593-63.4426581959287
462106524.48243462042-314.482434620422
559286266.91791765169-338.917917651692
662685989.34047566398278.659524336024
755826217.56564147005-635.565641470052
858695697.03050364991171.969496350091
957645837.87538204265-73.8753820426518
1060825777.37064474417304.629355255831
1160626026.8653830931235.1346169068775
1268106055.64101453156754.358985468435
1367276673.4691865492353.5308134507741
1465376717.31150202237-180.311502022372
1561756569.63443071518-394.634430715183
1660146246.42456162005-232.424561620048
1761096056.0663305869152.9336694130852


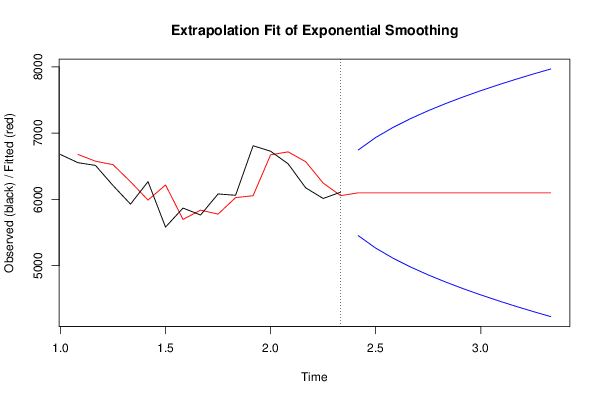
Extrapolation Forecasts of Exponential Smoothing
tForecast95% Lower Bound95% Upper Bound
186099.41957863155453.398336515246745.44082074776
196099.41957863155264.381526005966934.45763125704
206099.41957863155110.868288409367087.97086885364
216099.41957863154978.179748146037220.65940911696
226099.41957863154859.611584813797339.22757244921
236099.41957863154751.432573649077447.40658361393
246099.41957863154651.312514333867547.52664292913
256099.41957863154557.680569027117641.15858823589
266099.41957863154469.418266422477729.42089084052
276099.41957863154385.695743858127813.14341340487
286099.41957863154305.877138113977892.96201914903
296099.41957863154229.462469496437969.37668776657

\begin{tabular}{lllllllll}
\hline
Extrapolation Forecasts of Exponential Smoothing \tabularnewline
t & Forecast & 95% Lower Bound & 95% Upper Bound \tabularnewline
18 & 6099.4195786315 & 5453.39833651524 & 6745.44082074776 \tabularnewline
19 & 6099.4195786315 & 5264.38152600596 & 6934.45763125704 \tabularnewline
20 & 6099.4195786315 & 5110.86828840936 & 7087.97086885364 \tabularnewline
21 & 6099.4195786315 & 4978.17974814603 & 7220.65940911696 \tabularnewline
22 & 6099.4195786315 & 4859.61158481379 & 7339.22757244921 \tabularnewline
23 & 6099.4195786315 & 4751.43257364907 & 7447.40658361393 \tabularnewline
24 & 6099.4195786315 & 4651.31251433386 & 7547.52664292913 \tabularnewline
25 & 6099.4195786315 & 4557.68056902711 & 7641.15858823589 \tabularnewline
26 & 6099.4195786315 & 4469.41826642247 & 7729.42089084052 \tabularnewline
27 & 6099.4195786315 & 4385.69574385812 & 7813.14341340487 \tabularnewline
28 & 6099.4195786315 & 4305.87713811397 & 7892.96201914903 \tabularnewline
29 & 6099.4195786315 & 4229.46246949643 & 7969.37668776657 \tabularnewline
\hline
\end{tabular}
%Source: https://freestatistics.org/blog/index.php?pk=284255&T=3

[TABLE]
[ROW][C]Extrapolation Forecasts of Exponential Smoothing[/C][/ROW]
[ROW][C]t[/C][C]Forecast[/C][C]95% Lower Bound[/C][C]95% Upper Bound[/C][/ROW]
[ROW][C]18[/C][C]6099.4195786315[/C][C]5453.39833651524[/C][C]6745.44082074776[/C][/ROW]
[ROW][C]19[/C][C]6099.4195786315[/C][C]5264.38152600596[/C][C]6934.45763125704[/C][/ROW]
[ROW][C]20[/C][C]6099.4195786315[/C][C]5110.86828840936[/C][C]7087.97086885364[/C][/ROW]
[ROW][C]21[/C][C]6099.4195786315[/C][C]4978.17974814603[/C][C]7220.65940911696[/C][/ROW]
[ROW][C]22[/C][C]6099.4195786315[/C][C]4859.61158481379[/C][C]7339.22757244921[/C][/ROW]
[ROW][C]23[/C][C]6099.4195786315[/C][C]4751.43257364907[/C][C]7447.40658361393[/C][/ROW]
[ROW][C]24[/C][C]6099.4195786315[/C][C]4651.31251433386[/C][C]7547.52664292913[/C][/ROW]
[ROW][C]25[/C][C]6099.4195786315[/C][C]4557.68056902711[/C][C]7641.15858823589[/C][/ROW]
[ROW][C]26[/C][C]6099.4195786315[/C][C]4469.41826642247[/C][C]7729.42089084052[/C][/ROW]
[ROW][C]27[/C][C]6099.4195786315[/C][C]4385.69574385812[/C][C]7813.14341340487[/C][/ROW]
[ROW][C]28[/C][C]6099.4195786315[/C][C]4305.87713811397[/C][C]7892.96201914903[/C][/ROW]
[ROW][C]29[/C][C]6099.4195786315[/C][C]4229.46246949643[/C][C]7969.37668776657[/C][/ROW]
[/TABLE]
Source: https://freestatistics.org/blog/index.php?pk=284255&T=3

Globally Unique Identifier (entire table): ba.freestatistics.org/blog/index.php?pk=284255&T=3

As an alternative you can also use a QR Code:  

The GUIDs for individual cells are displayed in the table below:

Extrapolation Forecasts of Exponential Smoothing
tForecast95% Lower Bound95% Upper Bound
186099.41957863155453.398336515246745.44082074776
196099.41957863155264.381526005966934.45763125704
206099.41957863155110.868288409367087.97086885364
216099.41957863154978.179748146037220.65940911696
226099.41957863154859.611584813797339.22757244921
236099.41957863154751.432573649077447.40658361393
246099.41957863154651.312514333867547.52664292913
256099.41957863154557.680569027117641.15858823589
266099.41957863154469.418266422477729.42089084052
276099.41957863154385.695743858127813.14341340487
286099.41957863154305.877138113977892.96201914903
296099.41957863154229.462469496437969.37668776657


Parameters (Session):
par1 = 12 ; par2 = Single ; par3 = additive ;
Parameters (R input):
par1 = 12 ; par2 = Single ; par3 = additive ;
R code (references can be found in the software module):
par1 <- as.numeric(par1)
if (par2 == 'Single') K <- 1
if (par2 == 'Double') K <- 2
if (par2 == 'Triple') K <- par1
nx <- length(x)
nxmK <- nx - K
x <- ts(x, frequency = par1)
if (par2 == 'Single') fit <- HoltWinters(x, gamma=F, beta=F)
if (par2 == 'Double') fit <- HoltWinters(x, gamma=F)
if (par2 == 'Triple') fit <- HoltWinters(x, seasonal=par3)
fit
myresid <- x - fit$fitted[,'xhat']
bitmap(file='test1.png')
op <- par(mfrow=c(2,1))
plot(fit,ylab='Observed (black) / Fitted (red)',main='Interpolation Fit of Exponential Smoothing')
plot(myresid,ylab='Residuals',main='Interpolation Prediction Errors')
par(op)
dev.off()
bitmap(file='test2.png')
p <- predict(fit, par1, prediction.interval=TRUE)
np <- length(p[,1])
plot(fit,p,ylab='Observed (black) / Fitted (red)',main='Extrapolation Fit of Exponential Smoothing')
dev.off()
bitmap(file='test3.png')
op <- par(mfrow = c(2,2))
acf(as.numeric(myresid),lag.max = nx/2,main='Residual ACF')
spectrum(myresid,main='Residals Periodogram')
cpgram(myresid,main='Residal Cumulative Periodogram')
qqnorm(myresid,main='Residual Normal QQ Plot')
qqline(myresid)
par(op)
dev.off()
load(file='createtable')
a<-table.start()
a<-table.row.start(a)
a<-table.element(a,'Estimated Parameters of Exponential Smoothing',2,TRUE)
a<-table.row.end(a)
a<-table.row.start(a)
a<-table.element(a,'Parameter',header=TRUE)
a<-table.element(a,'Value',header=TRUE)
a<-table.row.end(a)
a<-table.row.start(a)
a<-table.element(a,'alpha',header=TRUE)
a<-table.element(a,fit$alpha)
a<-table.row.end(a)
a<-table.row.start(a)
a<-table.element(a,'beta',header=TRUE)
a<-table.element(a,fit$beta)
a<-table.row.end(a)
a<-table.row.start(a)
a<-table.element(a,'gamma',header=TRUE)
a<-table.element(a,fit$gamma)
a<-table.row.end(a)
a<-table.end(a)
table.save(a,file='mytable.tab')
a<-table.start()
a<-table.row.start(a)
a<-table.element(a,'Interpolation Forecasts of Exponential Smoothing',4,TRUE)
a<-table.row.end(a)
a<-table.row.start(a)
a<-table.element(a,'t',header=TRUE)
a<-table.element(a,'Observed',header=TRUE)
a<-table.element(a,'Fitted',header=TRUE)
a<-table.element(a,'Residuals',header=TRUE)
a<-table.row.end(a)
for (i in 1:nxmK) {
a<-table.row.start(a)
a<-table.element(a,i+K,header=TRUE)
a<-table.element(a,x[i+K])
a<-table.element(a,fit$fitted[i,'xhat'])
a<-table.element(a,myresid[i])
a<-table.row.end(a)
}
a<-table.end(a)
table.save(a,file='mytable1.tab')
a<-table.start()
a<-table.row.start(a)
a<-table.element(a,'Extrapolation Forecasts of Exponential Smoothing',4,TRUE)
a<-table.row.end(a)
a<-table.row.start(a)
a<-table.element(a,'t',header=TRUE)
a<-table.element(a,'Forecast',header=TRUE)
a<-table.element(a,'95% Lower Bound',header=TRUE)
a<-table.element(a,'95% Upper Bound',header=TRUE)
a<-table.row.end(a)
for (i in 1:np) {
a<-table.row.start(a)
a<-table.element(a,nx+i,header=TRUE)
a<-table.element(a,p[i,'fit'])
a<-table.element(a,p[i,'lwr'])
a<-table.element(a,p[i,'upr'])
a<-table.row.end(a)
}
a<-table.end(a)
table.save(a,file='mytable2.tab')