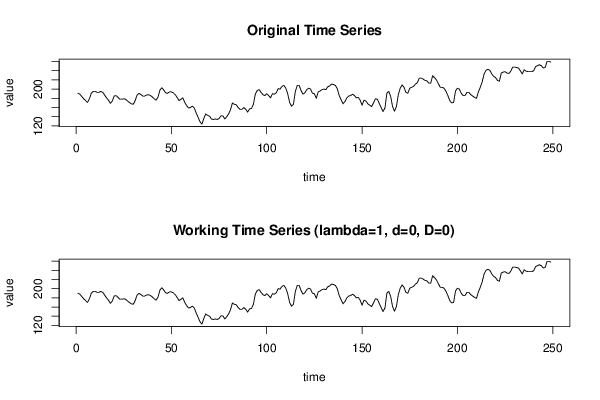
Free Statistics

of Irreproducible Research!

Author's title

Author*The author of this computation has been verified*
R Software Modulerwasp_autocorrelation.wasp
Title produced by software(Partial) Autocorrelation Function
Date of computationThu, 26 Nov 2015 11:55:16 +0000
Cite this page as followsStatistical Computations at FreeStatistics.org, Office for Research Development and Education, URL https://freestatistics.org/blog/index.php?v=date/2015/Nov/26/t1448538951wq7c7n19r6e2yh6.htm/, Retrieved Mon, 13 May 2024 21:05:55 +0000
Statistical Computations at FreeStatistics.org, Office for Research Development and Education, URL https://freestatistics.org/blog/index.php?pk=284193, Retrieved Mon, 13 May 2024 21:05:55 +0000
QR Codes:

Original text written by user:
IsPrivate?No (this computation is public)
User-defined keywords
Estimated Impact118
Family? (F = Feedback message, R = changed R code, M = changed R Module, P = changed Parameters, D = changed Data)
-     [Central Tendency] [Arabica Price in ...] [2008-01-06 21:28:17] [74be16979710d4c4e7c6647856088456]
- R  D  [Central Tendency] [Rekenkundig gemid...] [2015-11-25 11:25:04] [2e6b1bdc398efa0639617f5108875d85]
- RMPD      [(Partial) Autocorrelation Function] [Partiele correlat...] [2015-11-26 11:55:16] [417cd1fa2ccbc3df120e1b65b71e6aee] [Current]
Feedback Forum

Post a new message
Dataseries X:
191
189
184
179
175
171
179
191
195
195
193
193
195
193
187
181
176
169
174
185
186
182
178
178
179
178
174
171
168
167
175
187
191
188
185
185
187
188
186
183
179
176
183
198
203
198
192
191
194
194
192
188
182
175
178
181
171
164
159
160
163
159
148
139
129
124
136
146
143
141
135
134
135
134
136
142
142
135
140
146
155
170
167
166
160
156
156
160
156
150
157
158
167
189
197
199
193
188
186
190
186
181
190
189
192
201
200
206
208
202
190
171
163
167
195
208
208
197
189
192
199
202
200
191
190
180
194
196
199
200
199
205
207
211
210
208
201
186
177
168
173
181
185
186
189
186
181
182
176
165
176
174
168
165
162
170
179
178
169
160
151
159
191
195
184
162
152
162
188
202
209
204
193
191
202
204
206
211
214
224
224
222
219
218
213
213
229
225
220
212
204
204
202
195
186
175
170
171
196
202
200
191
186
186
193
193
188
185
182
180
194
204
216
233
241
243
241
233
228
225
219
217
235
237
238
235
234
239
248
248
247
246
240
233
242
239
238
238
238
240
249
251
253
251
246
247
260
260
259


Summary of computational transaction
Raw Inputview raw input (R code)
Raw Outputview raw output of R engine
Computing time1 seconds
R Server'Gwilym Jenkins' @ jenkins.wessa.net

\begin{tabular}{lllllllll}
\hline
Summary of computational transaction \tabularnewline
Raw Input & view raw input (R code)  \tabularnewline
Raw Output & view raw output of R engine  \tabularnewline
Computing time & 1 seconds \tabularnewline
R Server & 'Gwilym Jenkins' @ jenkins.wessa.net \tabularnewline
\hline
\end{tabular}
%Source: https://freestatistics.org/blog/index.php?pk=284193&T=0

[TABLE]
[ROW][C]Summary of computational transaction[/C][/ROW]
[ROW][C]Raw Input[/C][C]view raw input (R code) [/C][/ROW]
[ROW][C]Raw Output[/C][C]view raw output of R engine [/C][/ROW]
[ROW][C]Computing time[/C][C]1 seconds[/C][/ROW]
[ROW][C]R Server[/C][C]'Gwilym Jenkins' @ jenkins.wessa.net[/C][/ROW]
[/TABLE]
Source: https://freestatistics.org/blog/index.php?pk=284193&T=0

Globally Unique Identifier (entire table): ba.freestatistics.org/blog/index.php?pk=284193&T=0

As an alternative you can also use a QR Code:  

The GUIDs for individual cells are displayed in the table below:

Summary of computational transaction
Raw Inputview raw input (R code)
Raw Outputview raw output of R engine
Computing time1 seconds
R Server'Gwilym Jenkins' @ jenkins.wessa.net


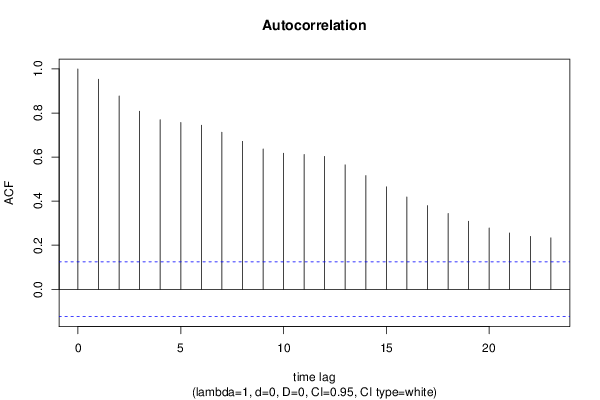
Autocorrelation Function
Time lag kACF(k)T-STATP-value
10.9533515.04360
20.87707413.840
30.80805412.75090
40.769612.14410
50.75688711.94350
60.74422211.74360
70.71277111.24730
80.67144110.59520
90.63698610.05150
100.6173689.74190
110.6118139.65420
120.6031079.51690
130.5645718.90880
140.5159398.14140
150.4648267.33480
160.4189436.61080
170.3797965.99310
180.3438015.42510
190.308684.87091e-06
200.2780714.38798e-06
210.2553724.02973.7e-05
220.2399983.78719.6e-05
230.2334973.68450.000141

\begin{tabular}{lllllllll}
\hline
Autocorrelation Function \tabularnewline
Time lag k & ACF(k) & T-STAT & P-value \tabularnewline
1 & 0.95335 & 15.0436 & 0 \tabularnewline
2 & 0.877074 & 13.84 & 0 \tabularnewline
3 & 0.808054 & 12.7509 & 0 \tabularnewline
4 & 0.7696 & 12.1441 & 0 \tabularnewline
5 & 0.756887 & 11.9435 & 0 \tabularnewline
6 & 0.744222 & 11.7436 & 0 \tabularnewline
7 & 0.712771 & 11.2473 & 0 \tabularnewline
8 & 0.671441 & 10.5952 & 0 \tabularnewline
9 & 0.636986 & 10.0515 & 0 \tabularnewline
10 & 0.617368 & 9.7419 & 0 \tabularnewline
11 & 0.611813 & 9.6542 & 0 \tabularnewline
12 & 0.603107 & 9.5169 & 0 \tabularnewline
13 & 0.564571 & 8.9088 & 0 \tabularnewline
14 & 0.515939 & 8.1414 & 0 \tabularnewline
15 & 0.464826 & 7.3348 & 0 \tabularnewline
16 & 0.418943 & 6.6108 & 0 \tabularnewline
17 & 0.379796 & 5.9931 & 0 \tabularnewline
18 & 0.343801 & 5.4251 & 0 \tabularnewline
19 & 0.30868 & 4.8709 & 1e-06 \tabularnewline
20 & 0.278071 & 4.3879 & 8e-06 \tabularnewline
21 & 0.255372 & 4.0297 & 3.7e-05 \tabularnewline
22 & 0.239998 & 3.7871 & 9.6e-05 \tabularnewline
23 & 0.233497 & 3.6845 & 0.000141 \tabularnewline
\hline
\end{tabular}
%Source: https://freestatistics.org/blog/index.php?pk=284193&T=1

[TABLE]
[ROW][C]Autocorrelation Function[/C][/ROW]
[ROW][C]Time lag k[/C][C]ACF(k)[/C][C]T-STAT[/C][C]P-value[/C][/ROW]
[ROW][C]1[/C][C]0.95335[/C][C]15.0436[/C][C]0[/C][/ROW]
[ROW][C]2[/C][C]0.877074[/C][C]13.84[/C][C]0[/C][/ROW]
[ROW][C]3[/C][C]0.808054[/C][C]12.7509[/C][C]0[/C][/ROW]
[ROW][C]4[/C][C]0.7696[/C][C]12.1441[/C][C]0[/C][/ROW]
[ROW][C]5[/C][C]0.756887[/C][C]11.9435[/C][C]0[/C][/ROW]
[ROW][C]6[/C][C]0.744222[/C][C]11.7436[/C][C]0[/C][/ROW]
[ROW][C]7[/C][C]0.712771[/C][C]11.2473[/C][C]0[/C][/ROW]
[ROW][C]8[/C][C]0.671441[/C][C]10.5952[/C][C]0[/C][/ROW]
[ROW][C]9[/C][C]0.636986[/C][C]10.0515[/C][C]0[/C][/ROW]
[ROW][C]10[/C][C]0.617368[/C][C]9.7419[/C][C]0[/C][/ROW]
[ROW][C]11[/C][C]0.611813[/C][C]9.6542[/C][C]0[/C][/ROW]
[ROW][C]12[/C][C]0.603107[/C][C]9.5169[/C][C]0[/C][/ROW]
[ROW][C]13[/C][C]0.564571[/C][C]8.9088[/C][C]0[/C][/ROW]
[ROW][C]14[/C][C]0.515939[/C][C]8.1414[/C][C]0[/C][/ROW]
[ROW][C]15[/C][C]0.464826[/C][C]7.3348[/C][C]0[/C][/ROW]
[ROW][C]16[/C][C]0.418943[/C][C]6.6108[/C][C]0[/C][/ROW]
[ROW][C]17[/C][C]0.379796[/C][C]5.9931[/C][C]0[/C][/ROW]
[ROW][C]18[/C][C]0.343801[/C][C]5.4251[/C][C]0[/C][/ROW]
[ROW][C]19[/C][C]0.30868[/C][C]4.8709[/C][C]1e-06[/C][/ROW]
[ROW][C]20[/C][C]0.278071[/C][C]4.3879[/C][C]8e-06[/C][/ROW]
[ROW][C]21[/C][C]0.255372[/C][C]4.0297[/C][C]3.7e-05[/C][/ROW]
[ROW][C]22[/C][C]0.239998[/C][C]3.7871[/C][C]9.6e-05[/C][/ROW]
[ROW][C]23[/C][C]0.233497[/C][C]3.6845[/C][C]0.000141[/C][/ROW]
[/TABLE]
Source: https://freestatistics.org/blog/index.php?pk=284193&T=1

Globally Unique Identifier (entire table): ba.freestatistics.org/blog/index.php?pk=284193&T=1

As an alternative you can also use a QR Code:  

The GUIDs for individual cells are displayed in the table below:

Autocorrelation Function
Time lag kACF(k)T-STATP-value
10.9533515.04360
20.87707413.840
30.80805412.75090
40.769612.14410
50.75688711.94350
60.74422211.74360
70.71277111.24730
80.67144110.59520
90.63698610.05150
100.6173689.74190
110.6118139.65420
120.6031079.51690
130.5645718.90880
140.5159398.14140
150.4648267.33480
160.4189436.61080
170.3797965.99310
180.3438015.42510
190.308684.87091e-06
200.2780714.38798e-06
210.2553724.02973.7e-05
220.2399983.78719.6e-05
230.2334973.68450.000141


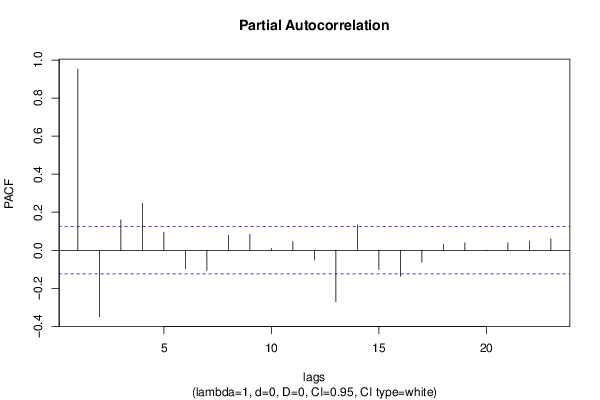
Partial Autocorrelation Function
Time lag kPACF(k)T-STATP-value
10.9533515.04360
2-0.348991-5.5070
30.1598792.52290.006132
40.2477223.9096e-05
50.095121.5010.067316
6-0.097951-1.54560.06173
7-0.105952-1.67190.047901
80.0775281.22340.111172
90.0835381.31820.094323
100.0089680.14150.443787
110.0466010.73530.23141
12-0.051402-0.81110.209038
13-0.270309-4.26541.4e-05
140.1327062.09410.018633
15-0.101043-1.59440.056055
16-0.137207-2.16510.015665
17-0.06237-0.98420.162991
180.031160.49170.311684
190.0393320.62070.267699
20-0.00217-0.03420.486357
210.0398460.62880.265041
220.0492430.7770.218934
230.0605960.95620.169953

\begin{tabular}{lllllllll}
\hline
Partial Autocorrelation Function \tabularnewline
Time lag k & PACF(k) & T-STAT & P-value \tabularnewline
1 & 0.95335 & 15.0436 & 0 \tabularnewline
2 & -0.348991 & -5.507 & 0 \tabularnewline
3 & 0.159879 & 2.5229 & 0.006132 \tabularnewline
4 & 0.247722 & 3.909 & 6e-05 \tabularnewline
5 & 0.09512 & 1.501 & 0.067316 \tabularnewline
6 & -0.097951 & -1.5456 & 0.06173 \tabularnewline
7 & -0.105952 & -1.6719 & 0.047901 \tabularnewline
8 & 0.077528 & 1.2234 & 0.111172 \tabularnewline
9 & 0.083538 & 1.3182 & 0.094323 \tabularnewline
10 & 0.008968 & 0.1415 & 0.443787 \tabularnewline
11 & 0.046601 & 0.7353 & 0.23141 \tabularnewline
12 & -0.051402 & -0.8111 & 0.209038 \tabularnewline
13 & -0.270309 & -4.2654 & 1.4e-05 \tabularnewline
14 & 0.132706 & 2.0941 & 0.018633 \tabularnewline
15 & -0.101043 & -1.5944 & 0.056055 \tabularnewline
16 & -0.137207 & -2.1651 & 0.015665 \tabularnewline
17 & -0.06237 & -0.9842 & 0.162991 \tabularnewline
18 & 0.03116 & 0.4917 & 0.311684 \tabularnewline
19 & 0.039332 & 0.6207 & 0.267699 \tabularnewline
20 & -0.00217 & -0.0342 & 0.486357 \tabularnewline
21 & 0.039846 & 0.6288 & 0.265041 \tabularnewline
22 & 0.049243 & 0.777 & 0.218934 \tabularnewline
23 & 0.060596 & 0.9562 & 0.169953 \tabularnewline
\hline
\end{tabular}
%Source: https://freestatistics.org/blog/index.php?pk=284193&T=2

[TABLE]
[ROW][C]Partial Autocorrelation Function[/C][/ROW]
[ROW][C]Time lag k[/C][C]PACF(k)[/C][C]T-STAT[/C][C]P-value[/C][/ROW]
[ROW][C]1[/C][C]0.95335[/C][C]15.0436[/C][C]0[/C][/ROW]
[ROW][C]2[/C][C]-0.348991[/C][C]-5.507[/C][C]0[/C][/ROW]
[ROW][C]3[/C][C]0.159879[/C][C]2.5229[/C][C]0.006132[/C][/ROW]
[ROW][C]4[/C][C]0.247722[/C][C]3.909[/C][C]6e-05[/C][/ROW]
[ROW][C]5[/C][C]0.09512[/C][C]1.501[/C][C]0.067316[/C][/ROW]
[ROW][C]6[/C][C]-0.097951[/C][C]-1.5456[/C][C]0.06173[/C][/ROW]
[ROW][C]7[/C][C]-0.105952[/C][C]-1.6719[/C][C]0.047901[/C][/ROW]
[ROW][C]8[/C][C]0.077528[/C][C]1.2234[/C][C]0.111172[/C][/ROW]
[ROW][C]9[/C][C]0.083538[/C][C]1.3182[/C][C]0.094323[/C][/ROW]
[ROW][C]10[/C][C]0.008968[/C][C]0.1415[/C][C]0.443787[/C][/ROW]
[ROW][C]11[/C][C]0.046601[/C][C]0.7353[/C][C]0.23141[/C][/ROW]
[ROW][C]12[/C][C]-0.051402[/C][C]-0.8111[/C][C]0.209038[/C][/ROW]
[ROW][C]13[/C][C]-0.270309[/C][C]-4.2654[/C][C]1.4e-05[/C][/ROW]
[ROW][C]14[/C][C]0.132706[/C][C]2.0941[/C][C]0.018633[/C][/ROW]
[ROW][C]15[/C][C]-0.101043[/C][C]-1.5944[/C][C]0.056055[/C][/ROW]
[ROW][C]16[/C][C]-0.137207[/C][C]-2.1651[/C][C]0.015665[/C][/ROW]
[ROW][C]17[/C][C]-0.06237[/C][C]-0.9842[/C][C]0.162991[/C][/ROW]
[ROW][C]18[/C][C]0.03116[/C][C]0.4917[/C][C]0.311684[/C][/ROW]
[ROW][C]19[/C][C]0.039332[/C][C]0.6207[/C][C]0.267699[/C][/ROW]
[ROW][C]20[/C][C]-0.00217[/C][C]-0.0342[/C][C]0.486357[/C][/ROW]
[ROW][C]21[/C][C]0.039846[/C][C]0.6288[/C][C]0.265041[/C][/ROW]
[ROW][C]22[/C][C]0.049243[/C][C]0.777[/C][C]0.218934[/C][/ROW]
[ROW][C]23[/C][C]0.060596[/C][C]0.9562[/C][C]0.169953[/C][/ROW]
[/TABLE]
Source: https://freestatistics.org/blog/index.php?pk=284193&T=2

Globally Unique Identifier (entire table): ba.freestatistics.org/blog/index.php?pk=284193&T=2

As an alternative you can also use a QR Code:  

The GUIDs for individual cells are displayed in the table below:

Partial Autocorrelation Function
Time lag kPACF(k)T-STATP-value
10.9533515.04360
2-0.348991-5.5070
30.1598792.52290.006132
40.2477223.9096e-05
50.095121.5010.067316
6-0.097951-1.54560.06173
7-0.105952-1.67190.047901
80.0775281.22340.111172
90.0835381.31820.094323
100.0089680.14150.443787
110.0466010.73530.23141
12-0.051402-0.81110.209038
13-0.270309-4.26541.4e-05
140.1327062.09410.018633
15-0.101043-1.59440.056055
16-0.137207-2.16510.015665
17-0.06237-0.98420.162991
180.031160.49170.311684
190.0393320.62070.267699
20-0.00217-0.03420.486357
210.0398460.62880.265041
220.0492430.7770.218934
230.0605960.95620.169953


Parameters (Session):
par1 = 12 ;
Parameters (R input):
par1 = Default ; par2 = 1 ; par3 = 0 ; par4 = 0 ; par5 = 12 ; par6 = White Noise ; par7 = 0.95 ; par8 = ;
R code (references can be found in the software module):
if (par1 == 'Default') {
par1 = 10*log10(length(x))
} else {
par1 <- as.numeric(par1)
}
par2 <- as.numeric(par2)
par3 <- as.numeric(par3)
par4 <- as.numeric(par4)
par5 <- as.numeric(par5)
if (par6 == 'White Noise') par6 <- 'white' else par6 <- 'ma'
par7 <- as.numeric(par7)
if (par8 != '') par8 <- as.numeric(par8)
ox <- x
if (par8 == '') {
if (par2 == 0) {
x <- log(x)
} else {
x <- (x ^ par2 - 1) / par2
}
} else {
x <- log(x,base=par8)
}
if (par3 > 0) x <- diff(x,lag=1,difference=par3)
if (par4 > 0) x <- diff(x,lag=par5,difference=par4)
bitmap(file='picts.png')
op <- par(mfrow=c(2,1))
plot(ox,type='l',main='Original Time Series',xlab='time',ylab='value')
if (par8=='') {
mytitle <- paste('Working Time Series (lambda=',par2,', d=',par3,', D=',par4,')',sep='')
mysub <- paste('(lambda=',par2,', d=',par3,', D=',par4,', CI=', par7, ', CI type=',par6,')',sep='')
} else {
mytitle <- paste('Working Time Series (base=',par8,', d=',par3,', D=',par4,')',sep='')
mysub <- paste('(base=',par8,', d=',par3,', D=',par4,', CI=', par7, ', CI type=',par6,')',sep='')
}
plot(x,type='l', main=mytitle,xlab='time',ylab='value')
par(op)
dev.off()
bitmap(file='pic1.png')
racf <- acf(x, par1, main='Autocorrelation', xlab='time lag', ylab='ACF', ci.type=par6, ci=par7, sub=mysub)
dev.off()
bitmap(file='pic2.png')
rpacf <- pacf(x,par1,main='Partial Autocorrelation',xlab='lags',ylab='PACF',sub=mysub)
dev.off()
(myacf <- c(racf$acf))
(mypacf <- c(rpacf$acf))
lengthx <- length(x)
sqrtn <- sqrt(lengthx)
load(file='createtable')
a<-table.start()
a<-table.row.start(a)
a<-table.element(a,'Autocorrelation Function',4,TRUE)
a<-table.row.end(a)
a<-table.row.start(a)
a<-table.element(a,'Time lag k',header=TRUE)
a<-table.element(a,hyperlink('basics.htm','ACF(k)','click here for more information about the Autocorrelation Function'),header=TRUE)
a<-table.element(a,'T-STAT',header=TRUE)
a<-table.element(a,'P-value',header=TRUE)
a<-table.row.end(a)
for (i in 2:(par1+1)) {
a<-table.row.start(a)
a<-table.element(a,i-1,header=TRUE)
a<-table.element(a,round(myacf[i],6))
mytstat <- myacf[i]*sqrtn
a<-table.element(a,round(mytstat,4))
a<-table.element(a,round(1-pt(abs(mytstat),lengthx),6))
a<-table.row.end(a)
}
a<-table.end(a)
table.save(a,file='mytable.tab')
a<-table.start()
a<-table.row.start(a)
a<-table.element(a,'Partial Autocorrelation Function',4,TRUE)
a<-table.row.end(a)
a<-table.row.start(a)
a<-table.element(a,'Time lag k',header=TRUE)
a<-table.element(a,hyperlink('basics.htm','PACF(k)','click here for more information about the Partial Autocorrelation Function'),header=TRUE)
a<-table.element(a,'T-STAT',header=TRUE)
a<-table.element(a,'P-value',header=TRUE)
a<-table.row.end(a)
for (i in 1:par1) {
a<-table.row.start(a)
a<-table.element(a,i,header=TRUE)
a<-table.element(a,round(mypacf[i],6))
mytstat <- mypacf[i]*sqrtn
a<-table.element(a,round(mytstat,4))
a<-table.element(a,round(1-pt(abs(mytstat),lengthx),6))
a<-table.row.end(a)
}
a<-table.end(a)
table.save(a,file='mytable1.tab')