Free Statistics
of Irreproducible Research!
Description of Statistical Computation | |||||||||||||||||||||||||||||||||||||||
|---|---|---|---|---|---|---|---|---|---|---|---|---|---|---|---|---|---|---|---|---|---|---|---|---|---|---|---|---|---|---|---|---|---|---|---|---|---|---|---|
| Author's title | |||||||||||||||||||||||||||||||||||||||
| Author | *The author of this computation has been verified* | ||||||||||||||||||||||||||||||||||||||
| R Software Module | rwasp_fitdistrnorm.wasp | ||||||||||||||||||||||||||||||||||||||
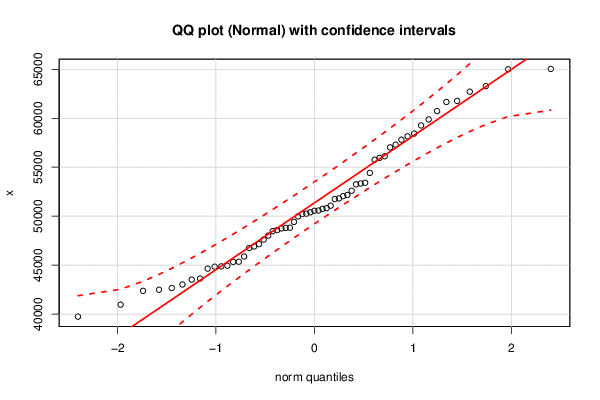
| Title produced by software | ML Fitting and QQ Plot- Normal Distribution | ||||||||||||||||||||||||||||||||||||||
| Date of computation | Thu, 26 Nov 2015 09:31:27 +0000 | ||||||||||||||||||||||||||||||||||||||
| Cite this page as follows | Statistical Computations at FreeStatistics.org, Office for Research Development and Education, URL https://freestatistics.org/blog/index.php?v=date/2015/Nov/26/t144853033558gve277knmac2d.htm/, Retrieved Tue, 14 May 2024 03:32:24 +0000 | ||||||||||||||||||||||||||||||||||||||
| Statistical Computations at FreeStatistics.org, Office for Research Development and Education, URL https://freestatistics.org/blog/index.php?pk=284175, Retrieved Tue, 14 May 2024 03:32:24 +0000 | |||||||||||||||||||||||||||||||||||||||
| QR Codes: | |||||||||||||||||||||||||||||||||||||||
|
| |||||||||||||||||||||||||||||||||||||||
| Original text written by user: | |||||||||||||||||||||||||||||||||||||||
| IsPrivate? | No (this computation is public) | ||||||||||||||||||||||||||||||||||||||
| User-defined keywords | |||||||||||||||||||||||||||||||||||||||
| Estimated Impact | 123 | ||||||||||||||||||||||||||||||||||||||
Tree of Dependent Computations | |||||||||||||||||||||||||||||||||||||||
| Family? (F = Feedback message, R = changed R code, M = changed R Module, P = changed Parameters, D = changed Data) | |||||||||||||||||||||||||||||||||||||||
| - [ML Fitting and QQ Plot- Normal Distribution] [normaal verdeling...] [2015-11-26 09:31:27] [20fcaaf1d4bc4a12bf87c6c50d624c14] [Current] - RMPD [Mean Plot] [Mean plot totaal ...] [2015-11-26 10:44:14] [22b6f4a061c8797aa483199554a73d13] - [Mean Plot] [Mean plot totaal ...] [2015-11-26 10:49:34] [22b6f4a061c8797aa483199554a73d13] - [Mean Plot] [Mean plot totaal ...] [2015-11-26 10:50:58] [22b6f4a061c8797aa483199554a73d13] - R [Mean Plot] [Mean plot totaal ...] [2015-11-26 11:00:55] [22b6f4a061c8797aa483199554a73d13] - R D [Mean Plot] [Mean plot totaal ...] [2015-11-26 11:02:48] [22b6f4a061c8797aa483199554a73d13] - RMPD [Skewness-Kurtosis Plot] [skewness - kurtos...] [2015-11-27 10:13:44] [22b6f4a061c8797aa483199554a73d13] - D [Skewness-Kurtosis Plot] [skewness - kurtos...] [2015-11-27 10:28:07] [22b6f4a061c8797aa483199554a73d13] - RM D [Skewness and Kurtosis Test] [skewness - kurtos...] [2015-11-27 10:34:49] [22b6f4a061c8797aa483199554a73d13] - R [Mean Plot] [Mean plot totaal ...] [2015-11-26 11:04:26] [22b6f4a061c8797aa483199554a73d13] - [Mean Plot] [] [2015-11-26 11:07:22] [22b6f4a061c8797aa483199554a73d13] - [Mean Plot] [Mean plot totaal ...] [2015-11-26 11:14:20] [22b6f4a061c8797aa483199554a73d13] - D [Mean Plot] [Mean plot totaal ...] [2015-11-26 11:17:19] [22b6f4a061c8797aa483199554a73d13] | |||||||||||||||||||||||||||||||||||||||
| Feedback Forum | |||||||||||||||||||||||||||||||||||||||
Post a new message | |||||||||||||||||||||||||||||||||||||||
Dataset | |||||||||||||||||||||||||||||||||||||||
| Dataseries X: | |||||||||||||||||||||||||||||||||||||||
55954 52044 49975 50398 48751 46908 44938 42372 43522 58434 62713 59266 53411 50215 48474 50250 49409 46751 44869 43023 44638 57810 65000 61665 56119 52162 51069 51744 50816 48578 47144 44839 45879 60730 65037 63281 57300 53335 51813 52597 50744 48008 45326 42661 43627 58156 61772 59879 54417 50575 48798 48819 47606 45345 42484 39735 40959 53249 57028 55763 50547 | |||||||||||||||||||||||||||||||||||||||
Tables (Output of Computation) | |||||||||||||||||||||||||||||||||||||||
| |||||||||||||||||||||||||||||||||||||||
Figures (Output of Computation) | |||||||||||||||||||||||||||||||||||||||
Input Parameters & R Code | |||||||||||||||||||||||||||||||||||||||
| Parameters (Session): | |||||||||||||||||||||||||||||||||||||||
| par1 = 8 ; par2 = 0 ; | |||||||||||||||||||||||||||||||||||||||
| Parameters (R input): | |||||||||||||||||||||||||||||||||||||||
| par1 = 8 ; par2 = 0 ; | |||||||||||||||||||||||||||||||||||||||
| R code (references can be found in the software module): | |||||||||||||||||||||||||||||||||||||||
library(MASS) | |||||||||||||||||||||||||||||||||||||||