Free Statistics
of Irreproducible Research!
Description of Statistical Computation | |||||||||||||||||||||||||||||||||||||||||||||||||||||||||||||||||||||||||||||||||||||||||||||||||||||||||
|---|---|---|---|---|---|---|---|---|---|---|---|---|---|---|---|---|---|---|---|---|---|---|---|---|---|---|---|---|---|---|---|---|---|---|---|---|---|---|---|---|---|---|---|---|---|---|---|---|---|---|---|---|---|---|---|---|---|---|---|---|---|---|---|---|---|---|---|---|---|---|---|---|---|---|---|---|---|---|---|---|---|---|---|---|---|---|---|---|---|---|---|---|---|---|---|---|---|---|---|---|---|---|---|---|---|
| Author's title | |||||||||||||||||||||||||||||||||||||||||||||||||||||||||||||||||||||||||||||||||||||||||||||||||||||||||
| Author | *The author of this computation has been verified* | ||||||||||||||||||||||||||||||||||||||||||||||||||||||||||||||||||||||||||||||||||||||||||||||||||||||||
| R Software Module | rwasp_notchedbox1.wasp | ||||||||||||||||||||||||||||||||||||||||||||||||||||||||||||||||||||||||||||||||||||||||||||||||||||||||
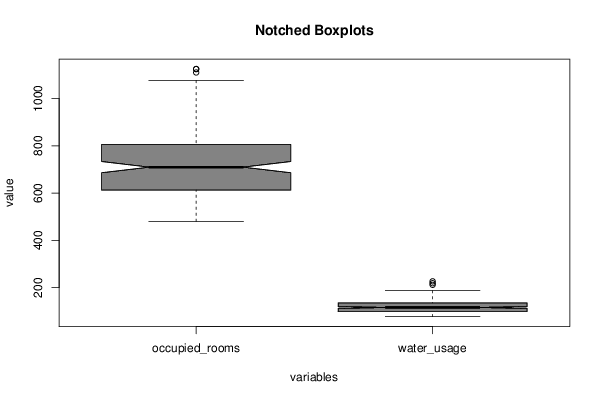
| Title produced by software | Notched Boxplots | ||||||||||||||||||||||||||||||||||||||||||||||||||||||||||||||||||||||||||||||||||||||||||||||||||||||||
| Date of computation | Sat, 21 Nov 2015 11:59:56 +0000 | ||||||||||||||||||||||||||||||||||||||||||||||||||||||||||||||||||||||||||||||||||||||||||||||||||||||||
| Cite this page as follows | Statistical Computations at FreeStatistics.org, Office for Research Development and Education, URL https://freestatistics.org/blog/index.php?v=date/2015/Nov/21/t1448107220ncryt3ac9fbw9a4.htm/, Retrieved Mon, 13 May 2024 21:18:59 +0000 | ||||||||||||||||||||||||||||||||||||||||||||||||||||||||||||||||||||||||||||||||||||||||||||||||||||||||
| Statistical Computations at FreeStatistics.org, Office for Research Development and Education, URL https://freestatistics.org/blog/index.php?pk=283758, Retrieved Mon, 13 May 2024 21:18:59 +0000 | |||||||||||||||||||||||||||||||||||||||||||||||||||||||||||||||||||||||||||||||||||||||||||||||||||||||||
| QR Codes: | |||||||||||||||||||||||||||||||||||||||||||||||||||||||||||||||||||||||||||||||||||||||||||||||||||||||||
|
| |||||||||||||||||||||||||||||||||||||||||||||||||||||||||||||||||||||||||||||||||||||||||||||||||||||||||
| Original text written by user: | |||||||||||||||||||||||||||||||||||||||||||||||||||||||||||||||||||||||||||||||||||||||||||||||||||||||||
| IsPrivate? | No (this computation is public) | ||||||||||||||||||||||||||||||||||||||||||||||||||||||||||||||||||||||||||||||||||||||||||||||||||||||||
| User-defined keywords | |||||||||||||||||||||||||||||||||||||||||||||||||||||||||||||||||||||||||||||||||||||||||||||||||||||||||
| Estimated Impact | 139 | ||||||||||||||||||||||||||||||||||||||||||||||||||||||||||||||||||||||||||||||||||||||||||||||||||||||||
Tree of Dependent Computations | |||||||||||||||||||||||||||||||||||||||||||||||||||||||||||||||||||||||||||||||||||||||||||||||||||||||||
| Family? (F = Feedback message, R = changed R code, M = changed R Module, P = changed Parameters, D = changed Data) | |||||||||||||||||||||||||||||||||||||||||||||||||||||||||||||||||||||||||||||||||||||||||||||||||||||||||
| - [Notched Boxplots] [] [2015-11-21 11:59:56] [11e09077693c238f0a6e6f4d2cf77105] [Current] | |||||||||||||||||||||||||||||||||||||||||||||||||||||||||||||||||||||||||||||||||||||||||||||||||||||||||
| Feedback Forum | |||||||||||||||||||||||||||||||||||||||||||||||||||||||||||||||||||||||||||||||||||||||||||||||||||||||||
Post a new message | |||||||||||||||||||||||||||||||||||||||||||||||||||||||||||||||||||||||||||||||||||||||||||||||||||||||||
Dataset | |||||||||||||||||||||||||||||||||||||||||||||||||||||||||||||||||||||||||||||||||||||||||||||||||||||||||
| Dataseries X: | |||||||||||||||||||||||||||||||||||||||||||||||||||||||||||||||||||||||||||||||||||||||||||||||||||||||||
501 NA 488 NA 504 NA 578 NA 545 NA 632 NA 728 NA 725 NA 585 NA 542 NA 480 NA 530 NA 518 NA 489 NA 528 NA 599 NA 572 NA 659 NA 739 NA 758 NA 602 NA 587 NA 497 NA 558 NA 555 NA 523 NA 532 NA 623 NA 598 NA 683 NA 774 NA 780 NA 609 NA 604 NA 531 NA 592 NA 578 76.83 543 77.74 565 80.47 648 79.56 615 82.28 697 100.92 785 113.2 830 90.92 645 86.83 643 82.74 551 83.65 606 80.92 585 83.19 553 83.65 576 83.65 665 83.65 656 86.83 720 100.47 826 91.38 838 101.38 652 95.92 661 88.19 584 88.19 644 80.47 623 80.92 553 79.56 599 80.92 657 88.19 680 91.83 759 96.38 878 97.29 881 102.29 705 99.1 684 92.74 577 87.29 656 85.47 645 91.38 593 92.74 617 89.56 686 88.65 679 93.2 773 99.56 906 109.11 934 124.56 713 115.47 710 96.38 600 92.29 676 86.83 645 87.29 602 85.92 601 85.92 709 88.65 706 91.83 817 112.29 930 101.83 983 125.02 745 102.74 735 95.01 620 91.83 698 86.38 665 87.29 626 88.19 649 89.1 740 89.1 729 103.65 824 127.75 937 125.47 994 125.47 781 109.11 759 100.01 643 95.01 728 85.01 691 86.83 649 86.83 656 86.83 735 86.83 748 100.47 837 111.38 995 105.47 1040 102.74 809 105.01 793 96.38 692 94.1 763 86.83 723 92.74 655 93.2 658 95.47 761 96.38 768 99.56 885 120.47 1067 123.2 1038 114.11 812 120.93 790 102.74 692 101.83 782 95.47 758 100.01 709 100.01 715 98.2 788 100.01 794 103.65 893 114.56 1046 134.11 1075 131.84 812 113.65 822 107.29 714 102.29 802 94.56 748 97.29 731 98.2 748 95.47 827 100.47 788 116.38 937 117.29 1076 140.93 1125 120.02 840 111.38 864 108.65 717 105.92 813 99.1 811 101.83 732 102.74 745 102.74 844 105.47 833 108.65 935 139.57 1110 110.47 1124 118.65 868 120.02 860 109.11 762 108.2 877 101.38 NA 106.38 NA 108.65 NA 107.74 NA 105.92 NA 129.56 NA 139.11 NA 125.93 NA 123.65 NA 118.65 NA 110.47 NA 110.02 NA 100.47 NA 104.1 NA 106.6 NA 105.5 NA 107.5 NA 117.9 NA 136.3 NA 156.8 NA 135.8 NA 130 NA 117.5 NA 115.8 NA 105.5 NA 111.6 NA 113.2 NA 113.1 NA 112.5 NA 120 NA 147.6 NA 149.9 NA 131.2 NA 134.6 NA 122.2 NA 117.7 NA 106.8 NA 111.5 NA 111.3 NA 109.5 NA 112.1 NA 127 NA 135.9 NA 150.4 NA 135.6 NA 134.9 NA 124.1 NA 120.8 NA 112.8 NA 117.4 NA 118.6 NA 119.2 NA 119.7 NA 128.6 NA 142.8 NA 170 NA 145.9 NA 140.1 NA 128.7 NA 123.4 NA 114.6 NA 120.2 NA 122 NA 121.3 NA 123.2 NA 141.1 NA 129.7 NA 152.4 NA 141.9 NA 137 NA 129 NA 124.6 NA 117.3 NA 122.7 NA 121 NA 122 NA 122 NA 126.3 NA 158.1 NA 164.9 NA 143.3 NA 151.4 NA 136.8 NA 133.1 NA 124.8 NA 132.6 NA 130.2 NA 129.6 NA 129.7 NA 133.7 NA 148.3 NA 155.1 NA 157.2 NA 147.2 NA 142.7 NA 135.9 NA 123.8 NA 132.3 NA 132.7 NA 130.7 NA 129.9 NA 145.5 NA 156.6 NA 161.7 NA 156 NA 146.1 NA 136.8 NA 132.5 NA 129.5 NA 129.5 NA 134.7 NA 136.6 NA 138.4 NA 149.6 NA 159.5 NA 171.4 NA 162.1 NA 163.1 NA 152.4 NA 145.5 NA 133.9 NA 136.6 NA 139.4 NA 141.2 NA 144.9 NA 181.4 NA 187 NA 211.4 NA 178.1 NA 168 NA 154.4 NA 150.4 NA 139.4 NA 144.7 NA 143 NA 148.3 NA 152.7 NA 173.3 NA 226.3 NA 218.2 NA 184.6 NA 174.9 NA 161.4 NA 161.4 NA 145.8 | |||||||||||||||||||||||||||||||||||||||||||||||||||||||||||||||||||||||||||||||||||||||||||||||||||||||||
Tables (Output of Computation) | |||||||||||||||||||||||||||||||||||||||||||||||||||||||||||||||||||||||||||||||||||||||||||||||||||||||||
| |||||||||||||||||||||||||||||||||||||||||||||||||||||||||||||||||||||||||||||||||||||||||||||||||||||||||
Figures (Output of Computation) | |||||||||||||||||||||||||||||||||||||||||||||||||||||||||||||||||||||||||||||||||||||||||||||||||||||||||
Input Parameters & R Code | |||||||||||||||||||||||||||||||||||||||||||||||||||||||||||||||||||||||||||||||||||||||||||||||||||||||||
| Parameters (Session): | |||||||||||||||||||||||||||||||||||||||||||||||||||||||||||||||||||||||||||||||||||||||||||||||||||||||||
| Parameters (R input): | |||||||||||||||||||||||||||||||||||||||||||||||||||||||||||||||||||||||||||||||||||||||||||||||||||||||||
| par1 = grey ; | |||||||||||||||||||||||||||||||||||||||||||||||||||||||||||||||||||||||||||||||||||||||||||||||||||||||||
| R code (references can be found in the software module): | |||||||||||||||||||||||||||||||||||||||||||||||||||||||||||||||||||||||||||||||||||||||||||||||||||||||||
z <- as.data.frame(t(y)) | |||||||||||||||||||||||||||||||||||||||||||||||||||||||||||||||||||||||||||||||||||||||||||||||||||||||||