Free Statistics
of Irreproducible Research!
Description of Statistical Computation | |||||||||||||||||||||||||||||||||||||||
|---|---|---|---|---|---|---|---|---|---|---|---|---|---|---|---|---|---|---|---|---|---|---|---|---|---|---|---|---|---|---|---|---|---|---|---|---|---|---|---|
| Author's title | |||||||||||||||||||||||||||||||||||||||
| Author | *The author of this computation has been verified* | ||||||||||||||||||||||||||||||||||||||
| R Software Module | rwasp_fitdistrnorm.wasp | ||||||||||||||||||||||||||||||||||||||
| Title produced by software | ML Fitting and QQ Plot- Normal Distribution | ||||||||||||||||||||||||||||||||||||||
| Date of computation | Sat, 21 Nov 2015 11:00:57 +0000 | ||||||||||||||||||||||||||||||||||||||
| Cite this page as follows | Statistical Computations at FreeStatistics.org, Office for Research Development and Education, URL https://freestatistics.org/blog/index.php?v=date/2015/Nov/21/t1448103808gjw08ykzqy8xwds.htm/, Retrieved Thu, 17 Jul 2025 02:32:57 +0000 | ||||||||||||||||||||||||||||||||||||||
| Statistical Computations at FreeStatistics.org, Office for Research Development and Education, URL https://freestatistics.org/blog/index.php?pk=283746, Retrieved Thu, 17 Jul 2025 02:32:57 +0000 | |||||||||||||||||||||||||||||||||||||||
| QR Codes: | |||||||||||||||||||||||||||||||||||||||
|
| |||||||||||||||||||||||||||||||||||||||
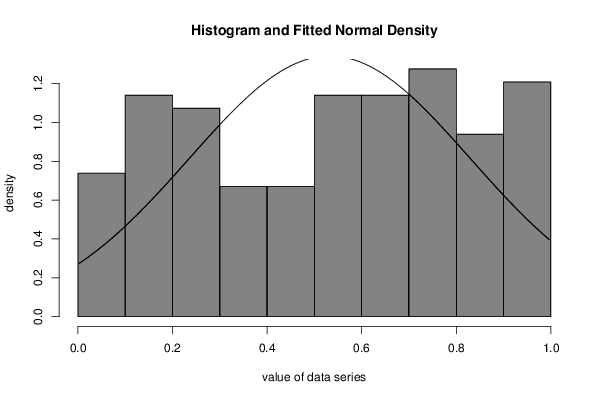
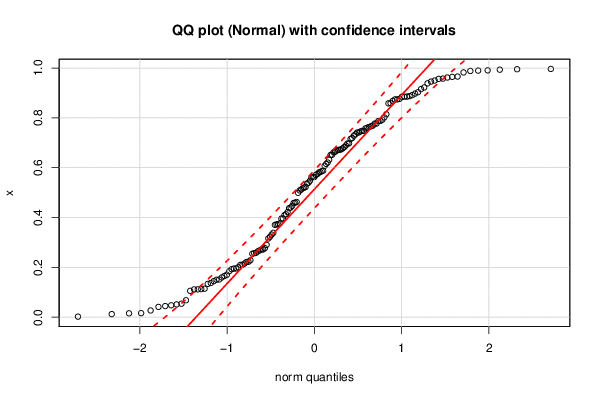
| Original text written by user: | op het histogram zie je duidelijk dat de kolommen geen normaal verdeling volgen. Ze liggen links ver boven de lijn van de Gausscurve. In het midden liggen ze hier te ver onder en rechts weer te ver boven. Dit is ook af te lezen in de QQ plot waar in het midden de "bolletjes" de zijlijnen van de St.Dev raken. Ook in het begin en het einde zien we bolletjes verder uit elkaar liggen wat mogelijk wijst op outliers. | ||||||||||||||||||||||||||||||||||||||
| IsPrivate? | No (this computation is public) | ||||||||||||||||||||||||||||||||||||||
| User-defined keywords | |||||||||||||||||||||||||||||||||||||||
| Estimated Impact | 210 | ||||||||||||||||||||||||||||||||||||||
Tree of Dependent Computations | |||||||||||||||||||||||||||||||||||||||
| Family? (F = Feedback message, R = changed R code, M = changed R Module, P = changed Parameters, D = changed Data) | |||||||||||||||||||||||||||||||||||||||
| - [ML Fitting and QQ Plot- Normal Distribution] [3.1 distribution ...] [2015-11-21 11:00:57] [bfb327cc38fccc6d3daed2ac8fd9ce3b] [Current] | |||||||||||||||||||||||||||||||||||||||
| Feedback Forum | |||||||||||||||||||||||||||||||||||||||
Post a new message | |||||||||||||||||||||||||||||||||||||||
Dataset | |||||||||||||||||||||||||||||||||||||||
| Dataseries X: | |||||||||||||||||||||||||||||||||||||||
0.3161301156 0.6078782729 0.5807415964 0.04478256614 0.6153942423 0.5124572554 0.8763627375 0.5864659851 0.6739818082 0.9965267168 0.8854597702 0.9898681595 0.5224891355 0.5630557686 0.9934985442 0.02713052156 0.1503894108 0.6209043376 0.4596013467 0.1372563126 0.887349773 0.7772728983 0.3388797929 0.6970761439 0.741579788 0.9621838237 0.1117987729 0.8742447849 0.195211008 0.8849938098 0.520571733 0.5622692445 0.9567078596 0.3229375306 0.1125871615 0.8975680948 0.1703098689 0.7417026203 0.9908663936 0.8585621178 0.5825049468 0.7480359165 0.2715526375 0.4467960157 0.1655341164 0.8743808061 0.7484311841 0.9500915928 0.6979273152 0.1955460413 0.2644808975 0.7877320015 0.8020705945 0.2774055992 0.2904570985 0.4376773408 0.9388044983 0.9576299355 0.2105054746 0.9458115564 0.859053675 0.4584484474 0.8148073839 0.5172204111 0.01248780326 0.3314431211 0.4992563193 0.6895008461 0.4132137057 0.7343734927 0.6721657961 0.5881015761 0.4624987616 0.5400329135 0.8680082064 0.7636949113 0.2285254777 0.7771359343 0.06818518653 0.1115798292 0.6831774781 0.9032370246 0.7288291001 0.3731162719 0.3958565913 0.4096805296 0.01563581011 0.7191907829 0.1843312229 0.2585818574 0.745728687 0.9157132962 0.222615975 0.6518399645 0.5365538747 0.5711452035 0.1058826543 0.6321810266 0.6618067788 0.9660586642 0.3724022596 0.01623337691 0.1143898863 0.9647272675 0.9825184772 0.15963378 0.3764017186 0.5087477589 0.2546522596 0.05416476412 0.3961571164 0.1926931785 0.7583377483 0.2569234079 0.272238806 0.4217971817 0.6642893994 0.151521335 0.144580104 0.6516695351 0.05150033355 0.04131574574 0.7925788894 0.2100430916 0.6713720831 0.5746720591 0.4402429663 0.2005517323 0.6688753694 0.002257516827 0.2683665603 0.988539728 0.7607422771 0.7663661005 0.1337379674 0.7689024107 0.370689683 0.9222748573 0.9953787681 0.715957847 0.2216738426 0.8916311661 0.5478138818 0.2153499998 0.8851762463 0.04787165125 0.5613732304 0.6779830424 0.7875209169 | |||||||||||||||||||||||||||||||||||||||
Tables (Output of Computation) | |||||||||||||||||||||||||||||||||||||||
| |||||||||||||||||||||||||||||||||||||||
Figures (Output of Computation) | |||||||||||||||||||||||||||||||||||||||
Input Parameters & R Code | |||||||||||||||||||||||||||||||||||||||
| Parameters (Session): | |||||||||||||||||||||||||||||||||||||||
| par1 = 8 ; par2 = 0 ; | |||||||||||||||||||||||||||||||||||||||
| Parameters (R input): | |||||||||||||||||||||||||||||||||||||||
| par1 = 8 ; par2 = 0 ; | |||||||||||||||||||||||||||||||||||||||
| R code (references can be found in the software module): | |||||||||||||||||||||||||||||||||||||||
library(MASS) | |||||||||||||||||||||||||||||||||||||||