Free Statistics
of Irreproducible Research!
Description of Statistical Computation | |||||||||||||||||||||||||||||||||||||||||
|---|---|---|---|---|---|---|---|---|---|---|---|---|---|---|---|---|---|---|---|---|---|---|---|---|---|---|---|---|---|---|---|---|---|---|---|---|---|---|---|---|---|
| Author's title | |||||||||||||||||||||||||||||||||||||||||
| Author | *The author of this computation has been verified* | ||||||||||||||||||||||||||||||||||||||||
| R Software Module | rwasp_univariatedataseries.wasp | ||||||||||||||||||||||||||||||||||||||||
| Title produced by software | Univariate Data Series | ||||||||||||||||||||||||||||||||||||||||
| Date of computation | Sat, 21 Nov 2015 08:52:24 +0000 | ||||||||||||||||||||||||||||||||||||||||
| Cite this page as follows | Statistical Computations at FreeStatistics.org, Office for Research Development and Education, URL https://freestatistics.org/blog/index.php?v=date/2015/Nov/21/t1448096204sptpj50zkd234oq.htm/, Retrieved Tue, 14 May 2024 12:32:39 +0000 | ||||||||||||||||||||||||||||||||||||||||
| Statistical Computations at FreeStatistics.org, Office for Research Development and Education, URL https://freestatistics.org/blog/index.php?pk=283744, Retrieved Tue, 14 May 2024 12:32:39 +0000 | |||||||||||||||||||||||||||||||||||||||||
| QR Codes: | |||||||||||||||||||||||||||||||||||||||||
|
| |||||||||||||||||||||||||||||||||||||||||
| Original text written by user: | |||||||||||||||||||||||||||||||||||||||||
| IsPrivate? | No (this computation is public) | ||||||||||||||||||||||||||||||||||||||||
| User-defined keywords | drunkenness | ||||||||||||||||||||||||||||||||||||||||
| Estimated Impact | 157 | ||||||||||||||||||||||||||||||||||||||||
Tree of Dependent Computations | |||||||||||||||||||||||||||||||||||||||||
| Family? (F = Feedback message, R = changed R code, M = changed R Module, P = changed Parameters, D = changed Data) | |||||||||||||||||||||||||||||||||||||||||
| - [Univariate Data Series] [] [2015-10-04 13:08:12] [32b17a345b130fdf5cc88718ed94a974] - R PD [Univariate Data Series] [] [2015-11-21 08:52:24] [d108c84c57c191267df4a6d3f43a776a] [Current] - PD [Univariate Data Series] [] [2015-11-30 17:11:26] [0067001be1237c3bcd1f41c2117a7af9] - PD [Univariate Data Series] [] [2015-11-30 17:17:50] [0067001be1237c3bcd1f41c2117a7af9] | |||||||||||||||||||||||||||||||||||||||||
| Feedback Forum | |||||||||||||||||||||||||||||||||||||||||
Post a new message | |||||||||||||||||||||||||||||||||||||||||
Dataset | |||||||||||||||||||||||||||||||||||||||||
| Dataseries X: | |||||||||||||||||||||||||||||||||||||||||
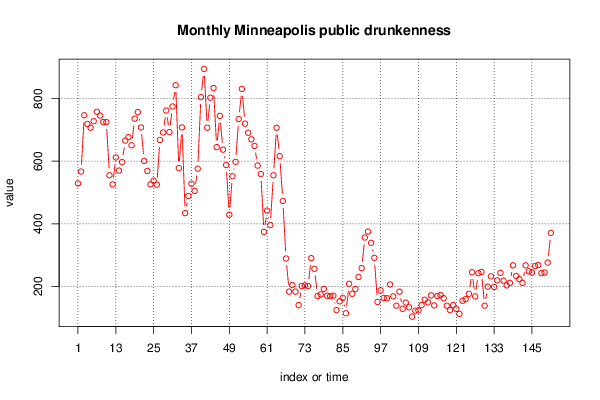
529 567 747 719 707 728 758 746 725 725 555 526 612 570 597 666 677 651 736 757 708 601 569 526 538 525 668 692 762 693 775 843 578 708 434 489 528 505 576 805 895 707 803 834 645 745 637 588 429 552 598 735 831 720 691 670 649 586 559 374 442 396 555 707 616 473 289 183 204 183 140 201 203 201 290 256 169 174 192 170 169 170 124 152 163 114 208 176 191 230 258 356 375 339 291 150 187 163 162 206 168 138 183 128 148 133 103 122 123 140 157 149 171 139 169 172 162 138 124 140 128 112 154 159 176 245 168 242 246 138 199 232 198 219 243 218 203 211 267 233 223 211 267 248 244 265 268 242 244 276 371 | |||||||||||||||||||||||||||||||||||||||||
Tables (Output of Computation) | |||||||||||||||||||||||||||||||||||||||||
| |||||||||||||||||||||||||||||||||||||||||
Figures (Output of Computation) | |||||||||||||||||||||||||||||||||||||||||
Input Parameters & R Code | |||||||||||||||||||||||||||||||||||||||||
| Parameters (Session): | |||||||||||||||||||||||||||||||||||||||||
| par1 = Monthly Minneapolis public drunkenness Jan.�66-Jul�78 ; par4 = 12 ; | |||||||||||||||||||||||||||||||||||||||||
| Parameters (R input): | |||||||||||||||||||||||||||||||||||||||||
| par1 = Monthly Minneapolis public drunkenness Jan.�66-Jul�78 ; par2 = ; par3 = ; par4 = 12 ; | |||||||||||||||||||||||||||||||||||||||||
| R code (references can be found in the software module): | |||||||||||||||||||||||||||||||||||||||||
par4 <- '12' | |||||||||||||||||||||||||||||||||||||||||