Free Statistics
of Irreproducible Research!
Description of Statistical Computation | |||||||||||||||||||||||||||||||||||||||
|---|---|---|---|---|---|---|---|---|---|---|---|---|---|---|---|---|---|---|---|---|---|---|---|---|---|---|---|---|---|---|---|---|---|---|---|---|---|---|---|
| Author's title | |||||||||||||||||||||||||||||||||||||||
| Author | *The author of this computation has been verified* | ||||||||||||||||||||||||||||||||||||||
| R Software Module | rwasp_fitdistrnorm.wasp | ||||||||||||||||||||||||||||||||||||||
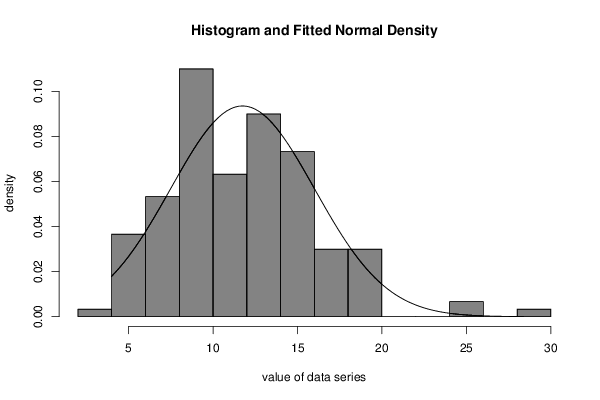
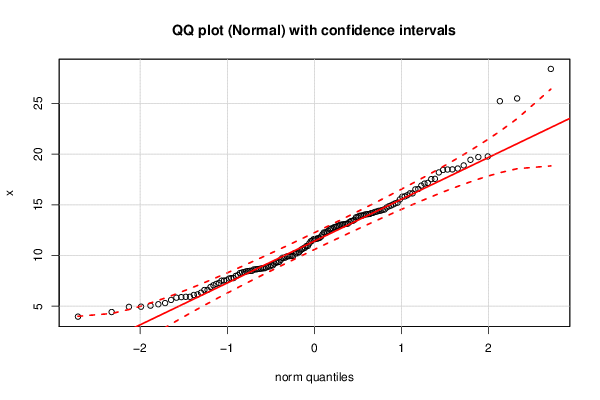
| Title produced by software | ML Fitting and QQ Plot- Normal Distribution | ||||||||||||||||||||||||||||||||||||||
| Date of computation | Tue, 17 Nov 2015 16:24:25 +0000 | ||||||||||||||||||||||||||||||||||||||
| Cite this page as follows | Statistical Computations at FreeStatistics.org, Office for Research Development and Education, URL https://freestatistics.org/blog/index.php?v=date/2015/Nov/17/t1447777495xp6qvkb4vwqcnmu.htm/, Retrieved Tue, 14 May 2024 07:09:30 +0000 | ||||||||||||||||||||||||||||||||||||||
| Statistical Computations at FreeStatistics.org, Office for Research Development and Education, URL https://freestatistics.org/blog/index.php?pk=283435, Retrieved Tue, 14 May 2024 07:09:30 +0000 | |||||||||||||||||||||||||||||||||||||||
| QR Codes: | |||||||||||||||||||||||||||||||||||||||
|
| |||||||||||||||||||||||||||||||||||||||
| Original text written by user: | |||||||||||||||||||||||||||||||||||||||
| IsPrivate? | No (this computation is public) | ||||||||||||||||||||||||||||||||||||||
| User-defined keywords | |||||||||||||||||||||||||||||||||||||||
| Estimated Impact | 129 | ||||||||||||||||||||||||||||||||||||||
Tree of Dependent Computations | |||||||||||||||||||||||||||||||||||||||
| Family? (F = Feedback message, R = changed R code, M = changed R Module, P = changed Parameters, D = changed Data) | |||||||||||||||||||||||||||||||||||||||
| - [ML Fitting and QQ Plot- Normal Distribution] [] [2015-11-17 16:24:25] [6e0f9d477fd567d092284819440de98c] [Current] | |||||||||||||||||||||||||||||||||||||||
| Feedback Forum | |||||||||||||||||||||||||||||||||||||||
Post a new message | |||||||||||||||||||||||||||||||||||||||
Dataset | |||||||||||||||||||||||||||||||||||||||
| Dataseries X: | |||||||||||||||||||||||||||||||||||||||
16.12397613 10.31865963 6.327412142 9.80578401 9.951837366 5.194309612 10.92304767 9.770865306 16.5580156 13.79091944 8.659784046 17.15716613 16.12494831 6.610393865 7.06598745 11.61202035 7.548211262 14.40036208 19.43428579 6.162734502 8.674987336 4.425714242 7.293566494 14.09082309 13.11682197 4.951441768 9.908063322 14.29423798 13.0434842 8.490017662 11.65961302 8.61978938 13.90329772 14.84770878 16.88346453 12.65241437 12.9402109 9.34090792 13.51315216 17.55561235 12.07084565 12.58234487 9.032462396 9.1975314 11.85818105 10.70664184 15.14247153 9.30800228 10.50398923 8.921575198 10.76475113 10.22089429 12.82501691 12.88168883 19.76538711 18.57169738 13.30526824 12.78887208 13.05750392 12.67440137 13.14973031 10.93785161 8.736619644 9.372571967 13.42026811 15.02746445 12.26526974 11.39769835 13.10177031 14.01304943 18.87924948 15.82335352 7.770559463 5.895286599 6.897527797 8.706570386 7.982623327 9.57623333 16.51721768 8.745788547 9.928647485 14.07521048 8.37246167 7.770182552 18.48766425 8.323825514 7.513964906 5.839567789 11.73649423 5.310672973 18.43008988 28.38914269 25.21393593 6.597148346 8.060020014 13.39750612 6.11012393 14.42141959 11.46877394 18.47547445 10.62449813 11.61526062 10.21759809 14.18361306 9.7759794 5.054637555 25.48319771 15.52954611 18.18831907 14.92345905 8.489449663 9.951781328 3.971079059 14.06253401 15.79008178 17.52377448 5.925880288 12.28178804 19.70377629 11.68298463 7.531348849 4.93463423 8.462228491 5.616868377 15.21237655 5.927698186 11.18782231 10.23059083 13.75960887 13.94018696 9.949205529 8.267957265 7.195391603 8.433023668 14.33040489 12.27041252 14.54366613 7.720944764 8.903373024 15.9373038 14.20800949 14.49510977 12.43029272 8.625831285 13.02436215 8.823521752 14.73525469 17.0808304 13.92503103 9.030924744 | |||||||||||||||||||||||||||||||||||||||
Tables (Output of Computation) | |||||||||||||||||||||||||||||||||||||||
| |||||||||||||||||||||||||||||||||||||||
Figures (Output of Computation) | |||||||||||||||||||||||||||||||||||||||
Input Parameters & R Code | |||||||||||||||||||||||||||||||||||||||
| Parameters (Session): | |||||||||||||||||||||||||||||||||||||||
| par1 = 100 ; par2 = 5 ; par3 = 1,7 ; par4 = 2 ; par5 = N ; par6 = 5 ; | |||||||||||||||||||||||||||||||||||||||
| Parameters (R input): | |||||||||||||||||||||||||||||||||||||||
| par1 = 8 ; par2 = 0 ; | |||||||||||||||||||||||||||||||||||||||
| R code (references can be found in the software module): | |||||||||||||||||||||||||||||||||||||||
library(MASS) | |||||||||||||||||||||||||||||||||||||||