Free Statistics
of Irreproducible Research!
Description of Statistical Computation | |||||||||||||||||||||||||||||||||||||||
|---|---|---|---|---|---|---|---|---|---|---|---|---|---|---|---|---|---|---|---|---|---|---|---|---|---|---|---|---|---|---|---|---|---|---|---|---|---|---|---|
| Author's title | |||||||||||||||||||||||||||||||||||||||
| Author | *The author of this computation has been verified* | ||||||||||||||||||||||||||||||||||||||
| R Software Module | rwasp_fitdistrnorm.wasp | ||||||||||||||||||||||||||||||||||||||
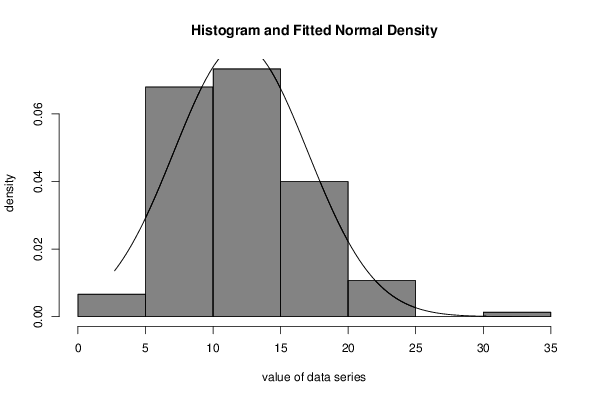
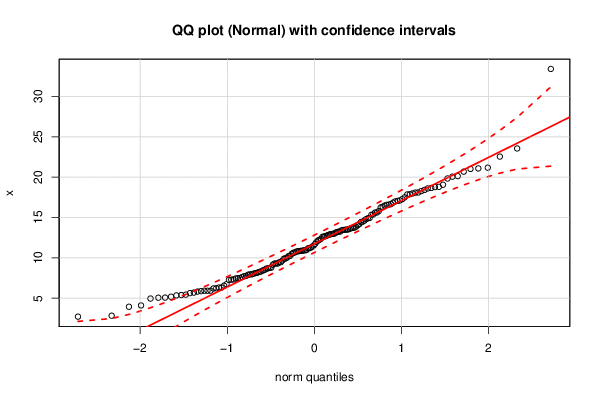
| Title produced by software | ML Fitting and QQ Plot- Normal Distribution | ||||||||||||||||||||||||||||||||||||||
| Date of computation | Tue, 17 Nov 2015 16:23:09 +0000 | ||||||||||||||||||||||||||||||||||||||
| Cite this page as follows | Statistical Computations at FreeStatistics.org, Office for Research Development and Education, URL https://freestatistics.org/blog/index.php?v=date/2015/Nov/17/t1447777436qi4sp4tbaathb9g.htm/, Retrieved Tue, 14 May 2024 08:10:58 +0000 | ||||||||||||||||||||||||||||||||||||||
| Statistical Computations at FreeStatistics.org, Office for Research Development and Education, URL https://freestatistics.org/blog/index.php?pk=283434, Retrieved Tue, 14 May 2024 08:10:58 +0000 | |||||||||||||||||||||||||||||||||||||||
| QR Codes: | |||||||||||||||||||||||||||||||||||||||
|
| |||||||||||||||||||||||||||||||||||||||
| Original text written by user: | |||||||||||||||||||||||||||||||||||||||
| IsPrivate? | No (this computation is public) | ||||||||||||||||||||||||||||||||||||||
| User-defined keywords | |||||||||||||||||||||||||||||||||||||||
| Estimated Impact | 128 | ||||||||||||||||||||||||||||||||||||||
Tree of Dependent Computations | |||||||||||||||||||||||||||||||||||||||
| Family? (F = Feedback message, R = changed R code, M = changed R Module, P = changed Parameters, D = changed Data) | |||||||||||||||||||||||||||||||||||||||
| - [ML Fitting and QQ Plot- Normal Distribution] [] [2015-11-17 16:23:09] [6e0f9d477fd567d092284819440de98c] [Current] | |||||||||||||||||||||||||||||||||||||||
| Feedback Forum | |||||||||||||||||||||||||||||||||||||||
Post a new message | |||||||||||||||||||||||||||||||||||||||
Dataset | |||||||||||||||||||||||||||||||||||||||
| Dataseries X: | |||||||||||||||||||||||||||||||||||||||
15.79081363 7.318318726 9.295490578 10.47435581 13.42386809 8.040386265 8.116269367 5.176997459 8.30260999 6.231716534 12.82578383 15.6108187 20.67932589 5.925947858 12.75091041 4.099125569 12.91025214 13.85790405 16.65009692 5.386425046 18.09785406 14.43784023 12.23611176 11.37629464 7.491802987 19.83208963 7.438139651 2.709486214 10.64913829 16.46996062 8.249890537 11.73059152 10.23561727 5.867005332 12.63634911 6.202308363 12.00073616 13.74237096 13.58546824 9.281248967 14.045406 18.59902078 18.77060074 9.447459255 13.1863225 10.74706001 15.33462694 5.816309983 9.902136928 8.748287983 23.55315188 14.79866678 18.65724526 16.56575101 10.02392045 7.719672185 8.779245984 20.054658 7.269745099 10.91739247 18.26670129 10.81760205 3.935119608 16.24154138 10.82694523 12.60149354 10.87646295 10.93352824 5.92006339 10.85051873 18.41179795 10.61187178 14.93734425 5.054566715 33.40728578 12.99661808 13.68524434 13.49423052 9.301471827 15.35989049 5.068817883 13.50496316 4.953928657 15.61501384 22.54459192 11.16399133 6.549587469 21.17226801 11.51269259 8.156951683 5.347241022 17.88038417 9.666173583 9.141228961 16.9900033 17.05269668 8.686817521 20.12124952 13.44957504 17.85377733 14.17187126 14.61113926 17.11275633 16.32871683 7.289076613 2.826686448 8.484893408 18.79773821 7.905941622 7.475529378 14.90079786 11.18929026 11.26370384 8.655595841 18.08040961 5.433611262 19.05692014 12.14213173 7.621786734 17.26525371 10.20951543 17.49820801 12.67441418 5.629306022 8.44011383 5.920648298 13.47166339 16.59138263 13.25923177 7.956141765 5.688624728 12.35080056 21.08065863 13.69734076 13.25029464 14.47386507 10.95955435 13.14003137 6.318171774 17.98116305 7.75606679 12.97413854 6.314971505 9.449664894 7.948899953 16.83885058 12.93593356 9.913491748 6.731758518 21.01849916 | |||||||||||||||||||||||||||||||||||||||
Tables (Output of Computation) | |||||||||||||||||||||||||||||||||||||||
| |||||||||||||||||||||||||||||||||||||||
Figures (Output of Computation) | |||||||||||||||||||||||||||||||||||||||
Input Parameters & R Code | |||||||||||||||||||||||||||||||||||||||
| Parameters (Session): | |||||||||||||||||||||||||||||||||||||||
| par1 = 100 ; par2 = 5 ; par3 = 1,7 ; par4 = 2 ; par5 = N ; par6 = 5 ; | |||||||||||||||||||||||||||||||||||||||
| Parameters (R input): | |||||||||||||||||||||||||||||||||||||||
| par1 = 8 ; par2 = 0 ; | |||||||||||||||||||||||||||||||||||||||
| R code (references can be found in the software module): | |||||||||||||||||||||||||||||||||||||||
library(MASS) | |||||||||||||||||||||||||||||||||||||||