Free Statistics

of Irreproducible Research!

Author's title

Author*Unverified author*
R Software Modulerwasp_hierarchicalclustering.wasp
Title produced by softwareHierarchical Clustering
Date of computationMon, 16 Nov 2015 17:14:50 +0000
Cite this page as followsStatistical Computations at FreeStatistics.org, Office for Research Development and Education, URL https://freestatistics.org/blog/index.php?v=date/2015/Nov/16/t1447694122luelj37e12gdx5v.htm/, Retrieved Thu, 16 May 2024 02:20:15 +0000
Statistical Computations at FreeStatistics.org, Office for Research Development and Education, URL https://freestatistics.org/blog/index.php?pk=283385, Retrieved Thu, 16 May 2024 02:20:15 +0000
QR Codes:

Original text written by user:
IsPrivate?No (this computation is public)
User-defined keywords
Estimated Impact109
Family? (F = Feedback message, R = changed R code, M = changed R Module, P = changed Parameters, D = changed Data)
-     [Hierarchical Clustering] [ATRIBUTOS BIOSIFI...] [2015-11-16 15:50:55] [74be16979710d4c4e7c6647856088456]
-    D    [Hierarchical Clustering] [ATRIBUTOS ESCENOG...] [2015-11-16 17:14:50] [d41d8cd98f00b204e9800998ecf8427e] [Current]
Feedback Forum

Post a new message
Dataseries X:
0.33
0.66
0.61
0.33
0.66
0.44
0.77
0.66
0.89
0.77
0.77
0.55
0.44
0.55
0.11
0.11
0.11
0.33
0.33
0.22
0.22
0.11
0.00
0.11
0.11
0.11
0.11
0.00
0.11
0.11
0.11
0.33
0.44
0.44
0.33
0.33
0.33
0.44
0.44
0.55
0.66
0.77
0.66
0.77
0.77
0.77
0.77
0.89
0.89
0.89
0.89


Summary of computational transaction
Raw Inputview raw input (R code)
Raw Outputview raw output of R engine
Computing time2 seconds
R Server'Sir Maurice George Kendall' @ kendall.wessa.net

\begin{tabular}{lllllllll}
\hline
Summary of computational transaction \tabularnewline
Raw Input & view raw input (R code)  \tabularnewline
Raw Output & view raw output of R engine  \tabularnewline
Computing time & 2 seconds \tabularnewline
R Server & 'Sir Maurice George Kendall' @ kendall.wessa.net \tabularnewline
\hline
\end{tabular}
%Source: https://freestatistics.org/blog/index.php?pk=283385&T=0

[TABLE]
[ROW][C]Summary of computational transaction[/C][/ROW]
[ROW][C]Raw Input[/C][C]view raw input (R code) [/C][/ROW]
[ROW][C]Raw Output[/C][C]view raw output of R engine [/C][/ROW]
[ROW][C]Computing time[/C][C]2 seconds[/C][/ROW]
[ROW][C]R Server[/C][C]'Sir Maurice George Kendall' @ kendall.wessa.net[/C][/ROW]
[/TABLE]
Source: https://freestatistics.org/blog/index.php?pk=283385&T=0

Globally Unique Identifier (entire table): ba.freestatistics.org/blog/index.php?pk=283385&T=0

As an alternative you can also use a QR Code:  

The GUIDs for individual cells are displayed in the table below:

Summary of computational transaction
Raw Inputview raw input (R code)
Raw Outputview raw output of R engine
Computing time2 seconds
R Server'Sir Maurice George Kendall' @ kendall.wessa.net


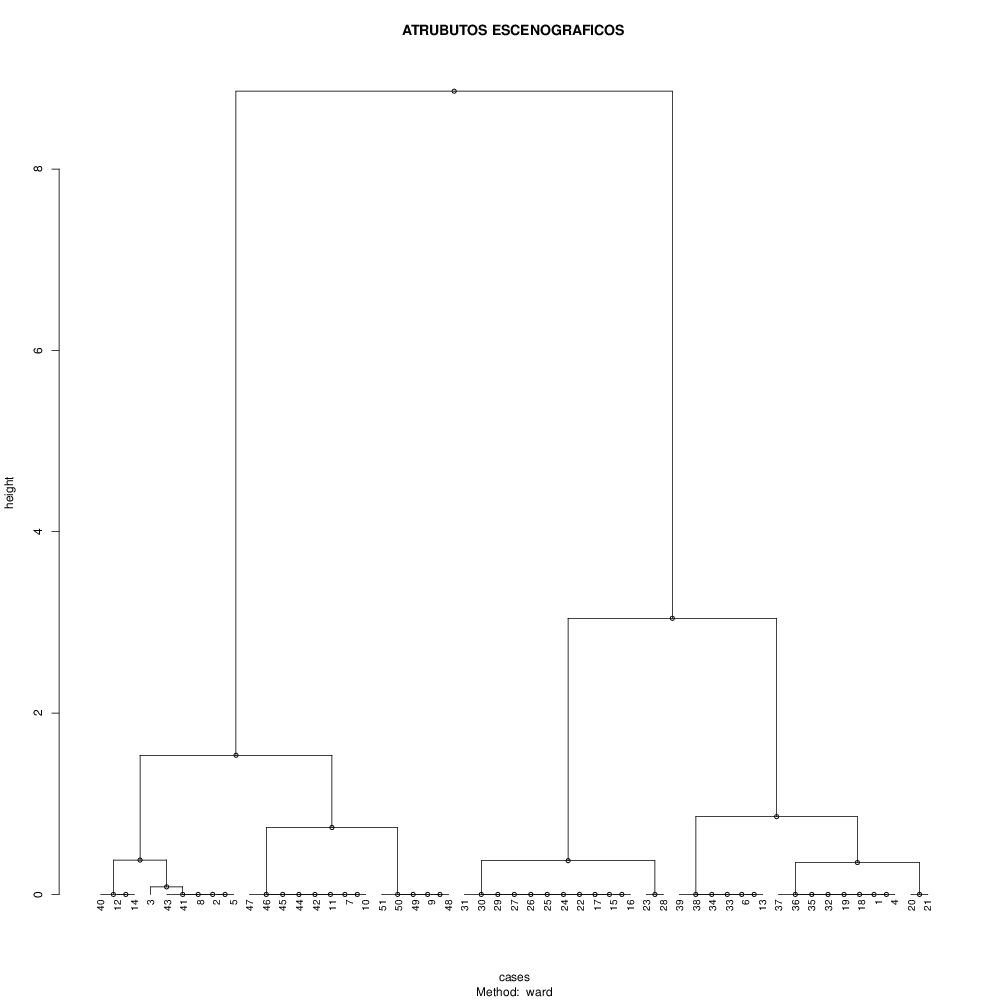
Summary of Dendrogram
LabelHeight
10
20
30
40
50
60
70
80
90
100
110
120
130
140
150
160
170
180
190
200
210
220
230
240
250
260
270
280
290
300
310
320
330
340
350
360
370
380
390
400
410
420.0833333333333334
430.352
440.372307692307692
450.378888888888889
460.738461538461538
470.858
481.53477078477078
493.04527851458886
508.85892003196263

\begin{tabular}{lllllllll}
\hline
Summary of Dendrogram \tabularnewline
Label & Height \tabularnewline
1 & 0 \tabularnewline
2 & 0 \tabularnewline
3 & 0 \tabularnewline
4 & 0 \tabularnewline
5 & 0 \tabularnewline
6 & 0 \tabularnewline
7 & 0 \tabularnewline
8 & 0 \tabularnewline
9 & 0 \tabularnewline
10 & 0 \tabularnewline
11 & 0 \tabularnewline
12 & 0 \tabularnewline
13 & 0 \tabularnewline
14 & 0 \tabularnewline
15 & 0 \tabularnewline
16 & 0 \tabularnewline
17 & 0 \tabularnewline
18 & 0 \tabularnewline
19 & 0 \tabularnewline
20 & 0 \tabularnewline
21 & 0 \tabularnewline
22 & 0 \tabularnewline
23 & 0 \tabularnewline
24 & 0 \tabularnewline
25 & 0 \tabularnewline
26 & 0 \tabularnewline
27 & 0 \tabularnewline
28 & 0 \tabularnewline
29 & 0 \tabularnewline
30 & 0 \tabularnewline
31 & 0 \tabularnewline
32 & 0 \tabularnewline
33 & 0 \tabularnewline
34 & 0 \tabularnewline
35 & 0 \tabularnewline
36 & 0 \tabularnewline
37 & 0 \tabularnewline
38 & 0 \tabularnewline
39 & 0 \tabularnewline
40 & 0 \tabularnewline
41 & 0 \tabularnewline
42 & 0.0833333333333334 \tabularnewline
43 & 0.352 \tabularnewline
44 & 0.372307692307692 \tabularnewline
45 & 0.378888888888889 \tabularnewline
46 & 0.738461538461538 \tabularnewline
47 & 0.858 \tabularnewline
48 & 1.53477078477078 \tabularnewline
49 & 3.04527851458886 \tabularnewline
50 & 8.85892003196263 \tabularnewline
\hline
\end{tabular}
%Source: https://freestatistics.org/blog/index.php?pk=283385&T=1

[TABLE]
[ROW][C]Summary of Dendrogram[/C][/ROW]
[ROW][C]Label[/C][C]Height[/C][/ROW]
[ROW][C]1[/C][C]0[/C][/ROW]
[ROW][C]2[/C][C]0[/C][/ROW]
[ROW][C]3[/C][C]0[/C][/ROW]
[ROW][C]4[/C][C]0[/C][/ROW]
[ROW][C]5[/C][C]0[/C][/ROW]
[ROW][C]6[/C][C]0[/C][/ROW]
[ROW][C]7[/C][C]0[/C][/ROW]
[ROW][C]8[/C][C]0[/C][/ROW]
[ROW][C]9[/C][C]0[/C][/ROW]
[ROW][C]10[/C][C]0[/C][/ROW]
[ROW][C]11[/C][C]0[/C][/ROW]
[ROW][C]12[/C][C]0[/C][/ROW]
[ROW][C]13[/C][C]0[/C][/ROW]
[ROW][C]14[/C][C]0[/C][/ROW]
[ROW][C]15[/C][C]0[/C][/ROW]
[ROW][C]16[/C][C]0[/C][/ROW]
[ROW][C]17[/C][C]0[/C][/ROW]
[ROW][C]18[/C][C]0[/C][/ROW]
[ROW][C]19[/C][C]0[/C][/ROW]
[ROW][C]20[/C][C]0[/C][/ROW]
[ROW][C]21[/C][C]0[/C][/ROW]
[ROW][C]22[/C][C]0[/C][/ROW]
[ROW][C]23[/C][C]0[/C][/ROW]
[ROW][C]24[/C][C]0[/C][/ROW]
[ROW][C]25[/C][C]0[/C][/ROW]
[ROW][C]26[/C][C]0[/C][/ROW]
[ROW][C]27[/C][C]0[/C][/ROW]
[ROW][C]28[/C][C]0[/C][/ROW]
[ROW][C]29[/C][C]0[/C][/ROW]
[ROW][C]30[/C][C]0[/C][/ROW]
[ROW][C]31[/C][C]0[/C][/ROW]
[ROW][C]32[/C][C]0[/C][/ROW]
[ROW][C]33[/C][C]0[/C][/ROW]
[ROW][C]34[/C][C]0[/C][/ROW]
[ROW][C]35[/C][C]0[/C][/ROW]
[ROW][C]36[/C][C]0[/C][/ROW]
[ROW][C]37[/C][C]0[/C][/ROW]
[ROW][C]38[/C][C]0[/C][/ROW]
[ROW][C]39[/C][C]0[/C][/ROW]
[ROW][C]40[/C][C]0[/C][/ROW]
[ROW][C]41[/C][C]0[/C][/ROW]
[ROW][C]42[/C][C]0.0833333333333334[/C][/ROW]
[ROW][C]43[/C][C]0.352[/C][/ROW]
[ROW][C]44[/C][C]0.372307692307692[/C][/ROW]
[ROW][C]45[/C][C]0.378888888888889[/C][/ROW]
[ROW][C]46[/C][C]0.738461538461538[/C][/ROW]
[ROW][C]47[/C][C]0.858[/C][/ROW]
[ROW][C]48[/C][C]1.53477078477078[/C][/ROW]
[ROW][C]49[/C][C]3.04527851458886[/C][/ROW]
[ROW][C]50[/C][C]8.85892003196263[/C][/ROW]
[/TABLE]
Source: https://freestatistics.org/blog/index.php?pk=283385&T=1

Globally Unique Identifier (entire table): ba.freestatistics.org/blog/index.php?pk=283385&T=1

As an alternative you can also use a QR Code:  

The GUIDs for individual cells are displayed in the table below:

Summary of Dendrogram
LabelHeight
10
20
30
40
50
60
70
80
90
100
110
120
130
140
150
160
170
180
190
200
210
220
230
240
250
260
270
280
290
300
310
320
330
340
350
360
370
380
390
400
410
420.0833333333333334
430.352
440.372307692307692
450.378888888888889
460.738461538461538
470.858
481.53477078477078
493.04527851458886
508.85892003196263


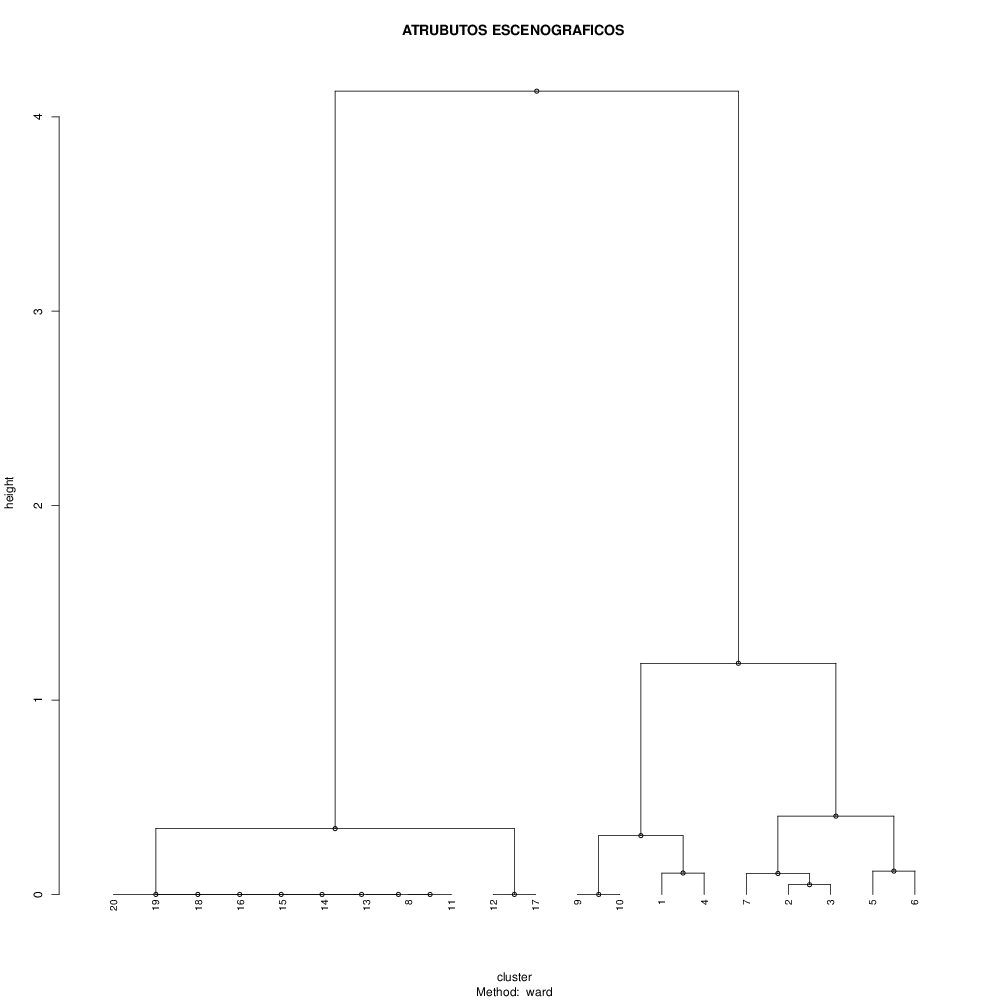
Summary of Cut Dendrogram
LabelHeight
10
20
30
40
50
60
70
80
90
100
110.05
120.107777777777778
130.11
140.12
150.3025
160.338461538461538
170.402676767676768
181.18888755980861
194.1318532190204

\begin{tabular}{lllllllll}
\hline
Summary of Cut Dendrogram \tabularnewline
Label & Height \tabularnewline
1 & 0 \tabularnewline
2 & 0 \tabularnewline
3 & 0 \tabularnewline
4 & 0 \tabularnewline
5 & 0 \tabularnewline
6 & 0 \tabularnewline
7 & 0 \tabularnewline
8 & 0 \tabularnewline
9 & 0 \tabularnewline
10 & 0 \tabularnewline
11 & 0.05 \tabularnewline
12 & 0.107777777777778 \tabularnewline
13 & 0.11 \tabularnewline
14 & 0.12 \tabularnewline
15 & 0.3025 \tabularnewline
16 & 0.338461538461538 \tabularnewline
17 & 0.402676767676768 \tabularnewline
18 & 1.18888755980861 \tabularnewline
19 & 4.1318532190204 \tabularnewline
\hline
\end{tabular}
%Source: https://freestatistics.org/blog/index.php?pk=283385&T=2

[TABLE]
[ROW][C]Summary of Cut Dendrogram[/C][/ROW]
[ROW][C]Label[/C][C]Height[/C][/ROW]
[ROW][C]1[/C][C]0[/C][/ROW]
[ROW][C]2[/C][C]0[/C][/ROW]
[ROW][C]3[/C][C]0[/C][/ROW]
[ROW][C]4[/C][C]0[/C][/ROW]
[ROW][C]5[/C][C]0[/C][/ROW]
[ROW][C]6[/C][C]0[/C][/ROW]
[ROW][C]7[/C][C]0[/C][/ROW]
[ROW][C]8[/C][C]0[/C][/ROW]
[ROW][C]9[/C][C]0[/C][/ROW]
[ROW][C]10[/C][C]0[/C][/ROW]
[ROW][C]11[/C][C]0.05[/C][/ROW]
[ROW][C]12[/C][C]0.107777777777778[/C][/ROW]
[ROW][C]13[/C][C]0.11[/C][/ROW]
[ROW][C]14[/C][C]0.12[/C][/ROW]
[ROW][C]15[/C][C]0.3025[/C][/ROW]
[ROW][C]16[/C][C]0.338461538461538[/C][/ROW]
[ROW][C]17[/C][C]0.402676767676768[/C][/ROW]
[ROW][C]18[/C][C]1.18888755980861[/C][/ROW]
[ROW][C]19[/C][C]4.1318532190204[/C][/ROW]
[/TABLE]
Source: https://freestatistics.org/blog/index.php?pk=283385&T=2

Globally Unique Identifier (entire table): ba.freestatistics.org/blog/index.php?pk=283385&T=2

As an alternative you can also use a QR Code:  

The GUIDs for individual cells are displayed in the table below:

Summary of Cut Dendrogram
LabelHeight
10
20
30
40
50
60
70
80
90
100
110.05
120.107777777777778
130.11
140.12
150.3025
160.338461538461538
170.402676767676768
181.18888755980861
194.1318532190204


Parameters (Session):
par1 = ward ; par2 = 20 ; par3 = FALSE ; par4 = FALSE ;
Parameters (R input):
par1 = ward ; par2 = 20 ; par3 = FALSE ; par4 = FALSE ;
R code (references can be found in the software module):
par4 <- 'FALSE'
par3 <- 'FALSE'
par2 <- '20'
par1 <- 'ward'
par3 <- as.logical(par3)
par4 <- as.logical(par4)
if (par3 == 'TRUE'){
dum = xlab
xlab = ylab
ylab = dum
}
x <- t(y)
hc <- hclust(dist(x),method=par1)
d <- as.dendrogram(hc)
str(d)
mysub <- paste('Method: ',par1)
bitmap(file='test1.png')
if (par4 == 'TRUE'){
plot(d,main=main,ylab=ylab,xlab=xlab,horiz=par3, nodePar=list(pch = c(1,NA), cex=0.8, lab.cex = 0.8),type='t',center=T, sub=mysub)
} else {
plot(d,main=main,ylab=ylab,xlab=xlab,horiz=par3, nodePar=list(pch = c(1,NA), cex=0.8, lab.cex = 0.8), sub=mysub)
}
dev.off()
if (par2 != 'ALL'){
if (par3 == 'TRUE'){
ylab = 'cluster'
} else {
xlab = 'cluster'
}
par2 <- as.numeric(par2)
memb <- cutree(hc, k = par2)
cent <- NULL
for(k in 1:par2){
cent <- rbind(cent, colMeans(x[memb == k, , drop = FALSE]))
}
hc1 <- hclust(dist(cent),method=par1, members = table(memb))
de <- as.dendrogram(hc1)
bitmap(file='test2.png')
if (par4 == 'TRUE'){
plot(de,main=main,ylab=ylab,xlab=xlab,horiz=par3, nodePar=list(pch = c(1,NA), cex=0.8, lab.cex = 0.8),type='t',center=T, sub=mysub)
} else {
plot(de,main=main,ylab=ylab,xlab=xlab,horiz=par3, nodePar=list(pch = c(1,NA), cex=0.8, lab.cex = 0.8), sub=mysub)
}
dev.off()
str(de)
}
load(file='createtable')
a<-table.start()
a<-table.row.start(a)
a<-table.element(a,'Summary of Dendrogram',2,TRUE)
a<-table.row.end(a)
a<-table.row.start(a)
a<-table.element(a,'Label',header=TRUE)
a<-table.element(a,'Height',header=TRUE)
a<-table.row.end(a)
num <- length(x[,1])-1
for (i in 1:num)
{
a<-table.row.start(a)
a<-table.element(a,hc$labels[i])
a<-table.element(a,hc$height[i])
a<-table.row.end(a)
}
a<-table.end(a)
table.save(a,file='mytable1.tab')
if (par2 != 'ALL'){
a<-table.start()
a<-table.row.start(a)
a<-table.element(a,'Summary of Cut Dendrogram',2,TRUE)
a<-table.row.end(a)
a<-table.row.start(a)
a<-table.element(a,'Label',header=TRUE)
a<-table.element(a,'Height',header=TRUE)
a<-table.row.end(a)
num <- par2-1
for (i in 1:num)
{
a<-table.row.start(a)
a<-table.element(a,i)
a<-table.element(a,hc1$height[i])
a<-table.row.end(a)
}
a<-table.end(a)
table.save(a,file='mytable2.tab')
}