par4 <- 'FALSE'
par3 <- 'FALSE'
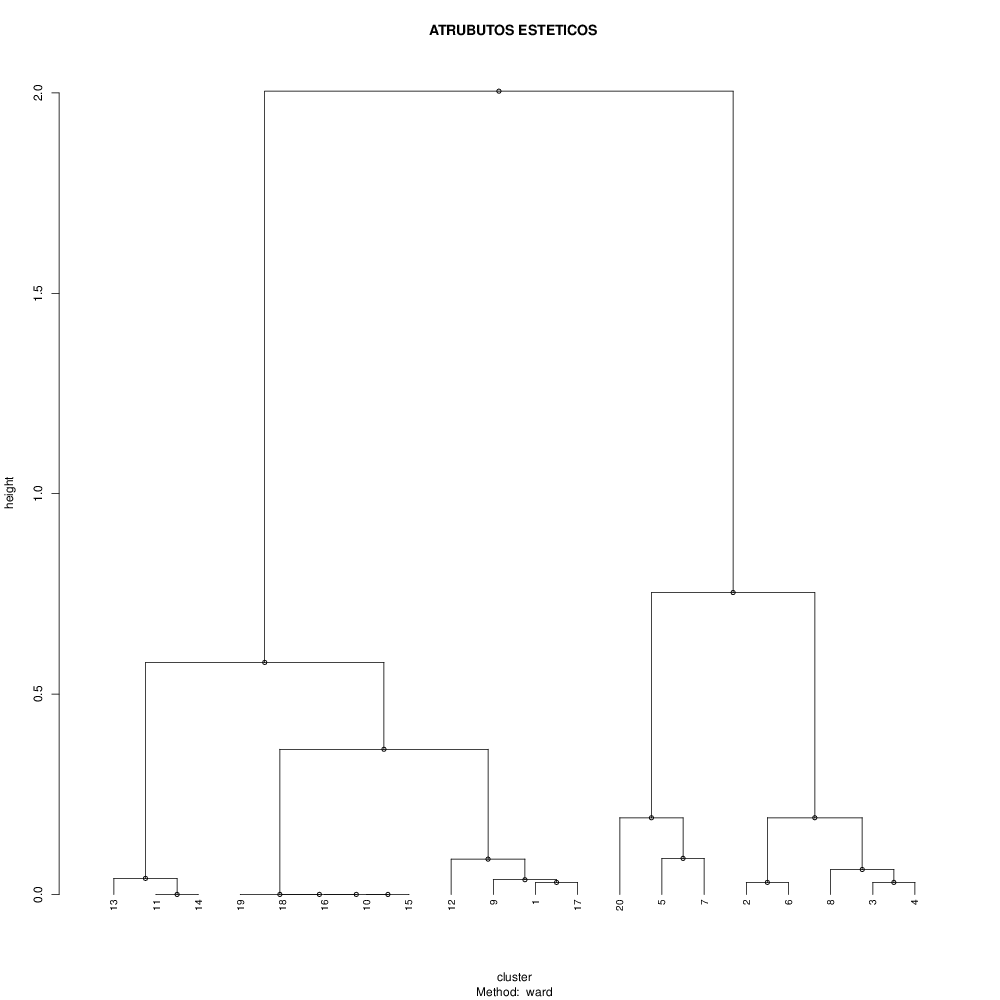
par2 <- '20'
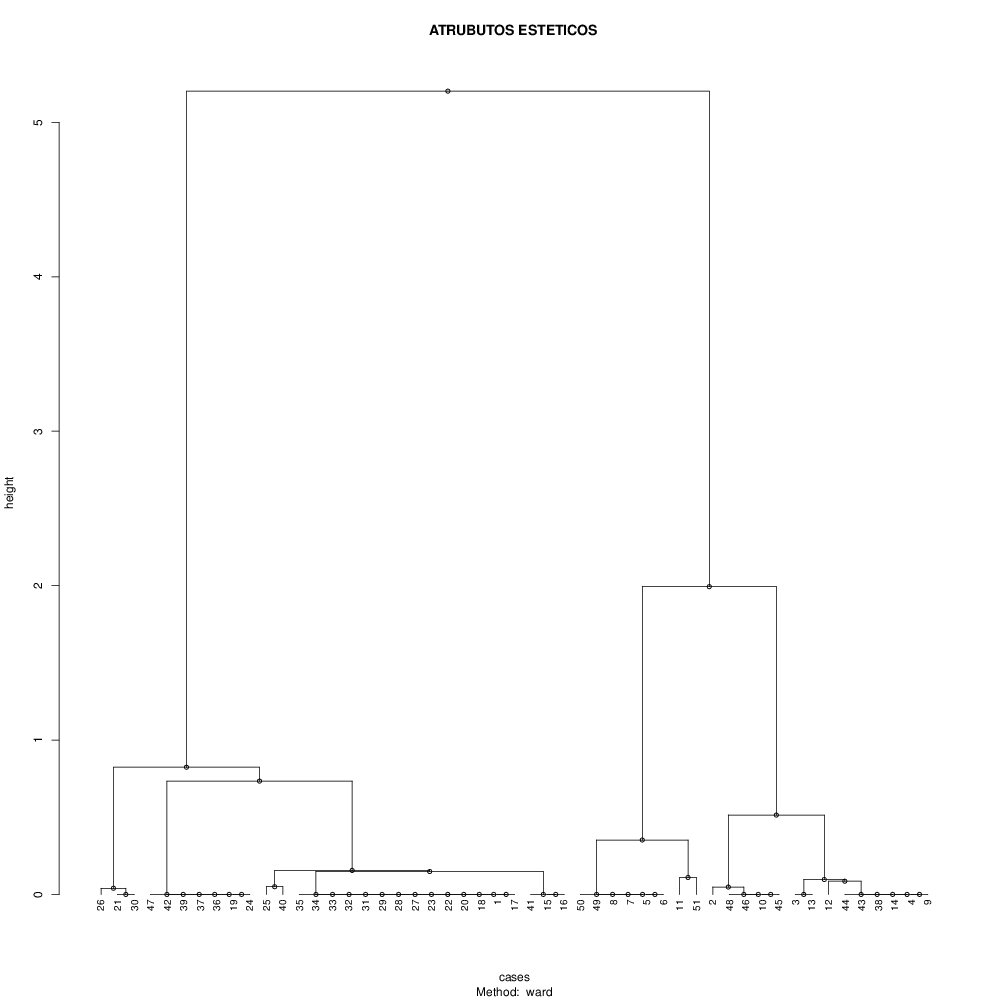
par1 <- 'ward'
par3 <- as.logical(par3)
par4 <- as.logical(par4)
if (par3 == 'TRUE'){
dum = xlab
xlab = ylab
ylab = dum
}
x <- t(y)
hc <- hclust(dist(x),method=par1)
d <- as.dendrogram(hc)
str(d)
mysub <- paste('Method: ',par1)
bitmap(file='test1.png')
if (par4 == 'TRUE'){
plot(d,main=main,ylab=ylab,xlab=xlab,horiz=par3, nodePar=list(pch = c(1,NA), cex=0.8, lab.cex = 0.8),type='t',center=T, sub=mysub)
} else {
plot(d,main=main,ylab=ylab,xlab=xlab,horiz=par3, nodePar=list(pch = c(1,NA), cex=0.8, lab.cex = 0.8), sub=mysub)
}
dev.off()
if (par2 != 'ALL'){
if (par3 == 'TRUE'){
ylab = 'cluster'
} else {
xlab = 'cluster'
}
par2 <- as.numeric(par2)
memb <- cutree(hc, k = par2)
cent <- NULL
for(k in 1:par2){
cent <- rbind(cent, colMeans(x[memb == k, , drop = FALSE]))
}
hc1 <- hclust(dist(cent),method=par1, members = table(memb))
de <- as.dendrogram(hc1)
bitmap(file='test2.png')
if (par4 == 'TRUE'){
plot(de,main=main,ylab=ylab,xlab=xlab,horiz=par3, nodePar=list(pch = c(1,NA), cex=0.8, lab.cex = 0.8),type='t',center=T, sub=mysub)
} else {
plot(de,main=main,ylab=ylab,xlab=xlab,horiz=par3, nodePar=list(pch = c(1,NA), cex=0.8, lab.cex = 0.8), sub=mysub)
}
dev.off()
str(de)
}
load(file='createtable')
a<-table.start()
a<-table.row.start(a)
a<-table.element(a,'Summary of Dendrogram',2,TRUE)
a<-table.row.end(a)
a<-table.row.start(a)
a<-table.element(a,'Label',header=TRUE)
a<-table.element(a,'Height',header=TRUE)
a<-table.row.end(a)
num <- length(x[,1])-1
for (i in 1:num)
{
a<-table.row.start(a)
a<-table.element(a,hc$labels[i])
a<-table.element(a,hc$height[i])
a<-table.row.end(a)
}
a<-table.end(a)
table.save(a,file='mytable1.tab')
if (par2 != 'ALL'){
a<-table.start()
a<-table.row.start(a)
a<-table.element(a,'Summary of Cut Dendrogram',2,TRUE)
a<-table.row.end(a)
a<-table.row.start(a)
a<-table.element(a,'Label',header=TRUE)
a<-table.element(a,'Height',header=TRUE)
a<-table.row.end(a)
num <- par2-1
for (i in 1:num)
{
a<-table.row.start(a)
a<-table.element(a,i)
a<-table.element(a,hc1$height[i])
a<-table.row.end(a)
}
a<-table.end(a)
table.save(a,file='mytable2.tab')
}
|