Free Statistics

of Irreproducible Research!

Author's title

Author*Unverified author*
R Software Modulerwasp_autocorrelation.wasp
Title produced by software(Partial) Autocorrelation Function
Date of computationMon, 16 Nov 2015 12:51:17 +0000
Cite this page as followsStatistical Computations at FreeStatistics.org, Office for Research Development and Education, URL https://freestatistics.org/blog/index.php?v=date/2015/Nov/16/t14476783727lymhckf7e7cos1.htm/, Retrieved Wed, 15 May 2024 11:37:32 +0000
Statistical Computations at FreeStatistics.org, Office for Research Development and Education, URL https://freestatistics.org/blog/index.php?pk=283367, Retrieved Wed, 15 May 2024 11:37:32 +0000
QR Codes:

Original text written by user:
IsPrivate?No (this computation is public)
User-defined keywords
Estimated Impact113
Family? (F = Feedback message, R = changed R code, M = changed R Module, P = changed Parameters, D = changed Data)
-       [(Partial) Autocorrelation Function] [Autocorrelatie] [2015-11-16 12:51:17] [4cb864837b76d57ed1be196f412f1dd6] [Current]
Feedback Forum

Post a new message
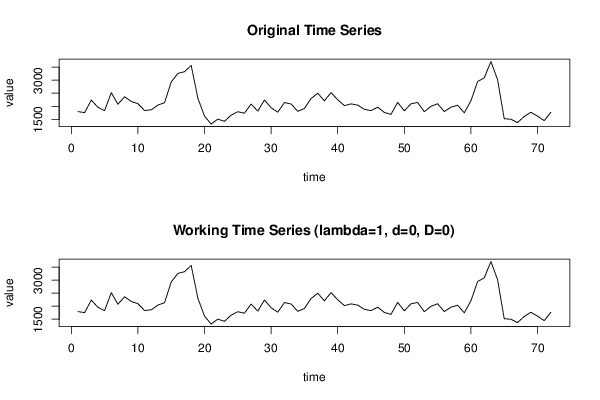
Dataseries X:
1795
1756
2237
1960
1829
2524
2077
2366
2185
2098
1836
1863
2044
2136
2931
3263
3328
3570
2313
1623
1316
1507
1419
1660
1790
1733
2086
1814
2241
1943
1773
2143
2087
1805
1913
2296
2500
2210
2526
2249
2024
2091
2045
1882
1831
1964
1763
1688
2149
1823
2094
2145
1791
1996
2097
1796
1963
2042
1746
2210
2949
3093
3718
3024
1522
1502
1373
1607
1768
1622
1447
1768


Summary of computational transaction
Raw Inputview raw input (R code)
Raw Outputview raw output of R engine
Computing time1 seconds
R Server'Gwilym Jenkins' @ jenkins.wessa.net

\begin{tabular}{lllllllll}
\hline
Summary of computational transaction \tabularnewline
Raw Input & view raw input (R code)  \tabularnewline
Raw Output & view raw output of R engine  \tabularnewline
Computing time & 1 seconds \tabularnewline
R Server & 'Gwilym Jenkins' @ jenkins.wessa.net \tabularnewline
\hline
\end{tabular}
%Source: https://freestatistics.org/blog/index.php?pk=283367&T=0

[TABLE]
[ROW][C]Summary of computational transaction[/C][/ROW]
[ROW][C]Raw Input[/C][C]view raw input (R code) [/C][/ROW]
[ROW][C]Raw Output[/C][C]view raw output of R engine [/C][/ROW]
[ROW][C]Computing time[/C][C]1 seconds[/C][/ROW]
[ROW][C]R Server[/C][C]'Gwilym Jenkins' @ jenkins.wessa.net[/C][/ROW]
[/TABLE]
Source: https://freestatistics.org/blog/index.php?pk=283367&T=0

Globally Unique Identifier (entire table): ba.freestatistics.org/blog/index.php?pk=283367&T=0

As an alternative you can also use a QR Code:  

The GUIDs for individual cells are displayed in the table below:

Summary of computational transaction
Raw Inputview raw input (R code)
Raw Outputview raw output of R engine
Computing time1 seconds
R Server'Gwilym Jenkins' @ jenkins.wessa.net


Autocorrelation Function
Time lag kACF(k)T-STATP-value
10.6950675.89780
20.3543713.00690.001816
30.0548610.46550.321485
4-0.248418-2.10790.019261
5-0.320436-2.7190.0041
6-0.284229-2.41180.009213
7-0.264532-2.24460.013933
8-0.212884-1.80640.037519
9-0.078436-0.66550.253913
10-0.031145-0.26430.396161
11-0.007948-0.06740.473208
120.0282330.23960.405674
13-0.089073-0.75580.226114
14-0.11347-0.96280.16943
15-0.139967-1.18770.119436
16-0.190007-1.61230.05564
17-0.130674-1.10880.135602
18-0.043701-0.37080.355932
190.0415940.35290.362583
200.0941720.79910.213437
210.1761341.49450.069701
220.1890631.60420.056519
230.184531.56580.060891
240.1940421.64650.05201
250.1247931.05890.146591
260.059390.50390.30792
27-0.003709-0.03150.487491
28-0.082831-0.70280.24221
29-0.105904-0.89860.185924
30-0.095246-0.80820.210822
31-0.059442-0.50440.307767
32-0.078078-0.66250.254878
33-0.025882-0.21960.413396
34-0.001316-0.01120.495561
35-0.048785-0.4140.340068
36-0.029788-0.25280.400586
37-0.064293-0.54550.293534
38-0.137993-1.17090.122749
39-0.136053-1.15440.126068
40-0.158597-1.34570.091304
41-0.161967-1.37430.0868
42-0.080955-0.68690.247167
430.0828530.7030.242153
440.2367932.00930.02413
450.4009673.40230.000547
460.415523.52580.000369
470.2570582.18120.016217
480.1212181.02860.153563

\begin{tabular}{lllllllll}
\hline
Autocorrelation Function \tabularnewline
Time lag k & ACF(k) & T-STAT & P-value \tabularnewline
1 & 0.695067 & 5.8978 & 0 \tabularnewline
2 & 0.354371 & 3.0069 & 0.001816 \tabularnewline
3 & 0.054861 & 0.4655 & 0.321485 \tabularnewline
4 & -0.248418 & -2.1079 & 0.019261 \tabularnewline
5 & -0.320436 & -2.719 & 0.0041 \tabularnewline
6 & -0.284229 & -2.4118 & 0.009213 \tabularnewline
7 & -0.264532 & -2.2446 & 0.013933 \tabularnewline
8 & -0.212884 & -1.8064 & 0.037519 \tabularnewline
9 & -0.078436 & -0.6655 & 0.253913 \tabularnewline
10 & -0.031145 & -0.2643 & 0.396161 \tabularnewline
11 & -0.007948 & -0.0674 & 0.473208 \tabularnewline
12 & 0.028233 & 0.2396 & 0.405674 \tabularnewline
13 & -0.089073 & -0.7558 & 0.226114 \tabularnewline
14 & -0.11347 & -0.9628 & 0.16943 \tabularnewline
15 & -0.139967 & -1.1877 & 0.119436 \tabularnewline
16 & -0.190007 & -1.6123 & 0.05564 \tabularnewline
17 & -0.130674 & -1.1088 & 0.135602 \tabularnewline
18 & -0.043701 & -0.3708 & 0.355932 \tabularnewline
19 & 0.041594 & 0.3529 & 0.362583 \tabularnewline
20 & 0.094172 & 0.7991 & 0.213437 \tabularnewline
21 & 0.176134 & 1.4945 & 0.069701 \tabularnewline
22 & 0.189063 & 1.6042 & 0.056519 \tabularnewline
23 & 0.18453 & 1.5658 & 0.060891 \tabularnewline
24 & 0.194042 & 1.6465 & 0.05201 \tabularnewline
25 & 0.124793 & 1.0589 & 0.146591 \tabularnewline
26 & 0.05939 & 0.5039 & 0.30792 \tabularnewline
27 & -0.003709 & -0.0315 & 0.487491 \tabularnewline
28 & -0.082831 & -0.7028 & 0.24221 \tabularnewline
29 & -0.105904 & -0.8986 & 0.185924 \tabularnewline
30 & -0.095246 & -0.8082 & 0.210822 \tabularnewline
31 & -0.059442 & -0.5044 & 0.307767 \tabularnewline
32 & -0.078078 & -0.6625 & 0.254878 \tabularnewline
33 & -0.025882 & -0.2196 & 0.413396 \tabularnewline
34 & -0.001316 & -0.0112 & 0.495561 \tabularnewline
35 & -0.048785 & -0.414 & 0.340068 \tabularnewline
36 & -0.029788 & -0.2528 & 0.400586 \tabularnewline
37 & -0.064293 & -0.5455 & 0.293534 \tabularnewline
38 & -0.137993 & -1.1709 & 0.122749 \tabularnewline
39 & -0.136053 & -1.1544 & 0.126068 \tabularnewline
40 & -0.158597 & -1.3457 & 0.091304 \tabularnewline
41 & -0.161967 & -1.3743 & 0.0868 \tabularnewline
42 & -0.080955 & -0.6869 & 0.247167 \tabularnewline
43 & 0.082853 & 0.703 & 0.242153 \tabularnewline
44 & 0.236793 & 2.0093 & 0.02413 \tabularnewline
45 & 0.400967 & 3.4023 & 0.000547 \tabularnewline
46 & 0.41552 & 3.5258 & 0.000369 \tabularnewline
47 & 0.257058 & 2.1812 & 0.016217 \tabularnewline
48 & 0.121218 & 1.0286 & 0.153563 \tabularnewline
\hline
\end{tabular}
%Source: https://freestatistics.org/blog/index.php?pk=283367&T=1

[TABLE]
[ROW][C]Autocorrelation Function[/C][/ROW]
[ROW][C]Time lag k[/C][C]ACF(k)[/C][C]T-STAT[/C][C]P-value[/C][/ROW]
[ROW][C]1[/C][C]0.695067[/C][C]5.8978[/C][C]0[/C][/ROW]
[ROW][C]2[/C][C]0.354371[/C][C]3.0069[/C][C]0.001816[/C][/ROW]
[ROW][C]3[/C][C]0.054861[/C][C]0.4655[/C][C]0.321485[/C][/ROW]
[ROW][C]4[/C][C]-0.248418[/C][C]-2.1079[/C][C]0.019261[/C][/ROW]
[ROW][C]5[/C][C]-0.320436[/C][C]-2.719[/C][C]0.0041[/C][/ROW]
[ROW][C]6[/C][C]-0.284229[/C][C]-2.4118[/C][C]0.009213[/C][/ROW]
[ROW][C]7[/C][C]-0.264532[/C][C]-2.2446[/C][C]0.013933[/C][/ROW]
[ROW][C]8[/C][C]-0.212884[/C][C]-1.8064[/C][C]0.037519[/C][/ROW]
[ROW][C]9[/C][C]-0.078436[/C][C]-0.6655[/C][C]0.253913[/C][/ROW]
[ROW][C]10[/C][C]-0.031145[/C][C]-0.2643[/C][C]0.396161[/C][/ROW]
[ROW][C]11[/C][C]-0.007948[/C][C]-0.0674[/C][C]0.473208[/C][/ROW]
[ROW][C]12[/C][C]0.028233[/C][C]0.2396[/C][C]0.405674[/C][/ROW]
[ROW][C]13[/C][C]-0.089073[/C][C]-0.7558[/C][C]0.226114[/C][/ROW]
[ROW][C]14[/C][C]-0.11347[/C][C]-0.9628[/C][C]0.16943[/C][/ROW]
[ROW][C]15[/C][C]-0.139967[/C][C]-1.1877[/C][C]0.119436[/C][/ROW]
[ROW][C]16[/C][C]-0.190007[/C][C]-1.6123[/C][C]0.05564[/C][/ROW]
[ROW][C]17[/C][C]-0.130674[/C][C]-1.1088[/C][C]0.135602[/C][/ROW]
[ROW][C]18[/C][C]-0.043701[/C][C]-0.3708[/C][C]0.355932[/C][/ROW]
[ROW][C]19[/C][C]0.041594[/C][C]0.3529[/C][C]0.362583[/C][/ROW]
[ROW][C]20[/C][C]0.094172[/C][C]0.7991[/C][C]0.213437[/C][/ROW]
[ROW][C]21[/C][C]0.176134[/C][C]1.4945[/C][C]0.069701[/C][/ROW]
[ROW][C]22[/C][C]0.189063[/C][C]1.6042[/C][C]0.056519[/C][/ROW]
[ROW][C]23[/C][C]0.18453[/C][C]1.5658[/C][C]0.060891[/C][/ROW]
[ROW][C]24[/C][C]0.194042[/C][C]1.6465[/C][C]0.05201[/C][/ROW]
[ROW][C]25[/C][C]0.124793[/C][C]1.0589[/C][C]0.146591[/C][/ROW]
[ROW][C]26[/C][C]0.05939[/C][C]0.5039[/C][C]0.30792[/C][/ROW]
[ROW][C]27[/C][C]-0.003709[/C][C]-0.0315[/C][C]0.487491[/C][/ROW]
[ROW][C]28[/C][C]-0.082831[/C][C]-0.7028[/C][C]0.24221[/C][/ROW]
[ROW][C]29[/C][C]-0.105904[/C][C]-0.8986[/C][C]0.185924[/C][/ROW]
[ROW][C]30[/C][C]-0.095246[/C][C]-0.8082[/C][C]0.210822[/C][/ROW]
[ROW][C]31[/C][C]-0.059442[/C][C]-0.5044[/C][C]0.307767[/C][/ROW]
[ROW][C]32[/C][C]-0.078078[/C][C]-0.6625[/C][C]0.254878[/C][/ROW]
[ROW][C]33[/C][C]-0.025882[/C][C]-0.2196[/C][C]0.413396[/C][/ROW]
[ROW][C]34[/C][C]-0.001316[/C][C]-0.0112[/C][C]0.495561[/C][/ROW]
[ROW][C]35[/C][C]-0.048785[/C][C]-0.414[/C][C]0.340068[/C][/ROW]
[ROW][C]36[/C][C]-0.029788[/C][C]-0.2528[/C][C]0.400586[/C][/ROW]
[ROW][C]37[/C][C]-0.064293[/C][C]-0.5455[/C][C]0.293534[/C][/ROW]
[ROW][C]38[/C][C]-0.137993[/C][C]-1.1709[/C][C]0.122749[/C][/ROW]
[ROW][C]39[/C][C]-0.136053[/C][C]-1.1544[/C][C]0.126068[/C][/ROW]
[ROW][C]40[/C][C]-0.158597[/C][C]-1.3457[/C][C]0.091304[/C][/ROW]
[ROW][C]41[/C][C]-0.161967[/C][C]-1.3743[/C][C]0.0868[/C][/ROW]
[ROW][C]42[/C][C]-0.080955[/C][C]-0.6869[/C][C]0.247167[/C][/ROW]
[ROW][C]43[/C][C]0.082853[/C][C]0.703[/C][C]0.242153[/C][/ROW]
[ROW][C]44[/C][C]0.236793[/C][C]2.0093[/C][C]0.02413[/C][/ROW]
[ROW][C]45[/C][C]0.400967[/C][C]3.4023[/C][C]0.000547[/C][/ROW]
[ROW][C]46[/C][C]0.41552[/C][C]3.5258[/C][C]0.000369[/C][/ROW]
[ROW][C]47[/C][C]0.257058[/C][C]2.1812[/C][C]0.016217[/C][/ROW]
[ROW][C]48[/C][C]0.121218[/C][C]1.0286[/C][C]0.153563[/C][/ROW]
[/TABLE]
Source: https://freestatistics.org/blog/index.php?pk=283367&T=1

Globally Unique Identifier (entire table): ba.freestatistics.org/blog/index.php?pk=283367&T=1

As an alternative you can also use a QR Code:  

The GUIDs for individual cells are displayed in the table below:

Autocorrelation Function
Time lag kACF(k)T-STATP-value
10.6950675.89780
20.3543713.00690.001816
30.0548610.46550.321485
4-0.248418-2.10790.019261
5-0.320436-2.7190.0041
6-0.284229-2.41180.009213
7-0.264532-2.24460.013933
8-0.212884-1.80640.037519
9-0.078436-0.66550.253913
10-0.031145-0.26430.396161
11-0.007948-0.06740.473208
120.0282330.23960.405674
13-0.089073-0.75580.226114
14-0.11347-0.96280.16943
15-0.139967-1.18770.119436
16-0.190007-1.61230.05564
17-0.130674-1.10880.135602
18-0.043701-0.37080.355932
190.0415940.35290.362583
200.0941720.79910.213437
210.1761341.49450.069701
220.1890631.60420.056519
230.184531.56580.060891
240.1940421.64650.05201
250.1247931.05890.146591
260.059390.50390.30792
27-0.003709-0.03150.487491
28-0.082831-0.70280.24221
29-0.105904-0.89860.185924
30-0.095246-0.80820.210822
31-0.059442-0.50440.307767
32-0.078078-0.66250.254878
33-0.025882-0.21960.413396
34-0.001316-0.01120.495561
35-0.048785-0.4140.340068
36-0.029788-0.25280.400586
37-0.064293-0.54550.293534
38-0.137993-1.17090.122749
39-0.136053-1.15440.126068
40-0.158597-1.34570.091304
41-0.161967-1.37430.0868
42-0.080955-0.68690.247167
430.0828530.7030.242153
440.2367932.00930.02413
450.4009673.40230.000547
460.415523.52580.000369
470.2570582.18120.016217
480.1212181.02860.153563


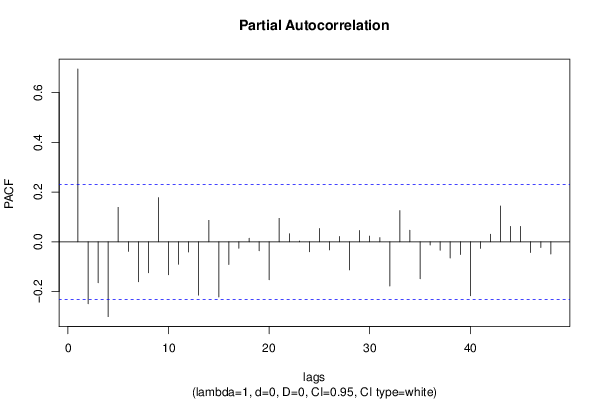
Partial Autocorrelation Function
Time lag kPACF(k)T-STATP-value
10.6950675.89780
2-0.249086-2.11360.019009
3-0.164334-1.39440.083739
4-0.300752-2.5520.006417
50.1386741.17670.121598
6-0.038459-0.32630.37256
7-0.160224-1.35950.089108
8-0.124214-1.0540.147706
90.1776411.50730.06805
10-0.132351-1.1230.132576
11-0.09029-0.76610.223049
12-0.041104-0.34880.364138
13-0.214153-1.81720.036678
140.0862970.73230.233194
15-0.221626-1.88060.032038
16-0.09129-0.77460.22055
17-0.02586-0.21940.413467
180.014450.12260.451379
19-0.03617-0.30690.379898
20-0.152365-1.29290.100097
210.0945210.8020.212584
220.0328340.27860.390673
230.0033650.02860.48865
24-0.040026-0.33960.367562
250.0538790.45720.324459
26-0.032446-0.27530.391933
270.02170.18410.427213
28-0.112711-0.95640.171039
290.0455540.38650.350117
300.0231210.19620.422508
310.0169640.14390.442973
32-0.177331-1.50470.068387
330.1254961.06490.145248
340.0469360.39830.345805
35-0.148744-1.26210.105486
36-0.012806-0.10870.456887
37-0.033967-0.28820.387002
38-0.064749-0.54940.29221
39-0.050883-0.43180.333603
40-0.216529-1.83730.035145
41-0.026395-0.2240.411709
420.030740.26080.397483
430.1438871.22090.113049
440.062070.52670.300017
450.0620660.52660.30003
46-0.043165-0.36630.357619
47-0.022648-0.19220.424075
48-0.04923-0.41770.338695

\begin{tabular}{lllllllll}
\hline
Partial Autocorrelation Function \tabularnewline
Time lag k & PACF(k) & T-STAT & P-value \tabularnewline
1 & 0.695067 & 5.8978 & 0 \tabularnewline
2 & -0.249086 & -2.1136 & 0.019009 \tabularnewline
3 & -0.164334 & -1.3944 & 0.083739 \tabularnewline
4 & -0.300752 & -2.552 & 0.006417 \tabularnewline
5 & 0.138674 & 1.1767 & 0.121598 \tabularnewline
6 & -0.038459 & -0.3263 & 0.37256 \tabularnewline
7 & -0.160224 & -1.3595 & 0.089108 \tabularnewline
8 & -0.124214 & -1.054 & 0.147706 \tabularnewline
9 & 0.177641 & 1.5073 & 0.06805 \tabularnewline
10 & -0.132351 & -1.123 & 0.132576 \tabularnewline
11 & -0.09029 & -0.7661 & 0.223049 \tabularnewline
12 & -0.041104 & -0.3488 & 0.364138 \tabularnewline
13 & -0.214153 & -1.8172 & 0.036678 \tabularnewline
14 & 0.086297 & 0.7323 & 0.233194 \tabularnewline
15 & -0.221626 & -1.8806 & 0.032038 \tabularnewline
16 & -0.09129 & -0.7746 & 0.22055 \tabularnewline
17 & -0.02586 & -0.2194 & 0.413467 \tabularnewline
18 & 0.01445 & 0.1226 & 0.451379 \tabularnewline
19 & -0.03617 & -0.3069 & 0.379898 \tabularnewline
20 & -0.152365 & -1.2929 & 0.100097 \tabularnewline
21 & 0.094521 & 0.802 & 0.212584 \tabularnewline
22 & 0.032834 & 0.2786 & 0.390673 \tabularnewline
23 & 0.003365 & 0.0286 & 0.48865 \tabularnewline
24 & -0.040026 & -0.3396 & 0.367562 \tabularnewline
25 & 0.053879 & 0.4572 & 0.324459 \tabularnewline
26 & -0.032446 & -0.2753 & 0.391933 \tabularnewline
27 & 0.0217 & 0.1841 & 0.427213 \tabularnewline
28 & -0.112711 & -0.9564 & 0.171039 \tabularnewline
29 & 0.045554 & 0.3865 & 0.350117 \tabularnewline
30 & 0.023121 & 0.1962 & 0.422508 \tabularnewline
31 & 0.016964 & 0.1439 & 0.442973 \tabularnewline
32 & -0.177331 & -1.5047 & 0.068387 \tabularnewline
33 & 0.125496 & 1.0649 & 0.145248 \tabularnewline
34 & 0.046936 & 0.3983 & 0.345805 \tabularnewline
35 & -0.148744 & -1.2621 & 0.105486 \tabularnewline
36 & -0.012806 & -0.1087 & 0.456887 \tabularnewline
37 & -0.033967 & -0.2882 & 0.387002 \tabularnewline
38 & -0.064749 & -0.5494 & 0.29221 \tabularnewline
39 & -0.050883 & -0.4318 & 0.333603 \tabularnewline
40 & -0.216529 & -1.8373 & 0.035145 \tabularnewline
41 & -0.026395 & -0.224 & 0.411709 \tabularnewline
42 & 0.03074 & 0.2608 & 0.397483 \tabularnewline
43 & 0.143887 & 1.2209 & 0.113049 \tabularnewline
44 & 0.06207 & 0.5267 & 0.300017 \tabularnewline
45 & 0.062066 & 0.5266 & 0.30003 \tabularnewline
46 & -0.043165 & -0.3663 & 0.357619 \tabularnewline
47 & -0.022648 & -0.1922 & 0.424075 \tabularnewline
48 & -0.04923 & -0.4177 & 0.338695 \tabularnewline
\hline
\end{tabular}
%Source: https://freestatistics.org/blog/index.php?pk=283367&T=2

[TABLE]
[ROW][C]Partial Autocorrelation Function[/C][/ROW]
[ROW][C]Time lag k[/C][C]PACF(k)[/C][C]T-STAT[/C][C]P-value[/C][/ROW]
[ROW][C]1[/C][C]0.695067[/C][C]5.8978[/C][C]0[/C][/ROW]
[ROW][C]2[/C][C]-0.249086[/C][C]-2.1136[/C][C]0.019009[/C][/ROW]
[ROW][C]3[/C][C]-0.164334[/C][C]-1.3944[/C][C]0.083739[/C][/ROW]
[ROW][C]4[/C][C]-0.300752[/C][C]-2.552[/C][C]0.006417[/C][/ROW]
[ROW][C]5[/C][C]0.138674[/C][C]1.1767[/C][C]0.121598[/C][/ROW]
[ROW][C]6[/C][C]-0.038459[/C][C]-0.3263[/C][C]0.37256[/C][/ROW]
[ROW][C]7[/C][C]-0.160224[/C][C]-1.3595[/C][C]0.089108[/C][/ROW]
[ROW][C]8[/C][C]-0.124214[/C][C]-1.054[/C][C]0.147706[/C][/ROW]
[ROW][C]9[/C][C]0.177641[/C][C]1.5073[/C][C]0.06805[/C][/ROW]
[ROW][C]10[/C][C]-0.132351[/C][C]-1.123[/C][C]0.132576[/C][/ROW]
[ROW][C]11[/C][C]-0.09029[/C][C]-0.7661[/C][C]0.223049[/C][/ROW]
[ROW][C]12[/C][C]-0.041104[/C][C]-0.3488[/C][C]0.364138[/C][/ROW]
[ROW][C]13[/C][C]-0.214153[/C][C]-1.8172[/C][C]0.036678[/C][/ROW]
[ROW][C]14[/C][C]0.086297[/C][C]0.7323[/C][C]0.233194[/C][/ROW]
[ROW][C]15[/C][C]-0.221626[/C][C]-1.8806[/C][C]0.032038[/C][/ROW]
[ROW][C]16[/C][C]-0.09129[/C][C]-0.7746[/C][C]0.22055[/C][/ROW]
[ROW][C]17[/C][C]-0.02586[/C][C]-0.2194[/C][C]0.413467[/C][/ROW]
[ROW][C]18[/C][C]0.01445[/C][C]0.1226[/C][C]0.451379[/C][/ROW]
[ROW][C]19[/C][C]-0.03617[/C][C]-0.3069[/C][C]0.379898[/C][/ROW]
[ROW][C]20[/C][C]-0.152365[/C][C]-1.2929[/C][C]0.100097[/C][/ROW]
[ROW][C]21[/C][C]0.094521[/C][C]0.802[/C][C]0.212584[/C][/ROW]
[ROW][C]22[/C][C]0.032834[/C][C]0.2786[/C][C]0.390673[/C][/ROW]
[ROW][C]23[/C][C]0.003365[/C][C]0.0286[/C][C]0.48865[/C][/ROW]
[ROW][C]24[/C][C]-0.040026[/C][C]-0.3396[/C][C]0.367562[/C][/ROW]
[ROW][C]25[/C][C]0.053879[/C][C]0.4572[/C][C]0.324459[/C][/ROW]
[ROW][C]26[/C][C]-0.032446[/C][C]-0.2753[/C][C]0.391933[/C][/ROW]
[ROW][C]27[/C][C]0.0217[/C][C]0.1841[/C][C]0.427213[/C][/ROW]
[ROW][C]28[/C][C]-0.112711[/C][C]-0.9564[/C][C]0.171039[/C][/ROW]
[ROW][C]29[/C][C]0.045554[/C][C]0.3865[/C][C]0.350117[/C][/ROW]
[ROW][C]30[/C][C]0.023121[/C][C]0.1962[/C][C]0.422508[/C][/ROW]
[ROW][C]31[/C][C]0.016964[/C][C]0.1439[/C][C]0.442973[/C][/ROW]
[ROW][C]32[/C][C]-0.177331[/C][C]-1.5047[/C][C]0.068387[/C][/ROW]
[ROW][C]33[/C][C]0.125496[/C][C]1.0649[/C][C]0.145248[/C][/ROW]
[ROW][C]34[/C][C]0.046936[/C][C]0.3983[/C][C]0.345805[/C][/ROW]
[ROW][C]35[/C][C]-0.148744[/C][C]-1.2621[/C][C]0.105486[/C][/ROW]
[ROW][C]36[/C][C]-0.012806[/C][C]-0.1087[/C][C]0.456887[/C][/ROW]
[ROW][C]37[/C][C]-0.033967[/C][C]-0.2882[/C][C]0.387002[/C][/ROW]
[ROW][C]38[/C][C]-0.064749[/C][C]-0.5494[/C][C]0.29221[/C][/ROW]
[ROW][C]39[/C][C]-0.050883[/C][C]-0.4318[/C][C]0.333603[/C][/ROW]
[ROW][C]40[/C][C]-0.216529[/C][C]-1.8373[/C][C]0.035145[/C][/ROW]
[ROW][C]41[/C][C]-0.026395[/C][C]-0.224[/C][C]0.411709[/C][/ROW]
[ROW][C]42[/C][C]0.03074[/C][C]0.2608[/C][C]0.397483[/C][/ROW]
[ROW][C]43[/C][C]0.143887[/C][C]1.2209[/C][C]0.113049[/C][/ROW]
[ROW][C]44[/C][C]0.06207[/C][C]0.5267[/C][C]0.300017[/C][/ROW]
[ROW][C]45[/C][C]0.062066[/C][C]0.5266[/C][C]0.30003[/C][/ROW]
[ROW][C]46[/C][C]-0.043165[/C][C]-0.3663[/C][C]0.357619[/C][/ROW]
[ROW][C]47[/C][C]-0.022648[/C][C]-0.1922[/C][C]0.424075[/C][/ROW]
[ROW][C]48[/C][C]-0.04923[/C][C]-0.4177[/C][C]0.338695[/C][/ROW]
[/TABLE]
Source: https://freestatistics.org/blog/index.php?pk=283367&T=2

Globally Unique Identifier (entire table): ba.freestatistics.org/blog/index.php?pk=283367&T=2

As an alternative you can also use a QR Code:  

The GUIDs for individual cells are displayed in the table below:

Partial Autocorrelation Function
Time lag kPACF(k)T-STATP-value
10.6950675.89780
2-0.249086-2.11360.019009
3-0.164334-1.39440.083739
4-0.300752-2.5520.006417
50.1386741.17670.121598
6-0.038459-0.32630.37256
7-0.160224-1.35950.089108
8-0.124214-1.0540.147706
90.1776411.50730.06805
10-0.132351-1.1230.132576
11-0.09029-0.76610.223049
12-0.041104-0.34880.364138
13-0.214153-1.81720.036678
140.0862970.73230.233194
15-0.221626-1.88060.032038
16-0.09129-0.77460.22055
17-0.02586-0.21940.413467
180.014450.12260.451379
19-0.03617-0.30690.379898
20-0.152365-1.29290.100097
210.0945210.8020.212584
220.0328340.27860.390673
230.0033650.02860.48865
24-0.040026-0.33960.367562
250.0538790.45720.324459
26-0.032446-0.27530.391933
270.02170.18410.427213
28-0.112711-0.95640.171039
290.0455540.38650.350117
300.0231210.19620.422508
310.0169640.14390.442973
32-0.177331-1.50470.068387
330.1254961.06490.145248
340.0469360.39830.345805
35-0.148744-1.26210.105486
36-0.012806-0.10870.456887
37-0.033967-0.28820.387002
38-0.064749-0.54940.29221
39-0.050883-0.43180.333603
40-0.216529-1.83730.035145
41-0.026395-0.2240.411709
420.030740.26080.397483
430.1438871.22090.113049
440.062070.52670.300017
450.0620660.52660.30003
46-0.043165-0.36630.357619
47-0.022648-0.19220.424075
48-0.04923-0.41770.338695


Parameters (Session):
par1 = 48 ; par2 = 1 ; par3 = 0 ; par4 = 0 ; par5 = 12 ; par6 = White Noise ; par7 = 0.95 ;
Parameters (R input):
par1 = 48 ; par2 = 1 ; par3 = 0 ; par4 = 0 ; par5 = 12 ; par6 = White Noise ; par7 = 0.95 ; par8 = ;
R code (references can be found in the software module):
if (par1 == 'Default') {
par1 = 10*log10(length(x))
} else {
par1 <- as.numeric(par1)
}
par2 <- as.numeric(par2)
par3 <- as.numeric(par3)
par4 <- as.numeric(par4)
par5 <- as.numeric(par5)
if (par6 == 'White Noise') par6 <- 'white' else par6 <- 'ma'
par7 <- as.numeric(par7)
if (par8 != '') par8 <- as.numeric(par8)
ox <- x
if (par8 == '') {
if (par2 == 0) {
x <- log(x)
} else {
x <- (x ^ par2 - 1) / par2
}
} else {
x <- log(x,base=par8)
}
if (par3 > 0) x <- diff(x,lag=1,difference=par3)
if (par4 > 0) x <- diff(x,lag=par5,difference=par4)
bitmap(file='picts.png')
op <- par(mfrow=c(2,1))
plot(ox,type='l',main='Original Time Series',xlab='time',ylab='value')
if (par8=='') {
mytitle <- paste('Working Time Series (lambda=',par2,', d=',par3,', D=',par4,')',sep='')
mysub <- paste('(lambda=',par2,', d=',par3,', D=',par4,', CI=', par7, ', CI type=',par6,')',sep='')
} else {
mytitle <- paste('Working Time Series (base=',par8,', d=',par3,', D=',par4,')',sep='')
mysub <- paste('(base=',par8,', d=',par3,', D=',par4,', CI=', par7, ', CI type=',par6,')',sep='')
}
plot(x,type='l', main=mytitle,xlab='time',ylab='value')
par(op)
dev.off()
bitmap(file='pic1.png')
racf <- acf(x, par1, main='Autocorrelation', xlab='time lag', ylab='ACF', ci.type=par6, ci=par7, sub=mysub)
dev.off()
bitmap(file='pic2.png')
rpacf <- pacf(x,par1,main='Partial Autocorrelation',xlab='lags',ylab='PACF',sub=mysub)
dev.off()
(myacf <- c(racf$acf))
(mypacf <- c(rpacf$acf))
lengthx <- length(x)
sqrtn <- sqrt(lengthx)
load(file='createtable')
a<-table.start()
a<-table.row.start(a)
a<-table.element(a,'Autocorrelation Function',4,TRUE)
a<-table.row.end(a)
a<-table.row.start(a)
a<-table.element(a,'Time lag k',header=TRUE)
a<-table.element(a,hyperlink('basics.htm','ACF(k)','click here for more information about the Autocorrelation Function'),header=TRUE)
a<-table.element(a,'T-STAT',header=TRUE)
a<-table.element(a,'P-value',header=TRUE)
a<-table.row.end(a)
for (i in 2:(par1+1)) {
a<-table.row.start(a)
a<-table.element(a,i-1,header=TRUE)
a<-table.element(a,round(myacf[i],6))
mytstat <- myacf[i]*sqrtn
a<-table.element(a,round(mytstat,4))
a<-table.element(a,round(1-pt(abs(mytstat),lengthx),6))
a<-table.row.end(a)
}
a<-table.end(a)
table.save(a,file='mytable.tab')
a<-table.start()
a<-table.row.start(a)
a<-table.element(a,'Partial Autocorrelation Function',4,TRUE)
a<-table.row.end(a)
a<-table.row.start(a)
a<-table.element(a,'Time lag k',header=TRUE)
a<-table.element(a,hyperlink('basics.htm','PACF(k)','click here for more information about the Partial Autocorrelation Function'),header=TRUE)
a<-table.element(a,'T-STAT',header=TRUE)
a<-table.element(a,'P-value',header=TRUE)
a<-table.row.end(a)
for (i in 1:par1) {
a<-table.row.start(a)
a<-table.element(a,i,header=TRUE)
a<-table.element(a,round(mypacf[i],6))
mytstat <- mypacf[i]*sqrtn
a<-table.element(a,round(mytstat,4))
a<-table.element(a,round(1-pt(abs(mytstat),lengthx),6))
a<-table.row.end(a)
}
a<-table.end(a)
table.save(a,file='mytable1.tab')