Free Statistics

of Irreproducible Research!

Author's title

Author*Unverified author*
R Software Modulerwasp_autocorrelation.wasp
Title produced by software(Partial) Autocorrelation Function
Date of computationMon, 16 Nov 2015 09:59:43 +0000
Cite this page as followsStatistical Computations at FreeStatistics.org, Office for Research Development and Education, URL https://freestatistics.org/blog/index.php?v=date/2015/Nov/16/t1447668014847qn1mk9521loj.htm/, Retrieved Wed, 15 May 2024 14:48:38 +0000
Statistical Computations at FreeStatistics.org, Office for Research Development and Education, URL https://freestatistics.org/blog/index.php?pk=283357, Retrieved Wed, 15 May 2024 14:48:38 +0000
QR Codes:

Original text written by user:
IsPrivate?No (this computation is public)
User-defined keywords
Estimated Impact123
Family? (F = Feedback message, R = changed R code, M = changed R Module, P = changed Parameters, D = changed Data)
-       [(Partial) Autocorrelation Function] [] [2015-11-16 09:59:43] [663b8bcb3523d59827bca0af0b37f04c] [Current]
- R PD    [(Partial) Autocorrelation Function] [] [2015-12-30 12:35:04] [1abbea75cc6be7d57004024c66566ad0]
Feedback Forum

Post a new message
Dataseries X:
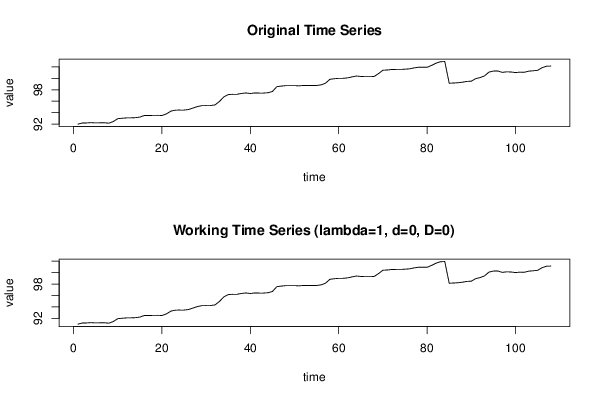
91,99
92,17
92,19
92,24
92,19
92,21
92,22
92,14
92,43
92,93
93,01
93,07
93,08
93,11
93,21
93,49
93,48
93,51
93,52
93,49
93,76
94,25
94,42
94,45
94,45
94,53
94,78
95,05
95,21
95,23
95,23
95,34
95,93
96,75
97,15
97,21
97,21
97,35
97,44
97,34
97,44
97,43
97,43
97,47
97,69
98,54
98,64
98,72
98,72
98,73
98,68
98,75
98,73
98,74
98,75
98,85
99,14
99,83
99,93
100
100
100,08
100,25
100,4
100,33
100,29
100,29
100,32
100,82
101,42
101,46
101,55
101,56
101,56
101,6
101,66
101,82
101,94
101,95
101,93
102,26
102,65
102,9
102,94
99,14
99,18
99,23
99,32
99,46
99,5
99,95
100,13
100,43
101,09
101,27
101,29
101,04
101,14
101,11
101,01
101,08
101,06
101,26
101,32
101,4
101,85
102,12
102,15


Summary of computational transaction
Raw Inputview raw input (R code)
Raw Outputview raw output of R engine
Computing time2 seconds
R Server'Sir Maurice George Kendall' @ kendall.wessa.net

\begin{tabular}{lllllllll}
\hline
Summary of computational transaction \tabularnewline
Raw Input & view raw input (R code)  \tabularnewline
Raw Output & view raw output of R engine  \tabularnewline
Computing time & 2 seconds \tabularnewline
R Server & 'Sir Maurice George Kendall' @ kendall.wessa.net \tabularnewline
\hline
\end{tabular}
%Source: https://freestatistics.org/blog/index.php?pk=283357&T=0

[TABLE]
[ROW][C]Summary of computational transaction[/C][/ROW]
[ROW][C]Raw Input[/C][C]view raw input (R code) [/C][/ROW]
[ROW][C]Raw Output[/C][C]view raw output of R engine [/C][/ROW]
[ROW][C]Computing time[/C][C]2 seconds[/C][/ROW]
[ROW][C]R Server[/C][C]'Sir Maurice George Kendall' @ kendall.wessa.net[/C][/ROW]
[/TABLE]
Source: https://freestatistics.org/blog/index.php?pk=283357&T=0

Globally Unique Identifier (entire table): ba.freestatistics.org/blog/index.php?pk=283357&T=0

As an alternative you can also use a QR Code:  

The GUIDs for individual cells are displayed in the table below:

Summary of computational transaction
Raw Inputview raw input (R code)
Raw Outputview raw output of R engine
Computing time2 seconds
R Server'Sir Maurice George Kendall' @ kendall.wessa.net


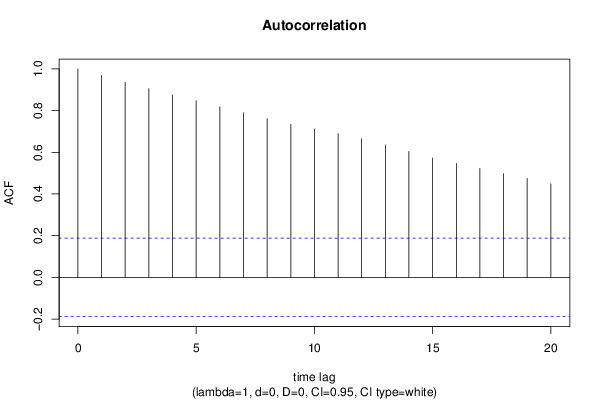
Autocorrelation Function
Time lag kACF(k)T-STATP-value
10.96895710.06970
20.9364179.73150
30.9046339.40120
40.875489.09830
50.847158.80380
60.818038.50120
70.789858.20840
80.7610097.90860
90.7345357.63350
100.7119787.39910
110.6893837.16430
120.6651076.9120
130.6354336.60360
140.6040846.27780
150.5728035.95270
160.5462775.67710
170.5219775.42450
180.4974335.16951e-06
190.4739614.92552e-06
200.4494514.67084e-06

\begin{tabular}{lllllllll}
\hline
Autocorrelation Function \tabularnewline
Time lag k & ACF(k) & T-STAT & P-value \tabularnewline
1 & 0.968957 & 10.0697 & 0 \tabularnewline
2 & 0.936417 & 9.7315 & 0 \tabularnewline
3 & 0.904633 & 9.4012 & 0 \tabularnewline
4 & 0.87548 & 9.0983 & 0 \tabularnewline
5 & 0.84715 & 8.8038 & 0 \tabularnewline
6 & 0.81803 & 8.5012 & 0 \tabularnewline
7 & 0.78985 & 8.2084 & 0 \tabularnewline
8 & 0.761009 & 7.9086 & 0 \tabularnewline
9 & 0.734535 & 7.6335 & 0 \tabularnewline
10 & 0.711978 & 7.3991 & 0 \tabularnewline
11 & 0.689383 & 7.1643 & 0 \tabularnewline
12 & 0.665107 & 6.912 & 0 \tabularnewline
13 & 0.635433 & 6.6036 & 0 \tabularnewline
14 & 0.604084 & 6.2778 & 0 \tabularnewline
15 & 0.572803 & 5.9527 & 0 \tabularnewline
16 & 0.546277 & 5.6771 & 0 \tabularnewline
17 & 0.521977 & 5.4245 & 0 \tabularnewline
18 & 0.497433 & 5.1695 & 1e-06 \tabularnewline
19 & 0.473961 & 4.9255 & 2e-06 \tabularnewline
20 & 0.449451 & 4.6708 & 4e-06 \tabularnewline
\hline
\end{tabular}
%Source: https://freestatistics.org/blog/index.php?pk=283357&T=1

[TABLE]
[ROW][C]Autocorrelation Function[/C][/ROW]
[ROW][C]Time lag k[/C][C]ACF(k)[/C][C]T-STAT[/C][C]P-value[/C][/ROW]
[ROW][C]1[/C][C]0.968957[/C][C]10.0697[/C][C]0[/C][/ROW]
[ROW][C]2[/C][C]0.936417[/C][C]9.7315[/C][C]0[/C][/ROW]
[ROW][C]3[/C][C]0.904633[/C][C]9.4012[/C][C]0[/C][/ROW]
[ROW][C]4[/C][C]0.87548[/C][C]9.0983[/C][C]0[/C][/ROW]
[ROW][C]5[/C][C]0.84715[/C][C]8.8038[/C][C]0[/C][/ROW]
[ROW][C]6[/C][C]0.81803[/C][C]8.5012[/C][C]0[/C][/ROW]
[ROW][C]7[/C][C]0.78985[/C][C]8.2084[/C][C]0[/C][/ROW]
[ROW][C]8[/C][C]0.761009[/C][C]7.9086[/C][C]0[/C][/ROW]
[ROW][C]9[/C][C]0.734535[/C][C]7.6335[/C][C]0[/C][/ROW]
[ROW][C]10[/C][C]0.711978[/C][C]7.3991[/C][C]0[/C][/ROW]
[ROW][C]11[/C][C]0.689383[/C][C]7.1643[/C][C]0[/C][/ROW]
[ROW][C]12[/C][C]0.665107[/C][C]6.912[/C][C]0[/C][/ROW]
[ROW][C]13[/C][C]0.635433[/C][C]6.6036[/C][C]0[/C][/ROW]
[ROW][C]14[/C][C]0.604084[/C][C]6.2778[/C][C]0[/C][/ROW]
[ROW][C]15[/C][C]0.572803[/C][C]5.9527[/C][C]0[/C][/ROW]
[ROW][C]16[/C][C]0.546277[/C][C]5.6771[/C][C]0[/C][/ROW]
[ROW][C]17[/C][C]0.521977[/C][C]5.4245[/C][C]0[/C][/ROW]
[ROW][C]18[/C][C]0.497433[/C][C]5.1695[/C][C]1e-06[/C][/ROW]
[ROW][C]19[/C][C]0.473961[/C][C]4.9255[/C][C]2e-06[/C][/ROW]
[ROW][C]20[/C][C]0.449451[/C][C]4.6708[/C][C]4e-06[/C][/ROW]
[/TABLE]
Source: https://freestatistics.org/blog/index.php?pk=283357&T=1

Globally Unique Identifier (entire table): ba.freestatistics.org/blog/index.php?pk=283357&T=1

As an alternative you can also use a QR Code:  

The GUIDs for individual cells are displayed in the table below:

Autocorrelation Function
Time lag kACF(k)T-STATP-value
10.96895710.06970
20.9364179.73150
30.9046339.40120
40.875489.09830
50.847158.80380
60.818038.50120
70.789858.20840
80.7610097.90860
90.7345357.63350
100.7119787.39910
110.6893837.16430
120.6651076.9120
130.6354336.60360
140.6040846.27780
150.5728035.95270
160.5462775.67710
170.5219775.42450
180.4974335.16951e-06
190.4739614.92552e-06
200.4494514.67084e-06


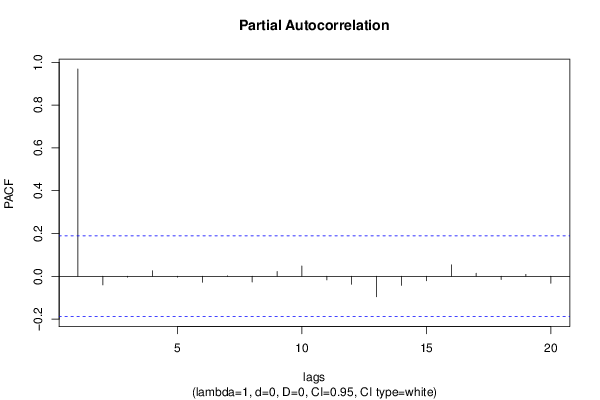
Partial Autocorrelation Function
Time lag kPACF(k)T-STATP-value
10.96895710.06970
2-0.040263-0.41840.338234
3-0.003842-0.03990.484111
40.0258190.26830.394483
5-0.003982-0.04140.483533
6-0.027977-0.29070.385903
70.0020180.0210.491655
8-0.026656-0.2770.391148
90.0224680.23350.407908
100.0479150.49790.309767
11-0.016794-0.17450.430887
12-0.037606-0.39080.348353
13-0.095939-0.9970.160489
14-0.042533-0.4420.329681
15-0.020917-0.21740.414162
160.0533670.55460.290156
170.0139190.14470.442628
18-0.014994-0.15580.438234
190.0089730.09330.462939
20-0.032247-0.33510.369092

\begin{tabular}{lllllllll}
\hline
Partial Autocorrelation Function \tabularnewline
Time lag k & PACF(k) & T-STAT & P-value \tabularnewline
1 & 0.968957 & 10.0697 & 0 \tabularnewline
2 & -0.040263 & -0.4184 & 0.338234 \tabularnewline
3 & -0.003842 & -0.0399 & 0.484111 \tabularnewline
4 & 0.025819 & 0.2683 & 0.394483 \tabularnewline
5 & -0.003982 & -0.0414 & 0.483533 \tabularnewline
6 & -0.027977 & -0.2907 & 0.385903 \tabularnewline
7 & 0.002018 & 0.021 & 0.491655 \tabularnewline
8 & -0.026656 & -0.277 & 0.391148 \tabularnewline
9 & 0.022468 & 0.2335 & 0.407908 \tabularnewline
10 & 0.047915 & 0.4979 & 0.309767 \tabularnewline
11 & -0.016794 & -0.1745 & 0.430887 \tabularnewline
12 & -0.037606 & -0.3908 & 0.348353 \tabularnewline
13 & -0.095939 & -0.997 & 0.160489 \tabularnewline
14 & -0.042533 & -0.442 & 0.329681 \tabularnewline
15 & -0.020917 & -0.2174 & 0.414162 \tabularnewline
16 & 0.053367 & 0.5546 & 0.290156 \tabularnewline
17 & 0.013919 & 0.1447 & 0.442628 \tabularnewline
18 & -0.014994 & -0.1558 & 0.438234 \tabularnewline
19 & 0.008973 & 0.0933 & 0.462939 \tabularnewline
20 & -0.032247 & -0.3351 & 0.369092 \tabularnewline
\hline
\end{tabular}
%Source: https://freestatistics.org/blog/index.php?pk=283357&T=2

[TABLE]
[ROW][C]Partial Autocorrelation Function[/C][/ROW]
[ROW][C]Time lag k[/C][C]PACF(k)[/C][C]T-STAT[/C][C]P-value[/C][/ROW]
[ROW][C]1[/C][C]0.968957[/C][C]10.0697[/C][C]0[/C][/ROW]
[ROW][C]2[/C][C]-0.040263[/C][C]-0.4184[/C][C]0.338234[/C][/ROW]
[ROW][C]3[/C][C]-0.003842[/C][C]-0.0399[/C][C]0.484111[/C][/ROW]
[ROW][C]4[/C][C]0.025819[/C][C]0.2683[/C][C]0.394483[/C][/ROW]
[ROW][C]5[/C][C]-0.003982[/C][C]-0.0414[/C][C]0.483533[/C][/ROW]
[ROW][C]6[/C][C]-0.027977[/C][C]-0.2907[/C][C]0.385903[/C][/ROW]
[ROW][C]7[/C][C]0.002018[/C][C]0.021[/C][C]0.491655[/C][/ROW]
[ROW][C]8[/C][C]-0.026656[/C][C]-0.277[/C][C]0.391148[/C][/ROW]
[ROW][C]9[/C][C]0.022468[/C][C]0.2335[/C][C]0.407908[/C][/ROW]
[ROW][C]10[/C][C]0.047915[/C][C]0.4979[/C][C]0.309767[/C][/ROW]
[ROW][C]11[/C][C]-0.016794[/C][C]-0.1745[/C][C]0.430887[/C][/ROW]
[ROW][C]12[/C][C]-0.037606[/C][C]-0.3908[/C][C]0.348353[/C][/ROW]
[ROW][C]13[/C][C]-0.095939[/C][C]-0.997[/C][C]0.160489[/C][/ROW]
[ROW][C]14[/C][C]-0.042533[/C][C]-0.442[/C][C]0.329681[/C][/ROW]
[ROW][C]15[/C][C]-0.020917[/C][C]-0.2174[/C][C]0.414162[/C][/ROW]
[ROW][C]16[/C][C]0.053367[/C][C]0.5546[/C][C]0.290156[/C][/ROW]
[ROW][C]17[/C][C]0.013919[/C][C]0.1447[/C][C]0.442628[/C][/ROW]
[ROW][C]18[/C][C]-0.014994[/C][C]-0.1558[/C][C]0.438234[/C][/ROW]
[ROW][C]19[/C][C]0.008973[/C][C]0.0933[/C][C]0.462939[/C][/ROW]
[ROW][C]20[/C][C]-0.032247[/C][C]-0.3351[/C][C]0.369092[/C][/ROW]
[/TABLE]
Source: https://freestatistics.org/blog/index.php?pk=283357&T=2

Globally Unique Identifier (entire table): ba.freestatistics.org/blog/index.php?pk=283357&T=2

As an alternative you can also use a QR Code:  

The GUIDs for individual cells are displayed in the table below:

Partial Autocorrelation Function
Time lag kPACF(k)T-STATP-value
10.96895710.06970
2-0.040263-0.41840.338234
3-0.003842-0.03990.484111
40.0258190.26830.394483
5-0.003982-0.04140.483533
6-0.027977-0.29070.385903
70.0020180.0210.491655
8-0.026656-0.2770.391148
90.0224680.23350.407908
100.0479150.49790.309767
11-0.016794-0.17450.430887
12-0.037606-0.39080.348353
13-0.095939-0.9970.160489
14-0.042533-0.4420.329681
15-0.020917-0.21740.414162
160.0533670.55460.290156
170.0139190.14470.442628
18-0.014994-0.15580.438234
190.0089730.09330.462939
20-0.032247-0.33510.369092


Parameters (Session):
par1 = Default ; par2 = 1 ; par3 = 0 ; par4 = 0 ; par5 = 12 ; par6 = White Noise ; par7 = 0.95 ;
Parameters (R input):
par1 = Default ; par2 = 1 ; par3 = 0 ; par4 = 0 ; par5 = 12 ; par6 = White Noise ; par7 = 0.95 ; par8 = ;
R code (references can be found in the software module):
if (par1 == 'Default') {
par1 = 10*log10(length(x))
} else {
par1 <- as.numeric(par1)
}
par2 <- as.numeric(par2)
par3 <- as.numeric(par3)
par4 <- as.numeric(par4)
par5 <- as.numeric(par5)
if (par6 == 'White Noise') par6 <- 'white' else par6 <- 'ma'
par7 <- as.numeric(par7)
if (par8 != '') par8 <- as.numeric(par8)
ox <- x
if (par8 == '') {
if (par2 == 0) {
x <- log(x)
} else {
x <- (x ^ par2 - 1) / par2
}
} else {
x <- log(x,base=par8)
}
if (par3 > 0) x <- diff(x,lag=1,difference=par3)
if (par4 > 0) x <- diff(x,lag=par5,difference=par4)
bitmap(file='picts.png')
op <- par(mfrow=c(2,1))
plot(ox,type='l',main='Original Time Series',xlab='time',ylab='value')
if (par8=='') {
mytitle <- paste('Working Time Series (lambda=',par2,', d=',par3,', D=',par4,')',sep='')
mysub <- paste('(lambda=',par2,', d=',par3,', D=',par4,', CI=', par7, ', CI type=',par6,')',sep='')
} else {
mytitle <- paste('Working Time Series (base=',par8,', d=',par3,', D=',par4,')',sep='')
mysub <- paste('(base=',par8,', d=',par3,', D=',par4,', CI=', par7, ', CI type=',par6,')',sep='')
}
plot(x,type='l', main=mytitle,xlab='time',ylab='value')
par(op)
dev.off()
bitmap(file='pic1.png')
racf <- acf(x, par1, main='Autocorrelation', xlab='time lag', ylab='ACF', ci.type=par6, ci=par7, sub=mysub)
dev.off()
bitmap(file='pic2.png')
rpacf <- pacf(x,par1,main='Partial Autocorrelation',xlab='lags',ylab='PACF',sub=mysub)
dev.off()
(myacf <- c(racf$acf))
(mypacf <- c(rpacf$acf))
lengthx <- length(x)
sqrtn <- sqrt(lengthx)
load(file='createtable')
a<-table.start()
a<-table.row.start(a)
a<-table.element(a,'Autocorrelation Function',4,TRUE)
a<-table.row.end(a)
a<-table.row.start(a)
a<-table.element(a,'Time lag k',header=TRUE)
a<-table.element(a,hyperlink('basics.htm','ACF(k)','click here for more information about the Autocorrelation Function'),header=TRUE)
a<-table.element(a,'T-STAT',header=TRUE)
a<-table.element(a,'P-value',header=TRUE)
a<-table.row.end(a)
for (i in 2:(par1+1)) {
a<-table.row.start(a)
a<-table.element(a,i-1,header=TRUE)
a<-table.element(a,round(myacf[i],6))
mytstat <- myacf[i]*sqrtn
a<-table.element(a,round(mytstat,4))
a<-table.element(a,round(1-pt(abs(mytstat),lengthx),6))
a<-table.row.end(a)
}
a<-table.end(a)
table.save(a,file='mytable.tab')
a<-table.start()
a<-table.row.start(a)
a<-table.element(a,'Partial Autocorrelation Function',4,TRUE)
a<-table.row.end(a)
a<-table.row.start(a)
a<-table.element(a,'Time lag k',header=TRUE)
a<-table.element(a,hyperlink('basics.htm','PACF(k)','click here for more information about the Partial Autocorrelation Function'),header=TRUE)
a<-table.element(a,'T-STAT',header=TRUE)
a<-table.element(a,'P-value',header=TRUE)
a<-table.row.end(a)
for (i in 1:par1) {
a<-table.row.start(a)
a<-table.element(a,i,header=TRUE)
a<-table.element(a,round(mypacf[i],6))
mytstat <- mypacf[i]*sqrtn
a<-table.element(a,round(mytstat,4))
a<-table.element(a,round(1-pt(abs(mytstat),lengthx),6))
a<-table.row.end(a)
}
a<-table.end(a)
table.save(a,file='mytable1.tab')