Free Statistics

of Irreproducible Research!

Author's title

Author*The author of this computation has been verified*
R Software Modulerwasp_Bayesian_Two_Sample_Test.wasp
Title produced by softwareBayesian Two Sample Test
Date of computationSun, 15 Nov 2015 10:13:20 +0000
Cite this page as followsStatistical Computations at FreeStatistics.org, Office for Research Development and Education, URL https://freestatistics.org/blog/index.php?v=date/2015/Nov/15/t14475825401g8v4dmkbs5ud4p.htm/, Retrieved Wed, 15 May 2024 03:58:19 +0000
Statistical Computations at FreeStatistics.org, Office for Research Development and Education, URL https://freestatistics.org/blog/index.php?pk=283334, Retrieved Wed, 15 May 2024 03:58:19 +0000
QR Codes:

Original text written by user:
IsPrivate?No (this computation is public)
User-defined keywords
Estimated Impact222
Family? (F = Feedback message, R = changed R code, M = changed R Module, P = changed Parameters, D = changed Data)
-       [Bayesian Two Sample Test] [] [2015-11-15 10:13:20] [63a9f0ea7bb98050796b649e85481845] [Current]
- RMPD    [Paired and Unpaired Two Samples Tests about the Mean] [Vraag 1] [2017-01-23 21:30:02] [d9a9804931b13fa8d11c0bb2c879e0de]
Feedback Forum

Post a new message
Dataseries X:
5.77	3.88
5.33	3.55
4.59	3.29
4.33	2.59
3.66	2.33
4.48	3.59


Summary of computational transaction
Raw Inputview raw input (R code)
Raw Outputview raw output of R engine
Computing time14 seconds
R Server'Gertrude Mary Cox' @ cox.wessa.net

\begin{tabular}{lllllllll}
\hline
Summary of computational transaction \tabularnewline
Raw Input & view raw input (R code)  \tabularnewline
Raw Output & view raw output of R engine  \tabularnewline
Computing time & 14 seconds \tabularnewline
R Server & 'Gertrude Mary Cox' @ cox.wessa.net \tabularnewline
\hline
\end{tabular}
%Source: https://freestatistics.org/blog/index.php?pk=283334&T=0

[TABLE]
[ROW][C]Summary of computational transaction[/C][/ROW]
[ROW][C]Raw Input[/C][C]view raw input (R code) [/C][/ROW]
[ROW][C]Raw Output[/C][C]view raw output of R engine [/C][/ROW]
[ROW][C]Computing time[/C][C]14 seconds[/C][/ROW]
[ROW][C]R Server[/C][C]'Gertrude Mary Cox' @ cox.wessa.net[/C][/ROW]
[/TABLE]
Source: https://freestatistics.org/blog/index.php?pk=283334&T=0

Globally Unique Identifier (entire table): ba.freestatistics.org/blog/index.php?pk=283334&T=0

As an alternative you can also use a QR Code:  

The GUIDs for individual cells are displayed in the table below:

Summary of computational transaction
Raw Inputview raw input (R code)
Raw Outputview raw output of R engine
Computing time14 seconds
R Server'Gertrude Mary Cox' @ cox.wessa.net


Bayesian Two Sample Test
> summary(r, credMass = par4, compValeff = par3)
            mean median  mode HDI%   HDIlo  HDIup compVal %>compVal
mu1        4.688  4.684 4.645   97  3.5921   5.83                  
mu2        3.214  3.220 3.254   97  2.3094   4.10                  
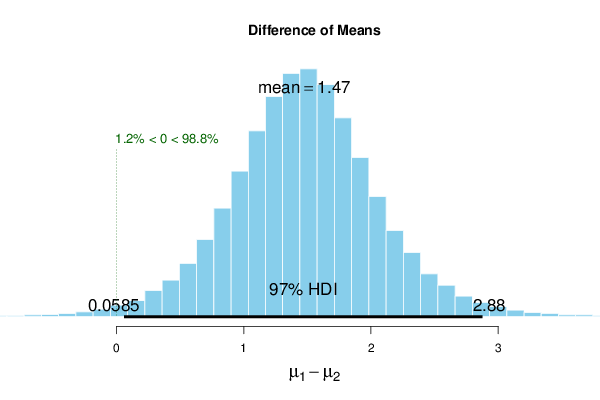
muDiff     1.474  1.470 1.474   97  0.0585   2.88       0      98.8
sigma1     1.022  0.890 0.719   97  0.3355   2.32                  
sigma2     0.832  0.728 0.609   97  0.2836   1.88                  
sigmaDiff  0.189  0.153 0.124   97 -1.4366   1.90       0      64.1
nu        33.636 25.168 8.815   97  1.0098 106.92                  
log10nu    1.363  1.401 1.506   97  0.4647   2.16                  
effSz      1.702  1.685 1.667   97  0.0228   3.45       0      98.8

\begin{tabular}{lllllllll}
\hline
Bayesian Two Sample Test \tabularnewline
> summary(r, credMass = par4, compValeff = par3)
            mean median  mode HDI%   HDIlo  HDIup compVal %>compVal
mu1        4.688  4.684 4.645   97  3.5921   5.83                  
mu2        3.214  3.220 3.254   97  2.3094   4.10                  
muDiff     1.474  1.470 1.474   97  0.0585   2.88       0      98.8
sigma1     1.022  0.890 0.719   97  0.3355   2.32                  
sigma2     0.832  0.728 0.609   97  0.2836   1.88                  
sigmaDiff  0.189  0.153 0.124   97 -1.4366   1.90       0      64.1
nu        33.636 25.168 8.815   97  1.0098 106.92                  
log10nu    1.363  1.401 1.506   97  0.4647   2.16                  
effSz      1.702  1.685 1.667   97  0.0228   3.45       0      98.8
\tabularnewline \hline \end{tabular} %Source: https://freestatistics.org/blog/index.php?pk=283334&T=1

[TABLE]
[ROW][C]Bayesian Two Sample Test[/C][/ROW]
[ROW][C]
> summary(r, credMass = par4, compValeff = par3)
            mean median  mode HDI%   HDIlo  HDIup compVal %>compVal
mu1        4.688  4.684 4.645   97  3.5921   5.83                  
mu2        3.214  3.220 3.254   97  2.3094   4.10                  
muDiff     1.474  1.470 1.474   97  0.0585   2.88       0      98.8
sigma1     1.022  0.890 0.719   97  0.3355   2.32                  
sigma2     0.832  0.728 0.609   97  0.2836   1.88                  
sigmaDiff  0.189  0.153 0.124   97 -1.4366   1.90       0      64.1
nu        33.636 25.168 8.815   97  1.0098 106.92                  
log10nu    1.363  1.401 1.506   97  0.4647   2.16                  
effSz      1.702  1.685 1.667   97  0.0228   3.45       0      98.8
[/C][/ROW] [/TABLE] Source: https://freestatistics.org/blog/index.php?pk=283334&T=1

Globally Unique Identifier (entire table): ba.freestatistics.org/blog/index.php?pk=283334&T=1

As an alternative you can also use a QR Code:  

The GUIDs for individual cells are displayed in the table below:

Bayesian Two Sample Test
> summary(r, credMass = par4, compValeff = par3)
            mean median  mode HDI%   HDIlo  HDIup compVal %>compVal
mu1        4.688  4.684 4.645   97  3.5921   5.83                  
mu2        3.214  3.220 3.254   97  2.3094   4.10                  
muDiff     1.474  1.470 1.474   97  0.0585   2.88       0      98.8
sigma1     1.022  0.890 0.719   97  0.3355   2.32                  
sigma2     0.832  0.728 0.609   97  0.2836   1.88                  
sigmaDiff  0.189  0.153 0.124   97 -1.4366   1.90       0      64.1
nu        33.636 25.168 8.815   97  1.0098 106.92                  
log10nu    1.363  1.401 1.506   97  0.4647   2.16                  
effSz      1.702  1.685 1.667   97  0.0228   3.45       0      98.8


Parameters (Session):
par1 = 1 ; par2 = 2 ; par3 = 0 ; par4 = 0.97 ; par5 = unpaired ; par6 = no ;
Parameters (R input):
par1 = 1 ; par2 = 2 ; par3 = 0 ; par4 = 0.97 ; par5 = unpaired ; par6 = no ; par7 = ; par8 = ; par9 = ; par10 = ; par11 = ; par12 = ; par13 = ; par14 = ; par15 = ; par16 = ;
R code (references can be found in the software module):
library(BEST)
par1 <- as.numeric(par1) #column number of first sample
par2 <- as.numeric(par2) #column number of second sample
par3 <- as.numeric(par3)
par4 <- as.numeric(par4)
if(par6=='yes') {
par7 <- as.numeric(par7)
par8 <- as.numeric(par8)
par9 <- as.numeric(par9)
par10 <- as.numeric(par10)
par11 <- as.numeric(par11)
par12 <- as.numeric(par12)
par13 <- as.numeric(par13)
par14 <- as.numeric(par14)
par15 <- as.numeric(par15)
par16 <- as.numeric(par16)
}
z <- t(y)
if (par1 == par2) stop('Please, select two different column numbers')
if (par1 < 1) stop('Please, select a column number greater than zero for the first sample')
if (par2 < 1) stop('Please, select a column number greater than zero for the second sample')
if (par1 > length(z[1,])) stop('The column number for the first sample should be smaller')
if (par2 > length(z[1,])) stop('The column number for the second sample should be smaller')
if(par6=='no') {
if(par5=='unpaired') {
(r <- BESTmcmc(z[,par1],z[,par2], parallel=F))
}
if(par5=='paired') {
(r <- BESTmcmc(z[,par1]-z[,par2], parallel=F))
}
} else {
yy <- cbind(z[1,],z[2,])
if(par5=='unpaired') {
(r <- BESTmcmc(z[,par1],z[,par2], priors=list(muM = c(par7,par8), muSD = c(par9,par10), sigmaMode = c(par11,par12), sigmaSD = c(par13,par14), nuMean = par15, nuSD = par16), parallel=F))
}
if(par5=='paired') {
(r <- BESTmcmc(z[,par1]-z[,par2], priors=list(muM = c(par7,par8), muSD = c(par9,par10), sigmaMode = c(par11,par12), sigmaSD = c(par13,par14), nuMean = par15, nuSD = par16), parallel=F))
}
}
bitmap(file='test2.png')
plot(r, credMass=par4, compVal=par3)
dev.off()
load(file='createtable')
a<-table.start()
a<-table.row.start(a)
a<-table.element(a,'Bayesian Two Sample Test',1,TRUE)
a<-table.row.end(a)
a<-table.row.start(a)
a<-table.element(a,paste('
',RC.texteval('summary(r, credMass=par4, compValeff=par3)'),'
',sep=''))
a<-table.row.end(a)
a<-table.end(a)
table.save(a,file='mytable.tab')