\begin{tabular}{lllllllll}
\hline
Summary of computational transaction \tabularnewline
Raw Input & view raw input (R code)  \tabularnewline
Raw Output & view raw output of R engine  \tabularnewline
Computing time & 1 seconds \tabularnewline
R Server & 'Gwilym Jenkins' @ jenkins.wessa.net \tabularnewline
\hline
\end{tabular}
%Source: https://freestatistics.org/blog/index.php?pk=283324&T=0
[TABLE]
[ROW][C]Summary of computational transaction[/C][/ROW]
[ROW][C]Raw Input[/C][C]view raw input (R code) [/C][/ROW]
[ROW][C]Raw Output[/C][C]view raw output of R engine [/C][/ROW]
[ROW][C]Computing time[/C][C]1 seconds[/C][/ROW]
[ROW][C]R Server[/C][C]'Gwilym Jenkins' @ jenkins.wessa.net[/C][/ROW]
[/TABLE]
Source: https://freestatistics.org/blog/index.php?pk=283324&T=0
If you paste this QR Code into your document, anyone with a smartphone or tablet will be able to scan it and view this table in a browser.
If you paste this QR Code into your document, anyone with a smartphone or tablet will be able to scan it and view this table in a browser.
If you paste this QR Code into your document, anyone with a smartphone or tablet will be able to scan it and view this table in a browser.
If you paste this QR Code into your document, anyone with a smartphone or tablet will be able to scan it and view this table in a browser.
If you paste this QR Code into your document, anyone with a smartphone or tablet will be able to scan it and view this table in a browser.
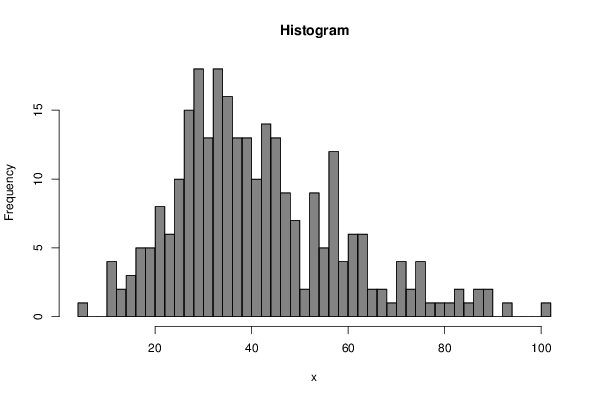
| Frequency Table (Histogram) | | Bins | Midpoint | Abs. Frequency | Rel. Frequency | Cumul. Rel. Freq. | Density | | [4,6[ | 5 | 1 | 0.00365 | 0.00365 | 0.001825 | | [6,8[ | 7 | 0 | 0 | 0.00365 | 0 | | [8,10[ | 9 | 0 | 0 | 0.00365 | 0 | | [10,12[ | 11 | 4 | 0.014599 | 0.018248 | 0.007299 | | [12,14[ | 13 | 2 | 0.007299 | 0.025547 | 0.00365 | | [14,16[ | 15 | 3 | 0.010949 | 0.036496 | 0.005474 | | [16,18[ | 17 | 5 | 0.018248 | 0.054745 | 0.009124 | | [18,20[ | 19 | 5 | 0.018248 | 0.072993 | 0.009124 | | [20,22[ | 21 | 8 | 0.029197 | 0.10219 | 0.014599 | | [22,24[ | 23 | 6 | 0.021898 | 0.124088 | 0.010949 | | [24,26[ | 25 | 10 | 0.036496 | 0.160584 | 0.018248 | | [26,28[ | 27 | 15 | 0.054745 | 0.215328 | 0.027372 | | [28,30[ | 29 | 18 | 0.065693 | 0.281022 | 0.032847 | | [30,32[ | 31 | 13 | 0.047445 | 0.328467 | 0.023723 | | [32,34[ | 33 | 18 | 0.065693 | 0.394161 | 0.032847 | | [34,36[ | 35 | 16 | 0.058394 | 0.452555 | 0.029197 | | [36,38[ | 37 | 13 | 0.047445 | 0.5 | 0.023723 | | [38,40[ | 39 | 13 | 0.047445 | 0.547445 | 0.023723 | | [40,42[ | 41 | 10 | 0.036496 | 0.583942 | 0.018248 | | [42,44[ | 43 | 14 | 0.051095 | 0.635036 | 0.025547 | | [44,46[ | 45 | 13 | 0.047445 | 0.682482 | 0.023723 | | [46,48[ | 47 | 9 | 0.032847 | 0.715328 | 0.016423 | | [48,50[ | 49 | 7 | 0.025547 | 0.740876 | 0.012774 | | [50,52[ | 51 | 2 | 0.007299 | 0.748175 | 0.00365 | | [52,54[ | 53 | 9 | 0.032847 | 0.781022 | 0.016423 | | [54,56[ | 55 | 5 | 0.018248 | 0.79927 | 0.009124 | | [56,58[ | 57 | 12 | 0.043796 | 0.843066 | 0.021898 | | [58,60[ | 59 | 4 | 0.014599 | 0.857664 | 0.007299 | | [60,62[ | 61 | 6 | 0.021898 | 0.879562 | 0.010949 | | [62,64[ | 63 | 6 | 0.021898 | 0.90146 | 0.010949 | | [64,66[ | 65 | 2 | 0.007299 | 0.908759 | 0.00365 | | [66,68[ | 67 | 2 | 0.007299 | 0.916058 | 0.00365 | | [68,70[ | 69 | 1 | 0.00365 | 0.919708 | 0.001825 | | [70,72[ | 71 | 4 | 0.014599 | 0.934307 | 0.007299 | | [72,74[ | 73 | 2 | 0.007299 | 0.941606 | 0.00365 | | [74,76[ | 75 | 4 | 0.014599 | 0.956204 | 0.007299 | | [76,78[ | 77 | 1 | 0.00365 | 0.959854 | 0.001825 | | [78,80[ | 79 | 1 | 0.00365 | 0.963504 | 0.001825 | | [80,82[ | 81 | 1 | 0.00365 | 0.967153 | 0.001825 | | [82,84[ | 83 | 2 | 0.007299 | 0.974453 | 0.00365 | | [84,86[ | 85 | 1 | 0.00365 | 0.978102 | 0.001825 | | [86,88[ | 87 | 2 | 0.007299 | 0.985401 | 0.00365 | | [88,90[ | 89 | 2 | 0.007299 | 0.992701 | 0.00365 | | [90,92[ | 91 | 0 | 0 | 0.992701 | 0 | | [92,94[ | 93 | 1 | 0.00365 | 0.99635 | 0.001825 | | [94,96[ | 95 | 0 | 0 | 0.99635 | 0 | | [96,98[ | 97 | 0 | 0 | 0.99635 | 0 | | [98,100[ | 99 | 0 | 0 | 0.99635 | 0 | | [100,102] | 101 | 1 | 0.00365 | 1 | 0.001825 |
\begin{tabular}{lllllllll}
\hline
Frequency Table (Histogram) \tabularnewline
Bins & Midpoint & Abs. Frequency & Rel. Frequency & Cumul. Rel. Freq. & Density \tabularnewline
[4,6[ & 5 & 1 & 0.00365 & 0.00365 & 0.001825 \tabularnewline
[6,8[ & 7 & 0 & 0 & 0.00365 & 0 \tabularnewline
[8,10[ & 9 & 0 & 0 & 0.00365 & 0 \tabularnewline
[10,12[ & 11 & 4 & 0.014599 & 0.018248 & 0.007299 \tabularnewline
[12,14[ & 13 & 2 & 0.007299 & 0.025547 & 0.00365 \tabularnewline
[14,16[ & 15 & 3 & 0.010949 & 0.036496 & 0.005474 \tabularnewline
[16,18[ & 17 & 5 & 0.018248 & 0.054745 & 0.009124 \tabularnewline
[18,20[ & 19 & 5 & 0.018248 & 0.072993 & 0.009124 \tabularnewline
[20,22[ & 21 & 8 & 0.029197 & 0.10219 & 0.014599 \tabularnewline
[22,24[ & 23 & 6 & 0.021898 & 0.124088 & 0.010949 \tabularnewline
[24,26[ & 25 & 10 & 0.036496 & 0.160584 & 0.018248 \tabularnewline
[26,28[ & 27 & 15 & 0.054745 & 0.215328 & 0.027372 \tabularnewline
[28,30[ & 29 & 18 & 0.065693 & 0.281022 & 0.032847 \tabularnewline
[30,32[ & 31 & 13 & 0.047445 & 0.328467 & 0.023723 \tabularnewline
[32,34[ & 33 & 18 & 0.065693 & 0.394161 & 0.032847 \tabularnewline
[34,36[ & 35 & 16 & 0.058394 & 0.452555 & 0.029197 \tabularnewline
[36,38[ & 37 & 13 & 0.047445 & 0.5 & 0.023723 \tabularnewline
[38,40[ & 39 & 13 & 0.047445 & 0.547445 & 0.023723 \tabularnewline
[40,42[ & 41 & 10 & 0.036496 & 0.583942 & 0.018248 \tabularnewline
[42,44[ & 43 & 14 & 0.051095 & 0.635036 & 0.025547 \tabularnewline
[44,46[ & 45 & 13 & 0.047445 & 0.682482 & 0.023723 \tabularnewline
[46,48[ & 47 & 9 & 0.032847 & 0.715328 & 0.016423 \tabularnewline
[48,50[ & 49 & 7 & 0.025547 & 0.740876 & 0.012774 \tabularnewline
[50,52[ & 51 & 2 & 0.007299 & 0.748175 & 0.00365 \tabularnewline
[52,54[ & 53 & 9 & 0.032847 & 0.781022 & 0.016423 \tabularnewline
[54,56[ & 55 & 5 & 0.018248 & 0.79927 & 0.009124 \tabularnewline
[56,58[ & 57 & 12 & 0.043796 & 0.843066 & 0.021898 \tabularnewline
[58,60[ & 59 & 4 & 0.014599 & 0.857664 & 0.007299 \tabularnewline
[60,62[ & 61 & 6 & 0.021898 & 0.879562 & 0.010949 \tabularnewline
[62,64[ & 63 & 6 & 0.021898 & 0.90146 & 0.010949 \tabularnewline
[64,66[ & 65 & 2 & 0.007299 & 0.908759 & 0.00365 \tabularnewline
[66,68[ & 67 & 2 & 0.007299 & 0.916058 & 0.00365 \tabularnewline
[68,70[ & 69 & 1 & 0.00365 & 0.919708 & 0.001825 \tabularnewline
[70,72[ & 71 & 4 & 0.014599 & 0.934307 & 0.007299 \tabularnewline
[72,74[ & 73 & 2 & 0.007299 & 0.941606 & 0.00365 \tabularnewline
[74,76[ & 75 & 4 & 0.014599 & 0.956204 & 0.007299 \tabularnewline
[76,78[ & 77 & 1 & 0.00365 & 0.959854 & 0.001825 \tabularnewline
[78,80[ & 79 & 1 & 0.00365 & 0.963504 & 0.001825 \tabularnewline
[80,82[ & 81 & 1 & 0.00365 & 0.967153 & 0.001825 \tabularnewline
[82,84[ & 83 & 2 & 0.007299 & 0.974453 & 0.00365 \tabularnewline
[84,86[ & 85 & 1 & 0.00365 & 0.978102 & 0.001825 \tabularnewline
[86,88[ & 87 & 2 & 0.007299 & 0.985401 & 0.00365 \tabularnewline
[88,90[ & 89 & 2 & 0.007299 & 0.992701 & 0.00365 \tabularnewline
[90,92[ & 91 & 0 & 0 & 0.992701 & 0 \tabularnewline
[92,94[ & 93 & 1 & 0.00365 & 0.99635 & 0.001825 \tabularnewline
[94,96[ & 95 & 0 & 0 & 0.99635 & 0 \tabularnewline
[96,98[ & 97 & 0 & 0 & 0.99635 & 0 \tabularnewline
[98,100[ & 99 & 0 & 0 & 0.99635 & 0 \tabularnewline
[100,102] & 101 & 1 & 0.00365 & 1 & 0.001825 \tabularnewline
\hline
\end{tabular}
%Source: https://freestatistics.org/blog/index.php?pk=283324&T=1
[TABLE]
[ROW][C]Frequency Table (Histogram)[/C][/ROW]
[ROW][C]Bins[/C][C]Midpoint[/C][C]Abs. Frequency[/C][C]Rel. Frequency[/C][C]Cumul. Rel. Freq.[/C][C]Density[/C][/ROW]
[ROW][C][4,6[[/C][C]5[/C][C]1[/C][C]0.00365[/C][C]0.00365[/C][C]0.001825[/C][/ROW]
[ROW][C][6,8[[/C][C]7[/C][C]0[/C][C]0[/C][C]0.00365[/C][C]0[/C][/ROW]
[ROW][C][8,10[[/C][C]9[/C][C]0[/C][C]0[/C][C]0.00365[/C][C]0[/C][/ROW]
[ROW][C][10,12[[/C][C]11[/C][C]4[/C][C]0.014599[/C][C]0.018248[/C][C]0.007299[/C][/ROW]
[ROW][C][12,14[[/C][C]13[/C][C]2[/C][C]0.007299[/C][C]0.025547[/C][C]0.00365[/C][/ROW]
[ROW][C][14,16[[/C][C]15[/C][C]3[/C][C]0.010949[/C][C]0.036496[/C][C]0.005474[/C][/ROW]
[ROW][C][16,18[[/C][C]17[/C][C]5[/C][C]0.018248[/C][C]0.054745[/C][C]0.009124[/C][/ROW]
[ROW][C][18,20[[/C][C]19[/C][C]5[/C][C]0.018248[/C][C]0.072993[/C][C]0.009124[/C][/ROW]
[ROW][C][20,22[[/C][C]21[/C][C]8[/C][C]0.029197[/C][C]0.10219[/C][C]0.014599[/C][/ROW]
[ROW][C][22,24[[/C][C]23[/C][C]6[/C][C]0.021898[/C][C]0.124088[/C][C]0.010949[/C][/ROW]
[ROW][C][24,26[[/C][C]25[/C][C]10[/C][C]0.036496[/C][C]0.160584[/C][C]0.018248[/C][/ROW]
[ROW][C][26,28[[/C][C]27[/C][C]15[/C][C]0.054745[/C][C]0.215328[/C][C]0.027372[/C][/ROW]
[ROW][C][28,30[[/C][C]29[/C][C]18[/C][C]0.065693[/C][C]0.281022[/C][C]0.032847[/C][/ROW]
[ROW][C][30,32[[/C][C]31[/C][C]13[/C][C]0.047445[/C][C]0.328467[/C][C]0.023723[/C][/ROW]
[ROW][C][32,34[[/C][C]33[/C][C]18[/C][C]0.065693[/C][C]0.394161[/C][C]0.032847[/C][/ROW]
[ROW][C][34,36[[/C][C]35[/C][C]16[/C][C]0.058394[/C][C]0.452555[/C][C]0.029197[/C][/ROW]
[ROW][C][36,38[[/C][C]37[/C][C]13[/C][C]0.047445[/C][C]0.5[/C][C]0.023723[/C][/ROW]
[ROW][C][38,40[[/C][C]39[/C][C]13[/C][C]0.047445[/C][C]0.547445[/C][C]0.023723[/C][/ROW]
[ROW][C][40,42[[/C][C]41[/C][C]10[/C][C]0.036496[/C][C]0.583942[/C][C]0.018248[/C][/ROW]
[ROW][C][42,44[[/C][C]43[/C][C]14[/C][C]0.051095[/C][C]0.635036[/C][C]0.025547[/C][/ROW]
[ROW][C][44,46[[/C][C]45[/C][C]13[/C][C]0.047445[/C][C]0.682482[/C][C]0.023723[/C][/ROW]
[ROW][C][46,48[[/C][C]47[/C][C]9[/C][C]0.032847[/C][C]0.715328[/C][C]0.016423[/C][/ROW]
[ROW][C][48,50[[/C][C]49[/C][C]7[/C][C]0.025547[/C][C]0.740876[/C][C]0.012774[/C][/ROW]
[ROW][C][50,52[[/C][C]51[/C][C]2[/C][C]0.007299[/C][C]0.748175[/C][C]0.00365[/C][/ROW]
[ROW][C][52,54[[/C][C]53[/C][C]9[/C][C]0.032847[/C][C]0.781022[/C][C]0.016423[/C][/ROW]
[ROW][C][54,56[[/C][C]55[/C][C]5[/C][C]0.018248[/C][C]0.79927[/C][C]0.009124[/C][/ROW]
[ROW][C][56,58[[/C][C]57[/C][C]12[/C][C]0.043796[/C][C]0.843066[/C][C]0.021898[/C][/ROW]
[ROW][C][58,60[[/C][C]59[/C][C]4[/C][C]0.014599[/C][C]0.857664[/C][C]0.007299[/C][/ROW]
[ROW][C][60,62[[/C][C]61[/C][C]6[/C][C]0.021898[/C][C]0.879562[/C][C]0.010949[/C][/ROW]
[ROW][C][62,64[[/C][C]63[/C][C]6[/C][C]0.021898[/C][C]0.90146[/C][C]0.010949[/C][/ROW]
[ROW][C][64,66[[/C][C]65[/C][C]2[/C][C]0.007299[/C][C]0.908759[/C][C]0.00365[/C][/ROW]
[ROW][C][66,68[[/C][C]67[/C][C]2[/C][C]0.007299[/C][C]0.916058[/C][C]0.00365[/C][/ROW]
[ROW][C][68,70[[/C][C]69[/C][C]1[/C][C]0.00365[/C][C]0.919708[/C][C]0.001825[/C][/ROW]
[ROW][C][70,72[[/C][C]71[/C][C]4[/C][C]0.014599[/C][C]0.934307[/C][C]0.007299[/C][/ROW]
[ROW][C][72,74[[/C][C]73[/C][C]2[/C][C]0.007299[/C][C]0.941606[/C][C]0.00365[/C][/ROW]
[ROW][C][74,76[[/C][C]75[/C][C]4[/C][C]0.014599[/C][C]0.956204[/C][C]0.007299[/C][/ROW]
[ROW][C][76,78[[/C][C]77[/C][C]1[/C][C]0.00365[/C][C]0.959854[/C][C]0.001825[/C][/ROW]
[ROW][C][78,80[[/C][C]79[/C][C]1[/C][C]0.00365[/C][C]0.963504[/C][C]0.001825[/C][/ROW]
[ROW][C][80,82[[/C][C]81[/C][C]1[/C][C]0.00365[/C][C]0.967153[/C][C]0.001825[/C][/ROW]
[ROW][C][82,84[[/C][C]83[/C][C]2[/C][C]0.007299[/C][C]0.974453[/C][C]0.00365[/C][/ROW]
[ROW][C][84,86[[/C][C]85[/C][C]1[/C][C]0.00365[/C][C]0.978102[/C][C]0.001825[/C][/ROW]
[ROW][C][86,88[[/C][C]87[/C][C]2[/C][C]0.007299[/C][C]0.985401[/C][C]0.00365[/C][/ROW]
[ROW][C][88,90[[/C][C]89[/C][C]2[/C][C]0.007299[/C][C]0.992701[/C][C]0.00365[/C][/ROW]
[ROW][C][90,92[[/C][C]91[/C][C]0[/C][C]0[/C][C]0.992701[/C][C]0[/C][/ROW]
[ROW][C][92,94[[/C][C]93[/C][C]1[/C][C]0.00365[/C][C]0.99635[/C][C]0.001825[/C][/ROW]
[ROW][C][94,96[[/C][C]95[/C][C]0[/C][C]0[/C][C]0.99635[/C][C]0[/C][/ROW]
[ROW][C][96,98[[/C][C]97[/C][C]0[/C][C]0[/C][C]0.99635[/C][C]0[/C][/ROW]
[ROW][C][98,100[[/C][C]99[/C][C]0[/C][C]0[/C][C]0.99635[/C][C]0[/C][/ROW]
[ROW][C][100,102][/C][C]101[/C][C]1[/C][C]0.00365[/C][C]1[/C][C]0.001825[/C][/ROW]
[/TABLE]
Source: https://freestatistics.org/blog/index.php?pk=283324&T=1
Globally Unique Identifier (entire table): ba.freestatistics.org/blog/index.php?pk=283324&T=1
As an alternative you can also use a QR Code:
The GUIDs for individual cells are displayed in the table below:
| Frequency Table (Histogram) | | Bins | Midpoint | Abs. Frequency | Rel. Frequency | Cumul. Rel. Freq. | Density | | [4,6[ | 5 | 1 | 0.00365 | 0.00365 | 0.001825 | | [6,8[ | 7 | 0 | 0 | 0.00365 | 0 | | [8,10[ | 9 | 0 | 0 | 0.00365 | 0 | | [10,12[ | 11 | 4 | 0.014599 | 0.018248 | 0.007299 | | [12,14[ | 13 | 2 | 0.007299 | 0.025547 | 0.00365 | | [14,16[ | 15 | 3 | 0.010949 | 0.036496 | 0.005474 | | [16,18[ | 17 | 5 | 0.018248 | 0.054745 | 0.009124 | | [18,20[ | 19 | 5 | 0.018248 | 0.072993 | 0.009124 | | [20,22[ | 21 | 8 | 0.029197 | 0.10219 | 0.014599 | | [22,24[ | 23 | 6 | 0.021898 | 0.124088 | 0.010949 | | [24,26[ | 25 | 10 | 0.036496 | 0.160584 | 0.018248 | | [26,28[ | 27 | 15 | 0.054745 | 0.215328 | 0.027372 | | [28,30[ | 29 | 18 | 0.065693 | 0.281022 | 0.032847 | | [30,32[ | 31 | 13 | 0.047445 | 0.328467 | 0.023723 | | [32,34[ | 33 | 18 | 0.065693 | 0.394161 | 0.032847 | | [34,36[ | 35 | 16 | 0.058394 | 0.452555 | 0.029197 | | [36,38[ | 37 | 13 | 0.047445 | 0.5 | 0.023723 | | [38,40[ | 39 | 13 | 0.047445 | 0.547445 | 0.023723 | | [40,42[ | 41 | 10 | 0.036496 | 0.583942 | 0.018248 | | [42,44[ | 43 | 14 | 0.051095 | 0.635036 | 0.025547 | | [44,46[ | 45 | 13 | 0.047445 | 0.682482 | 0.023723 | | [46,48[ | 47 | 9 | 0.032847 | 0.715328 | 0.016423 | | [48,50[ | 49 | 7 | 0.025547 | 0.740876 | 0.012774 | | [50,52[ | 51 | 2 | 0.007299 | 0.748175 | 0.00365 | | [52,54[ | 53 | 9 | 0.032847 | 0.781022 | 0.016423 | | [54,56[ | 55 | 5 | 0.018248 | 0.79927 | 0.009124 | | [56,58[ | 57 | 12 | 0.043796 | 0.843066 | 0.021898 | | [58,60[ | 59 | 4 | 0.014599 | 0.857664 | 0.007299 | | [60,62[ | 61 | 6 | 0.021898 | 0.879562 | 0.010949 | | [62,64[ | 63 | 6 | 0.021898 | 0.90146 | 0.010949 | | [64,66[ | 65 | 2 | 0.007299 | 0.908759 | 0.00365 | | [66,68[ | 67 | 2 | 0.007299 | 0.916058 | 0.00365 | | [68,70[ | 69 | 1 | 0.00365 | 0.919708 | 0.001825 | | [70,72[ | 71 | 4 | 0.014599 | 0.934307 | 0.007299 | | [72,74[ | 73 | 2 | 0.007299 | 0.941606 | 0.00365 | | [74,76[ | 75 | 4 | 0.014599 | 0.956204 | 0.007299 | | [76,78[ | 77 | 1 | 0.00365 | 0.959854 | 0.001825 | | [78,80[ | 79 | 1 | 0.00365 | 0.963504 | 0.001825 | | [80,82[ | 81 | 1 | 0.00365 | 0.967153 | 0.001825 | | [82,84[ | 83 | 2 | 0.007299 | 0.974453 | 0.00365 | | [84,86[ | 85 | 1 | 0.00365 | 0.978102 | 0.001825 | | [86,88[ | 87 | 2 | 0.007299 | 0.985401 | 0.00365 | | [88,90[ | 89 | 2 | 0.007299 | 0.992701 | 0.00365 | | [90,92[ | 91 | 0 | 0 | 0.992701 | 0 | | [92,94[ | 93 | 1 | 0.00365 | 0.99635 | 0.001825 | | [94,96[ | 95 | 0 | 0 | 0.99635 | 0 | | [96,98[ | 97 | 0 | 0 | 0.99635 | 0 | | [98,100[ | 99 | 0 | 0 | 0.99635 | 0 | | [100,102] | 101 | 1 | 0.00365 | 1 | 0.001825 |
If you paste this QR Code into your document, anyone with a smartphone or tablet will be able to scan it and view this table in a browser.
If you paste this QR Code into your document, anyone with a smartphone or tablet will be able to scan it and view this table in a browser.
If you paste this QR Code into your document, anyone with a smartphone or tablet will be able to scan it and view this table in a browser.
If you paste this QR Code into your document, anyone with a smartphone or tablet will be able to scan it and view this table in a browser.
If you paste this QR Code into your document, anyone with a smartphone or tablet will be able to scan it and view this table in a browser.
|