Free Statistics
of Irreproducible Research!
Description of Statistical Computation | |||||||||||||||||||||||||||||||||||||||
|---|---|---|---|---|---|---|---|---|---|---|---|---|---|---|---|---|---|---|---|---|---|---|---|---|---|---|---|---|---|---|---|---|---|---|---|---|---|---|---|
| Author's title | |||||||||||||||||||||||||||||||||||||||
| Author | *The author of this computation has been verified* | ||||||||||||||||||||||||||||||||||||||
| R Software Module | rwasp_fitdistrnorm.wasp | ||||||||||||||||||||||||||||||||||||||
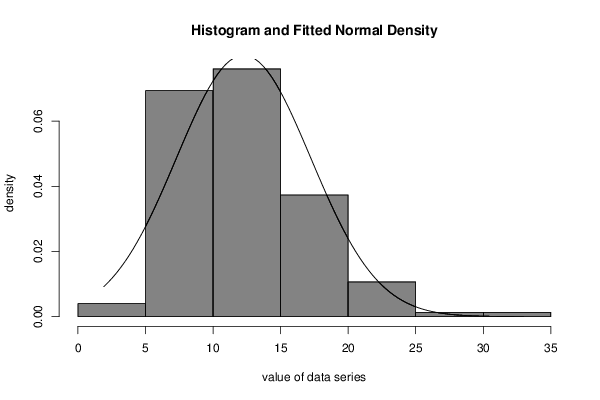
| Title produced by software | ML Fitting and QQ Plot- Normal Distribution | ||||||||||||||||||||||||||||||||||||||
| Date of computation | Sun, 08 Nov 2015 15:27:31 +0000 | ||||||||||||||||||||||||||||||||||||||
| Cite this page as follows | Statistical Computations at FreeStatistics.org, Office for Research Development and Education, URL https://freestatistics.org/blog/index.php?v=date/2015/Nov/08/t1446996494fnnj93zj1hbfvbm.htm/, Retrieved Tue, 14 May 2024 05:01:15 +0000 | ||||||||||||||||||||||||||||||||||||||
| Statistical Computations at FreeStatistics.org, Office for Research Development and Education, URL https://freestatistics.org/blog/index.php?pk=283250, Retrieved Tue, 14 May 2024 05:01:15 +0000 | |||||||||||||||||||||||||||||||||||||||
| QR Codes: | |||||||||||||||||||||||||||||||||||||||
|
| |||||||||||||||||||||||||||||||||||||||
| Original text written by user: | |||||||||||||||||||||||||||||||||||||||
| IsPrivate? | No (this computation is public) | ||||||||||||||||||||||||||||||||||||||
| User-defined keywords | |||||||||||||||||||||||||||||||||||||||
| Estimated Impact | 170 | ||||||||||||||||||||||||||||||||||||||
Tree of Dependent Computations | |||||||||||||||||||||||||||||||||||||||
| Family? (F = Feedback message, R = changed R code, M = changed R Module, P = changed Parameters, D = changed Data) | |||||||||||||||||||||||||||||||||||||||
| - [ML Fitting and QQ Plot- Normal Distribution] [] [2015-11-08 15:27:31] [7b81fac622814275349f5d25cf6bd6bd] [Current] | |||||||||||||||||||||||||||||||||||||||
| Feedback Forum | |||||||||||||||||||||||||||||||||||||||
Post a new message | |||||||||||||||||||||||||||||||||||||||
Dataset | |||||||||||||||||||||||||||||||||||||||
| Dataseries X: | |||||||||||||||||||||||||||||||||||||||
15.37779335 7.441479683 8.639896688 9.48567671 17.11085129 15.46197998 9.766567452 6.210563159 23.99424584 9.347228074 10.45919962 18.53673785 10.38345918 14.62060046 17.08464727 13.9126329 7.900858751 11.54993151 13.12347177 9.484504488 10.39815415 17.18609203 8.225969413 9.070139329 18.14226893 9.558424174 22.13941341 6.610126836 8.722481916 8.256957647 6.887398834 21.24776683 13.19384388 13.62052515 10.82271112 15.61814776 12.32855561 8.211985274 7.739333113 14.48922911 11.65815462 6.315704675 8.467571538 22.45147728 8.134206581 14.14805195 6.15140188 10.60859702 10.49301132 16.31386063 7.136148164 12.53687902 18.77200672 13.06349635 11.89409461 1.913671671 12.36429331 7.697994808 13.35312724 12.9898584 14.62261539 12.70999186 12.14607273 13.10189932 6.072777241 14.1265124 7.489955189 10.72684469 6.970797169 10.76998483 19.0183017 32.98324839 9.990534527 8.496364337 5.189052561 16.64641354 10.48315111 6.553312226 12.12606799 13.81248567 8.154195373 10.79419326 13.49985916 10.89529701 18.54371399 13.88984186 9.979817969 19.03951578 13.13623659 18.64815613 9.358429964 18.65845818 4.072074547 5.574745611 16.11224037 11.99003087 6.446609418 4.914779466 7.412119128 7.163279808 14.01093673 12.39406453 10.68542742 11.19173482 22.45688926 12.16337518 20.03768985 6.529735612 7.604106989 5.820255985 23.17500818 16.31305427 19.80025514 8.399035091 8.956819292 7.902613224 12.04775508 12.2281219 11.19263766 14.50070185 12.63733615 7.608334905 8.23736088 9.035213779 7.968139585 5.770985222 17.3827598 14.30598688 23.67296676 8.347690058 12.46112613 16.40390667 17.51347218 18.55121213 10.17967307 7.496190908 11.42358064 18.09692393 26.97547223 11.31202253 15.73452446 15.14377706 10.51955857 18.63769364 7.525532817 11.81656343 7.475627436 10.27492948 17.16432149 10.91029784 | |||||||||||||||||||||||||||||||||||||||
Tables (Output of Computation) | |||||||||||||||||||||||||||||||||||||||
| |||||||||||||||||||||||||||||||||||||||
Figures (Output of Computation) | |||||||||||||||||||||||||||||||||||||||
Input Parameters & R Code | |||||||||||||||||||||||||||||||||||||||
| Parameters (Session): | |||||||||||||||||||||||||||||||||||||||
| par1 = 8 ; par2 = 0 ; | |||||||||||||||||||||||||||||||||||||||
| Parameters (R input): | |||||||||||||||||||||||||||||||||||||||
| par1 = 8 ; par2 = 0 ; | |||||||||||||||||||||||||||||||||||||||
| R code (references can be found in the software module): | |||||||||||||||||||||||||||||||||||||||
library(MASS) | |||||||||||||||||||||||||||||||||||||||