Free Statistics
of Irreproducible Research!
Description of Statistical Computation | |||||||||||||||||||||||||||||||||||||||
|---|---|---|---|---|---|---|---|---|---|---|---|---|---|---|---|---|---|---|---|---|---|---|---|---|---|---|---|---|---|---|---|---|---|---|---|---|---|---|---|
| Author's title | |||||||||||||||||||||||||||||||||||||||
| Author | *The author of this computation has been verified* | ||||||||||||||||||||||||||||||||||||||
| R Software Module | rwasp_fitdistrnorm.wasp | ||||||||||||||||||||||||||||||||||||||
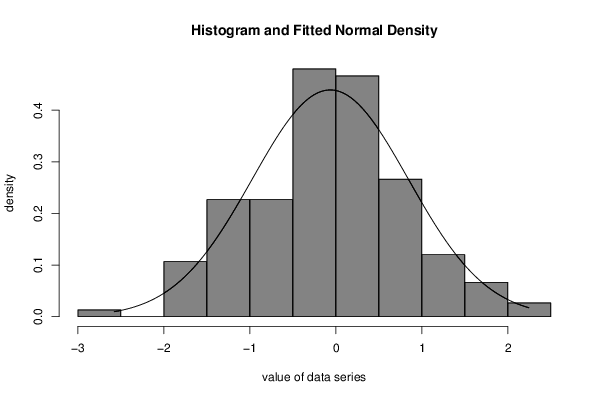
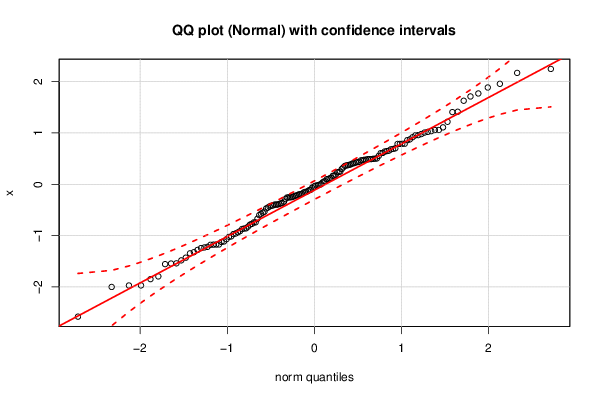
| Title produced by software | ML Fitting and QQ Plot- Normal Distribution | ||||||||||||||||||||||||||||||||||||||
| Date of computation | Sun, 08 Nov 2015 15:20:48 +0000 | ||||||||||||||||||||||||||||||||||||||
| Cite this page as follows | Statistical Computations at FreeStatistics.org, Office for Research Development and Education, URL https://freestatistics.org/blog/index.php?v=date/2015/Nov/08/t144699608013wee1jaznzv9nz.htm/, Retrieved Mon, 13 May 2024 23:21:39 +0000 | ||||||||||||||||||||||||||||||||||||||
| Statistical Computations at FreeStatistics.org, Office for Research Development and Education, URL https://freestatistics.org/blog/index.php?pk=283248, Retrieved Mon, 13 May 2024 23:21:39 +0000 | |||||||||||||||||||||||||||||||||||||||
| QR Codes: | |||||||||||||||||||||||||||||||||||||||
|
| |||||||||||||||||||||||||||||||||||||||
| Original text written by user: | |||||||||||||||||||||||||||||||||||||||
| IsPrivate? | No (this computation is public) | ||||||||||||||||||||||||||||||||||||||
| User-defined keywords | |||||||||||||||||||||||||||||||||||||||
| Estimated Impact | 164 | ||||||||||||||||||||||||||||||||||||||
Tree of Dependent Computations | |||||||||||||||||||||||||||||||||||||||
| Family? (F = Feedback message, R = changed R code, M = changed R Module, P = changed Parameters, D = changed Data) | |||||||||||||||||||||||||||||||||||||||
| - [ML Fitting and QQ Plot- Normal Distribution] [] [2015-11-08 15:20:48] [7b81fac622814275349f5d25cf6bd6bd] [Current] | |||||||||||||||||||||||||||||||||||||||
| Feedback Forum | |||||||||||||||||||||||||||||||||||||||
Post a new message | |||||||||||||||||||||||||||||||||||||||
Dataset | |||||||||||||||||||||||||||||||||||||||
| Dataseries X: | |||||||||||||||||||||||||||||||||||||||
-0.9573993856 -0.2518251025 1.107458715 0.0008697583706 -0.4543372521 -0.4185413845 0.5526514375 0.6369356958 -1.84720897 -0.9126451211 1.019707661 -0.2268118927 -0.1860477742 -1.278420873 -0.008874584436 -1.015380125 1.033585937 0.5027727447 0.05886830728 -0.5534354882 -1.242065975 0.4896765829 -0.3836177542 0.4665568248 0.3717442243 -0.1323218088 -0.3400132184 1.625568182 -0.1956503671 0.644735306 0.6996419639 -0.4713832427 -0.2548773059 0.9566730353 -0.2209101748 0.1647531501 -0.03169587279 -0.01814272936 0.6053710581 -1.123579669 1.767207375 0.4652421824 -0.2122835176 -0.06181063343 0.4977974701 -0.1482067429 0.1858136898 -0.25513033 0.2316450035 -1.970714942 0.3674488515 0.60899419 -1.481744296 0.6804740668 -0.8244768928 2.16767987 -0.7432260121 2.24464665 1.404444013 -0.6011369029 -1.32293757 0.4885417662 -0.414107447 0.246910061 0.430155729 0.6866489714 1.883964452 0.8576018551 0.7880897757 0.4108810213 0.09968694625 -2.57750508 -0.04689414809 -1.070377885 0.7849101369 -0.3673433031 0.4762297714 1.216150267 -0.5344261953 -0.2582244673 0.785225735 -0.4335643432 -1.02565103 0.2386463298 -1.178074324 -1.173686899 -0.1073454155 -0.870969106 0.78893325 -0.7719700171 0.1020488513 -1.173106921 1.005703055 -0.16383074 -1.555003951 -1.344990752 0.873994455 -0.3970528181 0.4950081906 1.954953703 0.952701132 0.03288607247 0.43616137 -0.1935409656 -0.8579453228 -1.543137434 0.05198761171 0.3561512535 0.9772040814 0.9155298675 -1.176258652 -0.2443395905 -1.968830375 0.6521160133 -0.861958924 1.709105878 -0.5728277993 -0.785403258 -0.3961140679 -0.3700435856 -1.539662978 0.1672430234 0.4790471848 0.4072661241 0.3287731671 1.411544253 -1.794164996 -1.218715859 -0.0259725499 0.1165059123 1.056240213 -0.671559526 -0.9690866645 -0.7416775042 -1.113549698 1.055705985 -0.1132843283 -1.230574654 -1.999258334 -0.3956718115 -0.1502310374 0.2969054124 0.1247458966 -0.9370588385 0.427412173 -1.429688764 0.4880913695 0.390051048 -0.2866826291 0.3788218083 | |||||||||||||||||||||||||||||||||||||||
Tables (Output of Computation) | |||||||||||||||||||||||||||||||||||||||
| |||||||||||||||||||||||||||||||||||||||
Figures (Output of Computation) | |||||||||||||||||||||||||||||||||||||||
Input Parameters & R Code | |||||||||||||||||||||||||||||||||||||||
| Parameters (Session): | |||||||||||||||||||||||||||||||||||||||
| par1 = 8 ; par2 = 0 ; | |||||||||||||||||||||||||||||||||||||||
| Parameters (R input): | |||||||||||||||||||||||||||||||||||||||
| par1 = 8 ; par2 = 0 ; | |||||||||||||||||||||||||||||||||||||||
| R code (references can be found in the software module): | |||||||||||||||||||||||||||||||||||||||
library(MASS) | |||||||||||||||||||||||||||||||||||||||