Free Statistics
of Irreproducible Research!
Description of Statistical Computation | |||||||||||||||||||||||||||||||||||||||
|---|---|---|---|---|---|---|---|---|---|---|---|---|---|---|---|---|---|---|---|---|---|---|---|---|---|---|---|---|---|---|---|---|---|---|---|---|---|---|---|
| Author's title | |||||||||||||||||||||||||||||||||||||||
| Author | *Unverified author* | ||||||||||||||||||||||||||||||||||||||
| R Software Module | rwasp_fitdistrnorm.wasp | ||||||||||||||||||||||||||||||||||||||
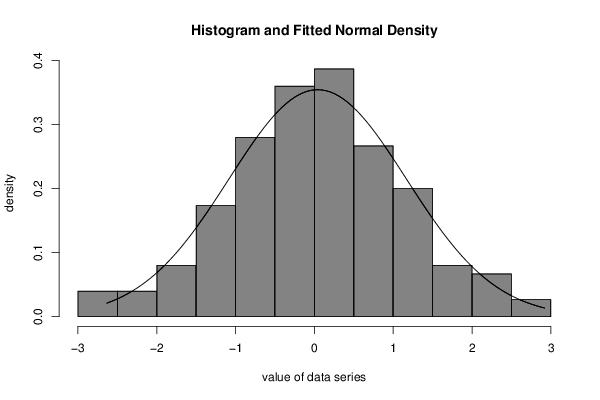
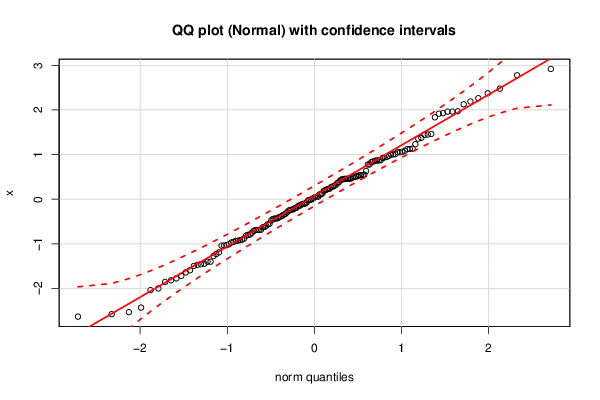
| Title produced by software | ML Fitting and QQ Plot- Normal Distribution | ||||||||||||||||||||||||||||||||||||||
| Date of computation | Sat, 07 Nov 2015 16:09:05 +0000 | ||||||||||||||||||||||||||||||||||||||
| Cite this page as follows | Statistical Computations at FreeStatistics.org, Office for Research Development and Education, URL https://freestatistics.org/blog/index.php?v=date/2015/Nov/07/t14469126208t1fe36zegb1t8v.htm/, Retrieved Tue, 14 May 2024 19:20:13 +0000 | ||||||||||||||||||||||||||||||||||||||
| Statistical Computations at FreeStatistics.org, Office for Research Development and Education, URL https://freestatistics.org/blog/index.php?pk=283235, Retrieved Tue, 14 May 2024 19:20:13 +0000 | |||||||||||||||||||||||||||||||||||||||
| QR Codes: | |||||||||||||||||||||||||||||||||||||||
|
| |||||||||||||||||||||||||||||||||||||||
| Original text written by user: | |||||||||||||||||||||||||||||||||||||||
| IsPrivate? | No (this computation is public) | ||||||||||||||||||||||||||||||||||||||
| User-defined keywords | |||||||||||||||||||||||||||||||||||||||
| Estimated Impact | 146 | ||||||||||||||||||||||||||||||||||||||
Tree of Dependent Computations | |||||||||||||||||||||||||||||||||||||||
| Family? (F = Feedback message, R = changed R code, M = changed R Module, P = changed Parameters, D = changed Data) | |||||||||||||||||||||||||||||||||||||||
| - [ML Fitting and QQ Plot- Normal Distribution] [Chapter 3 - Task 3] [2015-11-07 16:09:05] [d41d8cd98f00b204e9800998ecf8427e] [Current] - R D [ML Fitting and QQ Plot- Normal Distribution] [Chapter 3 - Task ...] [2015-11-07 16:44:50] [e7b69f276c668efa4454b31fcaf26444] | |||||||||||||||||||||||||||||||||||||||
| Feedback Forum | |||||||||||||||||||||||||||||||||||||||
Post a new message | |||||||||||||||||||||||||||||||||||||||
Dataset | |||||||||||||||||||||||||||||||||||||||
| Dataseries X: | |||||||||||||||||||||||||||||||||||||||
0.2199069538 -0.4357886071 2.374614187 1.011120303 -0.970742772 2.919724518 0.8720417458 -0.6232293203 0.4613537883 0.4600836703 -0.5508164756 -0.1665505329 1.051373877 1.971136589 0.2803212394 0.02768159779 0.4557517002 -0.6314369857 0.5091990304 2.777388972 -0.4021917857 1.355223708 -1.456909162 2.127677063 -0.3897440895 1.375383905 -1.856257352 -0.2965043485 -0.4254212827 0.865811949 -0.6848098822 0.3591751432 1.05728693 -0.1962467439 -1.011549334 1.124837625 1.443047181 -1.44822171 -1.496908737 1.449683208 -0.9353128687 0.999506838 -0.1143296528 -0.2578489608 0.1300755225 1.002206278 0.925055525 -0.7930448256 0.4458768934 -0.8837345979 0.04461585686 -0.02100387897 0.9381816161 0.6315428913 0.9712893544 -0.4458533189 -0.0299892006 -0.09940892661 0.2015250133 0.5169133826 0.45569589 1.964754451 2.264100528 -0.4350278145 -0.2278660268 2.477143431 0.779814768 0.830579953 -2.533082749 -0.07751712897 0.318054594 0.4988606154 -0.2366617798 1.13383581 0.05023807449 -1.277034063 0.8622694577 0.1062020255 -0.7998689841 1.836111989 -0.9590814881 0.1069917111 -0.708959975 -0.1395097316 0.5484575656 -0.9166260404 2.189879497 -0.6869464425 0.2985288882 -2.633499284 0.9481140187 -0.6918225148 -1.641376012 -0.3273949059 -0.5604240082 -1.042803902 0.2363390015 -0.5990248085 -0.2048421161 -0.9351864166 1.962504525 0.2288025657 -0.3656204948 1.122389968 -1.028809757 0.00290604392 -0.9061695968 -1.401897535 0.7765850647 1.9283303 -0.3475124318 -0.4760184569 0.4467520029 0.05381942309 -0.2460926085 0.3798220738 0.8742576988 1.054165517 -1.774706797 0.27396944 0.8436778424 -0.6905674205 0.4934378636 0.4209807255 -0.1040233479 -1.718945214 -1.402459263 1.916160819 -0.01023806788 -0.8151895794 -2.001099456 -1.193026564 -1.040585079 -2.039329721 0.1874822369 0.4613274563 -1.229904851 0.539521606 1.085359945 1.232737865 -2.430379579 -1.593233756 -0.752966233 -2.577637923 0.5372215012 1.462794761 -0.1433774213 0.5379109273 -1.470827907 -1.819665083 | |||||||||||||||||||||||||||||||||||||||
Tables (Output of Computation) | |||||||||||||||||||||||||||||||||||||||
| |||||||||||||||||||||||||||||||||||||||
Figures (Output of Computation) | |||||||||||||||||||||||||||||||||||||||
Input Parameters & R Code | |||||||||||||||||||||||||||||||||||||||
| Parameters (Session): | |||||||||||||||||||||||||||||||||||||||
| par1 = 8 ; par2 = 0 ; | |||||||||||||||||||||||||||||||||||||||
| Parameters (R input): | |||||||||||||||||||||||||||||||||||||||
| par1 = 8 ; par2 = 0 ; | |||||||||||||||||||||||||||||||||||||||
| R code (references can be found in the software module): | |||||||||||||||||||||||||||||||||||||||
library(MASS) | |||||||||||||||||||||||||||||||||||||||