Free Statistics
of Irreproducible Research!
Description of Statistical Computation | |||||||||||||||||||||||||||||||||||||||||||||||||||||||||||||||||||||||||||||||||||||||||||||||||||||||||||||||||||||||||||||||||||||||||||||||||||||||||||||||||||||||||||||||||
|---|---|---|---|---|---|---|---|---|---|---|---|---|---|---|---|---|---|---|---|---|---|---|---|---|---|---|---|---|---|---|---|---|---|---|---|---|---|---|---|---|---|---|---|---|---|---|---|---|---|---|---|---|---|---|---|---|---|---|---|---|---|---|---|---|---|---|---|---|---|---|---|---|---|---|---|---|---|---|---|---|---|---|---|---|---|---|---|---|---|---|---|---|---|---|---|---|---|---|---|---|---|---|---|---|---|---|---|---|---|---|---|---|---|---|---|---|---|---|---|---|---|---|---|---|---|---|---|---|---|---|---|---|---|---|---|---|---|---|---|---|---|---|---|---|---|---|---|---|---|---|---|---|---|---|---|---|---|---|---|---|---|---|---|---|---|---|---|---|---|---|---|---|---|---|---|---|---|
| Author's title | |||||||||||||||||||||||||||||||||||||||||||||||||||||||||||||||||||||||||||||||||||||||||||||||||||||||||||||||||||||||||||||||||||||||||||||||||||||||||||||||||||||||||||||||||
| Author | *The author of this computation has been verified* | ||||||||||||||||||||||||||||||||||||||||||||||||||||||||||||||||||||||||||||||||||||||||||||||||||||||||||||||||||||||||||||||||||||||||||||||||||||||||||||||||||||||||||||||||
| R Software Module | rwasp_twosampletests_mean.wasp | ||||||||||||||||||||||||||||||||||||||||||||||||||||||||||||||||||||||||||||||||||||||||||||||||||||||||||||||||||||||||||||||||||||||||||||||||||||||||||||||||||||||||||||||||
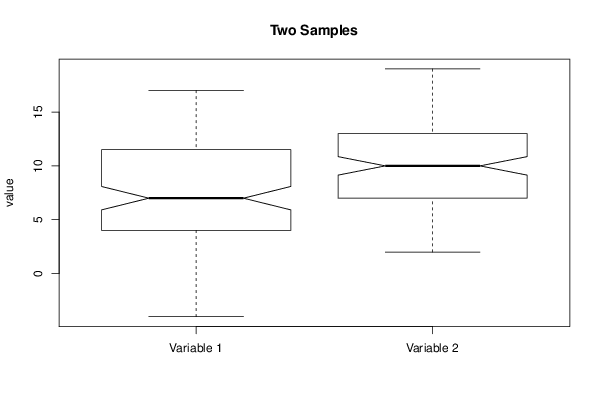
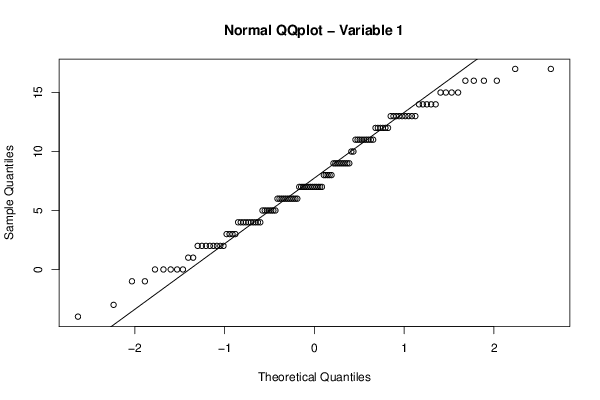
| Title produced by software | Paired and Unpaired Two Samples Tests about the Mean | ||||||||||||||||||||||||||||||||||||||||||||||||||||||||||||||||||||||||||||||||||||||||||||||||||||||||||||||||||||||||||||||||||||||||||||||||||||||||||||||||||||||||||||||||
| Date of computation | Wed, 04 Nov 2015 19:45:25 +0000 | ||||||||||||||||||||||||||||||||||||||||||||||||||||||||||||||||||||||||||||||||||||||||||||||||||||||||||||||||||||||||||||||||||||||||||||||||||||||||||||||||||||||||||||||||
| Cite this page as follows | Statistical Computations at FreeStatistics.org, Office for Research Development and Education, URL https://freestatistics.org/blog/index.php?v=date/2015/Nov/04/t1446666681t3wu48cip77eol4.htm/, Retrieved Tue, 14 May 2024 07:38:43 +0000 | ||||||||||||||||||||||||||||||||||||||||||||||||||||||||||||||||||||||||||||||||||||||||||||||||||||||||||||||||||||||||||||||||||||||||||||||||||||||||||||||||||||||||||||||||
| Statistical Computations at FreeStatistics.org, Office for Research Development and Education, URL https://freestatistics.org/blog/index.php?pk=283160, Retrieved Tue, 14 May 2024 07:38:43 +0000 | |||||||||||||||||||||||||||||||||||||||||||||||||||||||||||||||||||||||||||||||||||||||||||||||||||||||||||||||||||||||||||||||||||||||||||||||||||||||||||||||||||||||||||||||||
| QR Codes: | |||||||||||||||||||||||||||||||||||||||||||||||||||||||||||||||||||||||||||||||||||||||||||||||||||||||||||||||||||||||||||||||||||||||||||||||||||||||||||||||||||||||||||||||||
|
| |||||||||||||||||||||||||||||||||||||||||||||||||||||||||||||||||||||||||||||||||||||||||||||||||||||||||||||||||||||||||||||||||||||||||||||||||||||||||||||||||||||||||||||||||
| Original text written by user: | |||||||||||||||||||||||||||||||||||||||||||||||||||||||||||||||||||||||||||||||||||||||||||||||||||||||||||||||||||||||||||||||||||||||||||||||||||||||||||||||||||||||||||||||||
| IsPrivate? | No (this computation is public) | ||||||||||||||||||||||||||||||||||||||||||||||||||||||||||||||||||||||||||||||||||||||||||||||||||||||||||||||||||||||||||||||||||||||||||||||||||||||||||||||||||||||||||||||||
| User-defined keywords | |||||||||||||||||||||||||||||||||||||||||||||||||||||||||||||||||||||||||||||||||||||||||||||||||||||||||||||||||||||||||||||||||||||||||||||||||||||||||||||||||||||||||||||||||
| Estimated Impact | 550 | ||||||||||||||||||||||||||||||||||||||||||||||||||||||||||||||||||||||||||||||||||||||||||||||||||||||||||||||||||||||||||||||||||||||||||||||||||||||||||||||||||||||||||||||||
Tree of Dependent Computations | |||||||||||||||||||||||||||||||||||||||||||||||||||||||||||||||||||||||||||||||||||||||||||||||||||||||||||||||||||||||||||||||||||||||||||||||||||||||||||||||||||||||||||||||||
| Family? (F = Feedback message, R = changed R code, M = changed R Module, P = changed Parameters, D = changed Data) | |||||||||||||||||||||||||||||||||||||||||||||||||||||||||||||||||||||||||||||||||||||||||||||||||||||||||||||||||||||||||||||||||||||||||||||||||||||||||||||||||||||||||||||||||
| - [Paired and Unpaired Two Samples Tests about the Mean] [] [2015-11-04 19:45:25] [63a9f0ea7bb98050796b649e85481845] [Current] - R PD [Paired and Unpaired Two Samples Tests about the Mean] [Wilcoxon test] [2015-12-07 19:06:07] [22b6f4a061c8797aa483199554a73d13] - [Paired and Unpaired Two Samples Tests about the Mean] [Wilcoxon test] [2015-12-07 19:26:40] [22b6f4a061c8797aa483199554a73d13] - P [Paired and Unpaired Two Samples Tests about the Mean] [wilcoxon test ] [2015-12-14 13:13:43] [22b6f4a061c8797aa483199554a73d13] - [Paired and Unpaired Two Samples Tests about the Mean] [] [2015-12-17 19:46:27] [22b6f4a061c8797aa483199554a73d13] - R PD [Paired and Unpaired Two Samples Tests about the Mean] [] [2015-12-16 10:27:29] [23dea497e8c7f4d7527c256c4e83e065] - R PD [Paired and Unpaired Two Samples Tests about the Mean] [] [2015-12-16 10:32:22] [23dea497e8c7f4d7527c256c4e83e065] - RMPD [Multiple Regression] [] [2016-01-10 15:02:48] [36781f05c04c55e165b348994b753b95] - RMPD [Notched Boxplots] [] [2016-01-10 15:35:33] [36781f05c04c55e165b348994b753b95] - RMPD [Notched Boxplots] [] [2016-01-10 15:38:50] [36781f05c04c55e165b348994b753b95] - RMPD [Notched Boxplots] [] [2016-01-10 15:40:38] [36781f05c04c55e165b348994b753b95] | |||||||||||||||||||||||||||||||||||||||||||||||||||||||||||||||||||||||||||||||||||||||||||||||||||||||||||||||||||||||||||||||||||||||||||||||||||||||||||||||||||||||||||||||||
| Feedback Forum | |||||||||||||||||||||||||||||||||||||||||||||||||||||||||||||||||||||||||||||||||||||||||||||||||||||||||||||||||||||||||||||||||||||||||||||||||||||||||||||||||||||||||||||||||
Post a new message | |||||||||||||||||||||||||||||||||||||||||||||||||||||||||||||||||||||||||||||||||||||||||||||||||||||||||||||||||||||||||||||||||||||||||||||||||||||||||||||||||||||||||||||||||
Dataset | |||||||||||||||||||||||||||||||||||||||||||||||||||||||||||||||||||||||||||||||||||||||||||||||||||||||||||||||||||||||||||||||||||||||||||||||||||||||||||||||||||||||||||||||||
| Dataseries X: | |||||||||||||||||||||||||||||||||||||||||||||||||||||||||||||||||||||||||||||||||||||||||||||||||||||||||||||||||||||||||||||||||||||||||||||||||||||||||||||||||||||||||||||||||
NA 9 NA 17 4 NA NA 11 NA 12 NA 15 5 NA NA 11 NA 10 NA 6 16 NA NA 10 12 NA 9 NA NA 13 NA 12 5 NA 5 NA NA 15 NA 6 2 NA NA 6 NA 17 7 NA NA 13 NA 14 NA 9 13 NA NA 12 NA 2 11 NA NA 7 NA 5 0 NA NA 11 5 NA NA 6 NA 4 14 NA NA 10 1 NA NA 6 11 NA NA 17 12 NA NA 4 NA 4 NA 6 6 NA NA 10 NA 13 NA 15 NA 3 NA 9 NA 19 NA 7 NA 4 NA 5 NA 9 7 NA NA 12 NA 5 NA 12 8 NA NA 12 NA 11 NA 9 NA 9 11 NA NA 9 9 NA 5 NA NA 7 NA 7 -3 NA NA 4 7 NA NA 13 13 NA NA 10 NA 5 2 NA NA 13 NA 6 NA 14 NA 13 NA 11 NA 6 NA 12 NA 9 NA 17 NA 7 NA 13 NA 12 NA 6 NA 11 NA 9 7 NA NA 11 NA 15 NA 6 NA 12 NA 3 10 NA NA 9 NA 10 8 NA 8 NA 2 NA NA 12 NA 12 NA 10 NA 12 NA 12 6 NA 3 NA NA 4 NA 12 3 NA 9 NA NA 13 -1 NA NA 14 NA 6 12 NA NA 9 NA 10 NA 6 NA 17 4 NA 7 NA NA 12 7 NA 2 NA 13 NA 14 NA 11 NA 14 NA NA 14 8 NA 12 NA 2 NA 15 NA 14 NA NA 13 NA 15 4 NA NA 9 NA 12 NA 18 NA 11 4 NA NA 4 8 NA 7 NA NA 12 NA 9 6 NA NA 11 NA 16 7 NA NA 6 9 NA 17 NA NA 15 NA 9 16 NA NA 5 7 NA NA 13 12 NA 9 NA NA 10 9 NA 0 NA 3 NA NA 15 5 NA 4 NA 14 NA NA 9 15 NA 13 NA 9 NA 11 NA NA 13 5 NA 1 NA 17 NA NA 9 6 NA 9 NA 7 NA NA 9 6 NA 11 NA 0 NA NA 15 16 NA 7 NA NA 7 15 NA 10 NA 7 NA 13 NA 3 NA 0 NA 11 NA NA 11 6 NA -4 NA NA 10 4 NA 16 NA 13 NA NA 7 0 NA NA 13 6 NA 4 NA 4 NA 2 NA 13 NA NA 15 15 NA 6 NA 4 NA 13 NA 13 NA 6 NA 11 NA 9 NA 12 NA 2 NA 6 NA 6 NA -1 NA 4 NA 11 NA 2 NA 7 NA | |||||||||||||||||||||||||||||||||||||||||||||||||||||||||||||||||||||||||||||||||||||||||||||||||||||||||||||||||||||||||||||||||||||||||||||||||||||||||||||||||||||||||||||||||
Tables (Output of Computation) | |||||||||||||||||||||||||||||||||||||||||||||||||||||||||||||||||||||||||||||||||||||||||||||||||||||||||||||||||||||||||||||||||||||||||||||||||||||||||||||||||||||||||||||||||
| |||||||||||||||||||||||||||||||||||||||||||||||||||||||||||||||||||||||||||||||||||||||||||||||||||||||||||||||||||||||||||||||||||||||||||||||||||||||||||||||||||||||||||||||||
Figures (Output of Computation) | |||||||||||||||||||||||||||||||||||||||||||||||||||||||||||||||||||||||||||||||||||||||||||||||||||||||||||||||||||||||||||||||||||||||||||||||||||||||||||||||||||||||||||||||||
Input Parameters & R Code | |||||||||||||||||||||||||||||||||||||||||||||||||||||||||||||||||||||||||||||||||||||||||||||||||||||||||||||||||||||||||||||||||||||||||||||||||||||||||||||||||||||||||||||||||
| Parameters (Session): | |||||||||||||||||||||||||||||||||||||||||||||||||||||||||||||||||||||||||||||||||||||||||||||||||||||||||||||||||||||||||||||||||||||||||||||||||||||||||||||||||||||||||||||||||
| par1 = 1 ; par2 = 2 ; par3 = 0.99 ; par4 = two.sided ; par5 = unpaired ; par6 = 0 ; | |||||||||||||||||||||||||||||||||||||||||||||||||||||||||||||||||||||||||||||||||||||||||||||||||||||||||||||||||||||||||||||||||||||||||||||||||||||||||||||||||||||||||||||||||
| Parameters (R input): | |||||||||||||||||||||||||||||||||||||||||||||||||||||||||||||||||||||||||||||||||||||||||||||||||||||||||||||||||||||||||||||||||||||||||||||||||||||||||||||||||||||||||||||||||
| par1 = 1 ; par2 = 2 ; par3 = 0.99 ; par4 = two.sided ; par5 = unpaired ; par6 = 0 ; | |||||||||||||||||||||||||||||||||||||||||||||||||||||||||||||||||||||||||||||||||||||||||||||||||||||||||||||||||||||||||||||||||||||||||||||||||||||||||||||||||||||||||||||||||
| R code (references can be found in the software module): | |||||||||||||||||||||||||||||||||||||||||||||||||||||||||||||||||||||||||||||||||||||||||||||||||||||||||||||||||||||||||||||||||||||||||||||||||||||||||||||||||||||||||||||||||
par6 <- '100' | |||||||||||||||||||||||||||||||||||||||||||||||||||||||||||||||||||||||||||||||||||||||||||||||||||||||||||||||||||||||||||||||||||||||||||||||||||||||||||||||||||||||||||||||||