Free Statistics
of Irreproducible Research!
Description of Statistical Computation | |||||||||||||||||||||||||||||||||||||||
|---|---|---|---|---|---|---|---|---|---|---|---|---|---|---|---|---|---|---|---|---|---|---|---|---|---|---|---|---|---|---|---|---|---|---|---|---|---|---|---|
| Author's title | |||||||||||||||||||||||||||||||||||||||
| Author | *The author of this computation has been verified* | ||||||||||||||||||||||||||||||||||||||
| R Software Module | rwasp_fitdistrnorm.wasp | ||||||||||||||||||||||||||||||||||||||
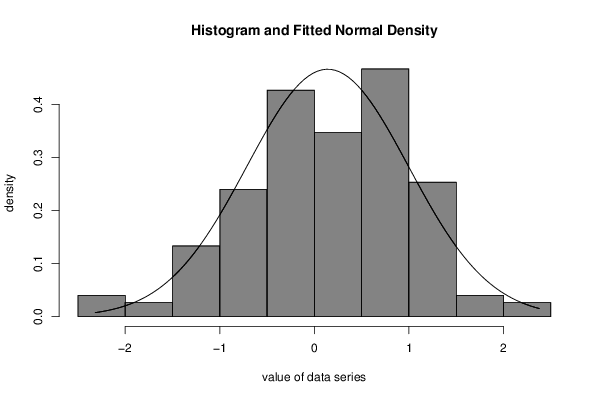
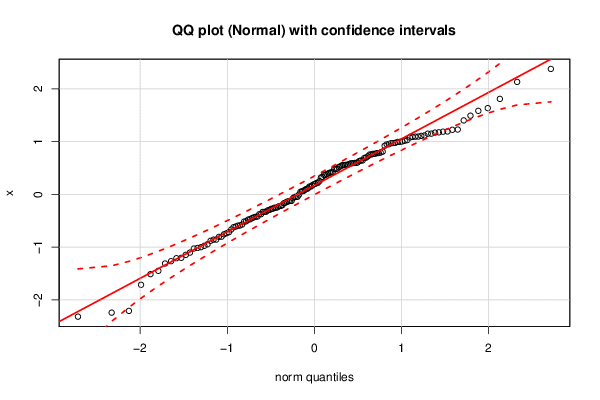
| Title produced by software | ML Fitting and QQ Plot- Normal Distribution | ||||||||||||||||||||||||||||||||||||||
| Date of computation | Wed, 04 Nov 2015 12:37:31 +0000 | ||||||||||||||||||||||||||||||||||||||
| Cite this page as follows | Statistical Computations at FreeStatistics.org, Office for Research Development and Education, URL https://freestatistics.org/blog/index.php?v=date/2015/Nov/04/t1446640785pi4n3xjnwmgtdz6.htm/, Retrieved Tue, 14 May 2024 23:41:50 +0000 | ||||||||||||||||||||||||||||||||||||||
| Statistical Computations at FreeStatistics.org, Office for Research Development and Education, URL https://freestatistics.org/blog/index.php?pk=283143, Retrieved Tue, 14 May 2024 23:41:50 +0000 | |||||||||||||||||||||||||||||||||||||||
| QR Codes: | |||||||||||||||||||||||||||||||||||||||
|
| |||||||||||||||||||||||||||||||||||||||
| Original text written by user: | |||||||||||||||||||||||||||||||||||||||
| IsPrivate? | No (this computation is public) | ||||||||||||||||||||||||||||||||||||||
| User-defined keywords | |||||||||||||||||||||||||||||||||||||||
| Estimated Impact | 158 | ||||||||||||||||||||||||||||||||||||||
Tree of Dependent Computations | |||||||||||||||||||||||||||||||||||||||
| Family? (F = Feedback message, R = changed R code, M = changed R Module, P = changed Parameters, D = changed Data) | |||||||||||||||||||||||||||||||||||||||
| - [ML Fitting and QQ Plot- Normal Distribution] [3.1. task 3] [2015-11-04 12:37:31] [7b81fac622814275349f5d25cf6bd6bd] [Current] | |||||||||||||||||||||||||||||||||||||||
| Feedback Forum | |||||||||||||||||||||||||||||||||||||||
Post a new message | |||||||||||||||||||||||||||||||||||||||
Dataset | |||||||||||||||||||||||||||||||||||||||
| Dataseries X: | |||||||||||||||||||||||||||||||||||||||
-0.5887739973 -0.1388334259 -0.3317862227 0.1715829625 -0.2721114708 -0.0471965377 0.4158706013 0.696303247 0.5162038247 0.10122761 0.9773072225 1.095651467 0.4868233446 0.5782972654 -0.1315122524 -0.1661624254 0.7541452363 -0.4250936913 -1.015962589 0.5639438217 1.188486973 0.7680012528 1.004103064 -1.00037121 -0.6223665179 -0.003027265139 0.4105882688 -1.103793226 -0.8022402646 0.04942211232 0.112763966 -0.8588983641 0.9937288287 0.5563029822 -2.317746406 -0.04632414907 0.3687646122 0.9964378787 0.1973933527 -0.8055650594 1.583499757 1.810410014 -0.3030319789 0.7836063465 -0.4356016061 -0.3761705335 -0.7566793331 1.22909336 -0.4784458775 -0.420024782 0.5948386116 -0.7361953085 1.175862779 0.7818115776 -1.512186729 0.5923581303 0.5955703824 -0.156620335 -0.4723241802 -0.2528401567 0.642195872 -1.449435765 -1.310392537 -0.9461415059 -0.9741708598 0.6312350822 -0.5714752144 -0.2938257289 0.9698034408 1.634763807 0.3984401227 0.9501031094 -0.5152561059 0.9209154541 -0.2188031346 2.377495478 0.2519898799 -2.241885366 1.224579739 0.3290109695 1.116392839 0.5310879217 -0.6101996559 -0.5935530152 0.1884896482 0.05787969261 1.108357432 1.094443065 0.5560497473 1.016244309 0.1482722199 1.491559767 0.6049984981 0.479412267 0.589698726 1.150733141 0.9497151291 0.5612322912 0.8099091243 1.029103443 0.9727050032 1.17068736 1.077654361 0.5472194613 -1.026352037 -0.1242133494 -0.2431011461 0.7576175191 -0.07217886731 -0.123167785 -0.8800683916 -0.3772243596 -1.146103395 1.089060432 0.7698511113 1.402442742 -2.208885685 -0.6653414969 -0.3275741647 1.150342306 0.3858299344 0.6441562435 -1.202670501 0.3202520598 0.08743783224 -0.33280726 0.3687513926 0.4814576906 -0.04633116815 1.192657619 -0.2746180224 -0.856417742 0.06526296068 -0.2217918833 -1.210227043 0.6907897696 -0.4499825408 -0.5108398153 0.1470728289 0.4253649193 0.2162094979 -0.2532445336 -1.266863092 0.7206666908 -0.2046057712 -1.714197199 2.132013234 -0.7165422646 0.7945774106 0.2216946189 | |||||||||||||||||||||||||||||||||||||||
Tables (Output of Computation) | |||||||||||||||||||||||||||||||||||||||
| |||||||||||||||||||||||||||||||||||||||
Figures (Output of Computation) | |||||||||||||||||||||||||||||||||||||||
Input Parameters & R Code | |||||||||||||||||||||||||||||||||||||||
| Parameters (Session): | |||||||||||||||||||||||||||||||||||||||
| par1 = 8 ; par2 = 0 ; | |||||||||||||||||||||||||||||||||||||||
| Parameters (R input): | |||||||||||||||||||||||||||||||||||||||
| par1 = 8 ; par2 = 0 ; | |||||||||||||||||||||||||||||||||||||||
| R code (references can be found in the software module): | |||||||||||||||||||||||||||||||||||||||
library(MASS) | |||||||||||||||||||||||||||||||||||||||