Free Statistics
of Irreproducible Research!
Description of Statistical Computation | |||||||||||||||||||||||||||||||||
|---|---|---|---|---|---|---|---|---|---|---|---|---|---|---|---|---|---|---|---|---|---|---|---|---|---|---|---|---|---|---|---|---|---|
| Author's title | |||||||||||||||||||||||||||||||||
| Author | *The author of this computation has been verified* | ||||||||||||||||||||||||||||||||
| R Software Module | rwasp_fitdistrchisq1.wasp | ||||||||||||||||||||||||||||||||
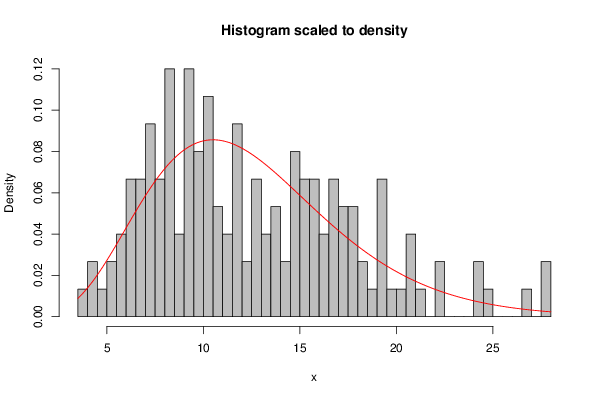
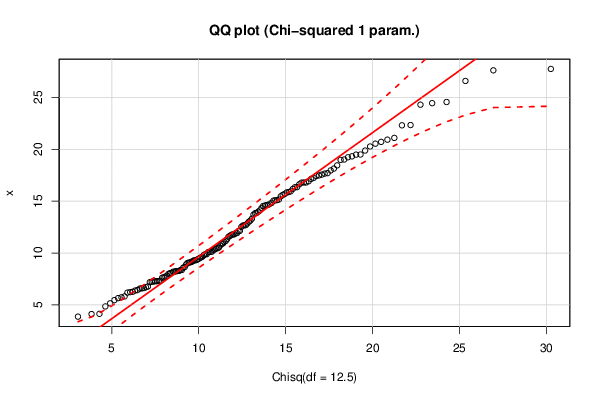
| Title produced by software | Maximum-likelihood Fitting - Chi-squared Distribution | ||||||||||||||||||||||||||||||||
| Date of computation | Wed, 04 Nov 2015 12:31:00 +0000 | ||||||||||||||||||||||||||||||||
| Cite this page as follows | Statistical Computations at FreeStatistics.org, Office for Research Development and Education, URL https://freestatistics.org/blog/index.php?v=date/2015/Nov/04/t14466403584l4wsygevwtf7fm.htm/, Retrieved Tue, 14 May 2024 12:23:16 +0000 | ||||||||||||||||||||||||||||||||
| Statistical Computations at FreeStatistics.org, Office for Research Development and Education, URL https://freestatistics.org/blog/index.php?pk=283141, Retrieved Tue, 14 May 2024 12:23:16 +0000 | |||||||||||||||||||||||||||||||||
| QR Codes: | |||||||||||||||||||||||||||||||||
|
| |||||||||||||||||||||||||||||||||
| Original text written by user: | |||||||||||||||||||||||||||||||||
| IsPrivate? | No (this computation is public) | ||||||||||||||||||||||||||||||||
| User-defined keywords | |||||||||||||||||||||||||||||||||
| Estimated Impact | 170 | ||||||||||||||||||||||||||||||||
Tree of Dependent Computations | |||||||||||||||||||||||||||||||||
| Family? (F = Feedback message, R = changed R code, M = changed R Module, P = changed Parameters, D = changed Data) | |||||||||||||||||||||||||||||||||
| - [Maximum-likelihood Fitting - Chi-squared Distribution] [Task 5 serie N] [2015-11-04 12:31:00] [83aba8bbc702c7812e095afce40a5d1d] [Current] | |||||||||||||||||||||||||||||||||
| Feedback Forum | |||||||||||||||||||||||||||||||||
Post a new message | |||||||||||||||||||||||||||||||||
Dataset | |||||||||||||||||||||||||||||||||
| Dataseries X: | |||||||||||||||||||||||||||||||||
24.29589652 6.440383694 17.42822487 27.74030405 7.730938932 15.16457356 20.54187726 10.08000827 7.303134736 7.25630401 9.301992132 13.02813232 20.71431594 14.54173023 8.268033476 19.23132503 16.80180948 11.80489713 6.391082741 10.89406602 15.61148038 26.58282109 12.14570954 17.56207584 6.18924344 10.15073005 11.17469275 9.671015211 17.48910119 13.32175429 9.444436046 11.7954732 27.6067512 18.14395421 13.84472199 4.149122233 11.64692671 12.68298041 18.45174161 7.288719009 15.0524868 8.649457175 10.12609024 13.13193628 20.27025489 5.468349652 14.10946124 22.31023589 17.96473545 10.44089546 11.93093198 11.34689232 17.65392068 15.46685037 14.56770826 10.93118344 14.64964278 20.92650423 9.888354149 19.87927633 5.825300072 10.72900405 7.809725269 19.48619739 8.602517371 16.80581741 17.14509312 13.69938186 16.92082724 10.36508981 8.067516434 19.49601409 8.090630452 6.605579176 9.152682684 6.578838442 9.093106255 4.861225354 6.717828101 15.10505342 10.10493462 15.08500859 12.65060979 9.042198695 7.624909816 19.31959197 11.08176614 7.997181131 19.01570317 5.658990118 10.28037952 24.44228553 14.75144256 5.163645977 16.34489138 16.62606777 8.207168845 13.99139264 8.25818275 17.24957935 6.238088638 21.09643099 5.741324927 9.819324917 7.243963736 12.69648038 6.273330556 8.906170028 15.69043522 12.85561679 11.57858377 22.33688504 11.76186616 9.10753219 9.890422984 16.35438129 6.629717766 8.204879141 16.17789182 12.53205238 10.53764247 15.83780554 13.87009358 3.87630863 11.91794647 8.358242019 15.95082872 24.55512348 9.25332674 7.288619229 17.70499971 4.124707824 14.3381255 8.280558078 6.785601032 8.373249287 14.62668942 12.11448202 7.201520502 7.660528264 9.37239594 10.46954196 9.316000922 16.78378325 9.527031181 9.601483827 7.329725048 18.9776615 14.83744533 15.8779908 | |||||||||||||||||||||||||||||||||
Tables (Output of Computation) | |||||||||||||||||||||||||||||||||
| |||||||||||||||||||||||||||||||||
Figures (Output of Computation) | |||||||||||||||||||||||||||||||||
Input Parameters & R Code | |||||||||||||||||||||||||||||||||
| Parameters (Session): | |||||||||||||||||||||||||||||||||
| Parameters (R input): | |||||||||||||||||||||||||||||||||
| R code (references can be found in the software module): | |||||||||||||||||||||||||||||||||
library(MASS) | |||||||||||||||||||||||||||||||||