Free Statistics
of Irreproducible Research!
Description of Statistical Computation | |||||||||||||||||||||||||||||||||||||||
|---|---|---|---|---|---|---|---|---|---|---|---|---|---|---|---|---|---|---|---|---|---|---|---|---|---|---|---|---|---|---|---|---|---|---|---|---|---|---|---|
| Author's title | |||||||||||||||||||||||||||||||||||||||
| Author | *The author of this computation has been verified* | ||||||||||||||||||||||||||||||||||||||
| R Software Module | rwasp_fitdistrnorm.wasp | ||||||||||||||||||||||||||||||||||||||
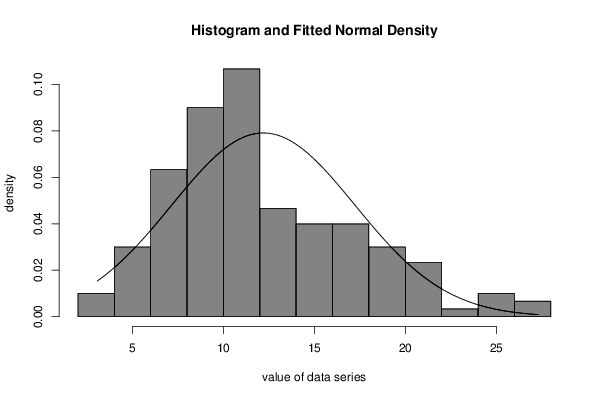
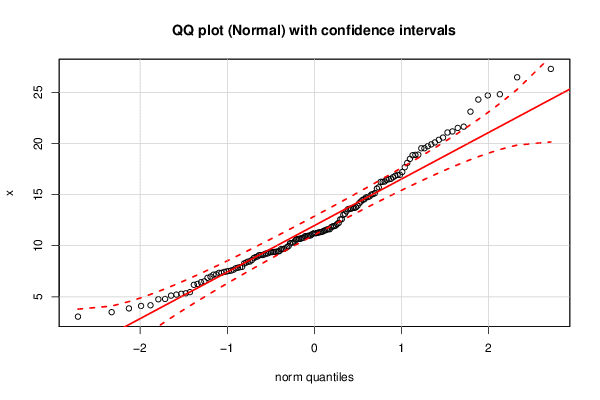
| Title produced by software | ML Fitting and QQ Plot- Normal Distribution | ||||||||||||||||||||||||||||||||||||||
| Date of computation | Mon, 02 Nov 2015 20:32:21 +0000 | ||||||||||||||||||||||||||||||||||||||
| Cite this page as follows | Statistical Computations at FreeStatistics.org, Office for Research Development and Education, URL https://freestatistics.org/blog/index.php?v=date/2015/Nov/02/t14464963689isxkuj2x14mdcw.htm/, Retrieved Tue, 14 May 2024 19:37:43 +0000 | ||||||||||||||||||||||||||||||||||||||
| Statistical Computations at FreeStatistics.org, Office for Research Development and Education, URL https://freestatistics.org/blog/index.php?pk=283123, Retrieved Tue, 14 May 2024 19:37:43 +0000 | |||||||||||||||||||||||||||||||||||||||
| QR Codes: | |||||||||||||||||||||||||||||||||||||||
|
| |||||||||||||||||||||||||||||||||||||||
| Original text written by user: | |||||||||||||||||||||||||||||||||||||||
| IsPrivate? | No (this computation is public) | ||||||||||||||||||||||||||||||||||||||
| User-defined keywords | |||||||||||||||||||||||||||||||||||||||
| Estimated Impact | 179 | ||||||||||||||||||||||||||||||||||||||
Tree of Dependent Computations | |||||||||||||||||||||||||||||||||||||||
| Family? (F = Feedback message, R = changed R code, M = changed R Module, P = changed Parameters, D = changed Data) | |||||||||||||||||||||||||||||||||||||||
| - [ML Fitting and QQ Plot- Normal Distribution] [Problems Chapter ...] [2015-11-02 20:32:21] [056331f8739198d7705ae45a22f1e54e] [Current] | |||||||||||||||||||||||||||||||||||||||
| Feedback Forum | |||||||||||||||||||||||||||||||||||||||
Post a new message | |||||||||||||||||||||||||||||||||||||||
Dataset | |||||||||||||||||||||||||||||||||||||||
| Dataseries X: | |||||||||||||||||||||||||||||||||||||||
6.261737 10.78267929 16.70159935 9.864480912 7.524921756 11.37387858 6.973420332 18.85778519 10.67686898 14.32822684 11.81769764 19.54047629 4.759378804 9.654626251 11.27029161 8.459496565 15.5937205 10.75756165 11.89370994 10.94339907 13.57838108 9.090610616 16.4528718 14.16625143 11.46015867 11.61453377 10.60205976 16.54755094 3.058629948 8.259064725 9.158647283 16.25861477 10.99267522 10.2380464 10.96158793 21.65183561 7.849716309 15.00484927 17.68110854 7.899307393 11.21753812 12.57570098 4.103695619 16.8470644 7.433673687 9.401719922 7.926290559 11.98231791 4.172619107 6.424386837 10.64911439 12.59635335 7.795429578 15.15685534 3.865430993 17.21560482 11.02090314 6.512756946 16.28758649 11.51501709 5.215052278 6.172810323 13.69505247 16.25077873 16.51089382 9.381005271 13.62368108 13.61029826 11.2401545 24.30527757 13.0264517 8.886326619 7.161339989 9.963480922 19.53691969 12.23791157 18.49363428 21.18447046 24.82367082 26.48331832 13.70277883 7.650979783 9.366655223 11.32234232 10.40615173 16.92622109 23.11774313 14.83235392 5.119143065 8.601205361 10.67739331 15.71395904 16.944556 8.793822422 11.21274931 7.345886986 9.460703701 9.664260863 18.89056789 11.34309634 20.36637304 21.52534703 9.252944075 13.11964229 9.774001069 9.43719672 7.342877814 8.353925236 6.861966457 11.9237302 14.48618892 13.91625339 21.08225528 18.91333672 19.91909633 27.30017703 8.440973354 15.06000602 9.091119409 18.10252751 9.071387724 13.76139954 14.73435108 14.54773011 10.25569293 14.76188663 5.342610539 7.196330235 10.26846879 13.36639644 3.497219246 11.58069172 5.297790428 5.459628418 20.5870146 8.94674449 9.684583497 11.13008117 10.91667017 9.389078315 7.477932727 12.13548411 9.246364673 4.790115477 20.10963077 7.576214206 9.373426176 24.70808401 19.74272695 11.6169769 | |||||||||||||||||||||||||||||||||||||||
Tables (Output of Computation) | |||||||||||||||||||||||||||||||||||||||
| |||||||||||||||||||||||||||||||||||||||
Figures (Output of Computation) | |||||||||||||||||||||||||||||||||||||||
Input Parameters & R Code | |||||||||||||||||||||||||||||||||||||||
| Parameters (Session): | |||||||||||||||||||||||||||||||||||||||
| par1 = 8 ; par2 = 0 ; | |||||||||||||||||||||||||||||||||||||||
| Parameters (R input): | |||||||||||||||||||||||||||||||||||||||
| par1 = 8 ; par2 = 0 ; | |||||||||||||||||||||||||||||||||||||||
| R code (references can be found in the software module): | |||||||||||||||||||||||||||||||||||||||
library(MASS) | |||||||||||||||||||||||||||||||||||||||