Free Statistics

of Irreproducible Research!

Author's title

Author*Unverified author*
R Software Modulerwasp_smp.wasp
Title produced by softwareStandard Deviation-Mean Plot
Date of computationSun, 16 Aug 2015 17:26:30 +0100
Cite this page as followsStatistical Computations at FreeStatistics.org, Office for Research Development and Education, URL https://freestatistics.org/blog/index.php?v=date/2015/Aug/16/t14397424151sx0u2oj53cm2ep.htm/, Retrieved Sat, 18 May 2024 23:05:40 +0000
Statistical Computations at FreeStatistics.org, Office for Research Development and Education, URL https://freestatistics.org/blog/index.php?pk=280179, Retrieved Sat, 18 May 2024 23:05:40 +0000
QR Codes:

Original text written by user:
IsPrivate?No (this computation is public)
User-defined keywords
Estimated Impact61
Family? (F = Feedback message, R = changed R code, M = changed R Module, P = changed Parameters, D = changed Data)
-       [Standard Deviation-Mean Plot] [] [2015-08-16 16:26:30] [f898ec974b62c60a8bec4044c4c271e3] [Current]
Feedback Forum

Post a new message
Dataseries X:
1544400
1487200
1573000
1258400
1630200
1601600
1716000
1773200
1973400
1716000
1630200
2030600
1716000
1287000
1515800
1144000
1601600
1315600
1744600
1573000
1658800
1859000
1830400
2173600
1573000
1315600
1458600
1058200
1515800
1172600
1658800
1573000
1401400
2002000
1801800
2059200
1544400
1430000
1287000
1058200
1401400
1258400
1716000
1658800
1430000
1916200
1773200
2288000
1830400
1115400
1115400
1115400
1315600
1315600
1773200
1630200
1458600
1830400
1687400
2431000
1916200
1115400
1172600
972400
1344200
1544400
1944800
1916200
1544400
1801800
1601600
2288000
1744600
1401400
1258400
943800
1401400
1687400
1973400
1859000
1372800
1973400
1544400
2373800
1973400
1430000
1315600
886600
1401400
1344200
2030600
2030600
1544400
2002000
1487200
2316600
1973400
1458600
1115400
772200
1515800
1458600
1916200
2202200
1630200
1830400
1372800
2373800


Summary of computational transaction
Raw Inputview raw input (R code)
Raw Outputview raw output of R engine
Computing time1 seconds
R Server'Sir Maurice George Kendall' @ kendall.wessa.net

\begin{tabular}{lllllllll}
\hline
Summary of computational transaction \tabularnewline
Raw Input & view raw input (R code)  \tabularnewline
Raw Output & view raw output of R engine  \tabularnewline
Computing time & 1 seconds \tabularnewline
R Server & 'Sir Maurice George Kendall' @ kendall.wessa.net \tabularnewline
\hline
\end{tabular}
%Source: https://freestatistics.org/blog/index.php?pk=280179&T=0

[TABLE]
[ROW][C]Summary of computational transaction[/C][/ROW]
[ROW][C]Raw Input[/C][C]view raw input (R code) [/C][/ROW]
[ROW][C]Raw Output[/C][C]view raw output of R engine [/C][/ROW]
[ROW][C]Computing time[/C][C]1 seconds[/C][/ROW]
[ROW][C]R Server[/C][C]'Sir Maurice George Kendall' @ kendall.wessa.net[/C][/ROW]
[/TABLE]
Source: https://freestatistics.org/blog/index.php?pk=280179&T=0

Globally Unique Identifier (entire table): ba.freestatistics.org/blog/index.php?pk=280179&T=0

As an alternative you can also use a QR Code:  

The GUIDs for individual cells are displayed in the table below:

Summary of computational transaction
Raw Inputview raw input (R code)
Raw Outputview raw output of R engine
Computing time1 seconds
R Server'Sir Maurice George Kendall' @ kendall.wessa.net


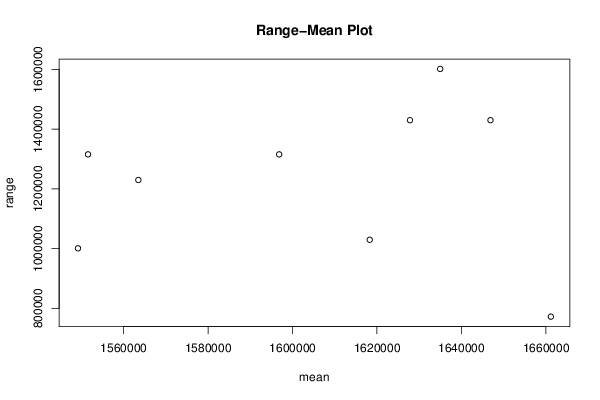
Standard Deviation-Mean Plot
SectionMeanStandard DeviationRange
11661183.33333333207122.001084707772200
21618283.33333333282457.2239000681029600
31549166.66666667303124.0230224811001000
41563466.66666667332040.8007057771229800
51551550392356.7126990441315600
61596833.33333333394946.1904276751315600
71627816.66666667386693.3712042831430000
81646883.33333333415431.5386839731430000
91634966.66666667453163.9144209671601600

\begin{tabular}{lllllllll}
\hline
Standard Deviation-Mean Plot \tabularnewline
Section & Mean & Standard Deviation & Range \tabularnewline
1 & 1661183.33333333 & 207122.001084707 & 772200 \tabularnewline
2 & 1618283.33333333 & 282457.223900068 & 1029600 \tabularnewline
3 & 1549166.66666667 & 303124.023022481 & 1001000 \tabularnewline
4 & 1563466.66666667 & 332040.800705777 & 1229800 \tabularnewline
5 & 1551550 & 392356.712699044 & 1315600 \tabularnewline
6 & 1596833.33333333 & 394946.190427675 & 1315600 \tabularnewline
7 & 1627816.66666667 & 386693.371204283 & 1430000 \tabularnewline
8 & 1646883.33333333 & 415431.538683973 & 1430000 \tabularnewline
9 & 1634966.66666667 & 453163.914420967 & 1601600 \tabularnewline
\hline
\end{tabular}
%Source: https://freestatistics.org/blog/index.php?pk=280179&T=1

[TABLE]
[ROW][C]Standard Deviation-Mean Plot[/C][/ROW]
[ROW][C]Section[/C][C]Mean[/C][C]Standard Deviation[/C][C]Range[/C][/ROW]
[ROW][C]1[/C][C]1661183.33333333[/C][C]207122.001084707[/C][C]772200[/C][/ROW]
[ROW][C]2[/C][C]1618283.33333333[/C][C]282457.223900068[/C][C]1029600[/C][/ROW]
[ROW][C]3[/C][C]1549166.66666667[/C][C]303124.023022481[/C][C]1001000[/C][/ROW]
[ROW][C]4[/C][C]1563466.66666667[/C][C]332040.800705777[/C][C]1229800[/C][/ROW]
[ROW][C]5[/C][C]1551550[/C][C]392356.712699044[/C][C]1315600[/C][/ROW]
[ROW][C]6[/C][C]1596833.33333333[/C][C]394946.190427675[/C][C]1315600[/C][/ROW]
[ROW][C]7[/C][C]1627816.66666667[/C][C]386693.371204283[/C][C]1430000[/C][/ROW]
[ROW][C]8[/C][C]1646883.33333333[/C][C]415431.538683973[/C][C]1430000[/C][/ROW]
[ROW][C]9[/C][C]1634966.66666667[/C][C]453163.914420967[/C][C]1601600[/C][/ROW]
[/TABLE]
Source: https://freestatistics.org/blog/index.php?pk=280179&T=1

Globally Unique Identifier (entire table): ba.freestatistics.org/blog/index.php?pk=280179&T=1

As an alternative you can also use a QR Code:  

The GUIDs for individual cells are displayed in the table below:

Standard Deviation-Mean Plot
SectionMeanStandard DeviationRange
11661183.33333333207122.001084707772200
21618283.33333333282457.2239000681029600
31549166.66666667303124.0230224811001000
41563466.66666667332040.8007057771229800
51551550392356.7126990441315600
61596833.33333333394946.1904276751315600
71627816.66666667386693.3712042831430000
81646883.33333333415431.5386839731430000
91634966.66666667453163.9144209671601600


Regression: S.E.(k) = alpha + beta * Mean(k)
alpha524442.230545732
beta-0.107448317059865
S.D.0.68875700161761
T-STAT-0.156003230177715
p-value0.88043412050898

\begin{tabular}{lllllllll}
\hline
Regression: S.E.(k) = alpha + beta * Mean(k) \tabularnewline
alpha & 524442.230545732 \tabularnewline
beta & -0.107448317059865 \tabularnewline
S.D. & 0.68875700161761 \tabularnewline
T-STAT & -0.156003230177715 \tabularnewline
p-value & 0.88043412050898 \tabularnewline
\hline
\end{tabular}
%Source: https://freestatistics.org/blog/index.php?pk=280179&T=2

[TABLE]
[ROW][C]Regression: S.E.(k) = alpha + beta * Mean(k)[/C][/ROW]
[ROW][C]alpha[/C][C]524442.230545732[/C][/ROW]
[ROW][C]beta[/C][C]-0.107448317059865[/C][/ROW]
[ROW][C]S.D.[/C][C]0.68875700161761[/C][/ROW]
[ROW][C]T-STAT[/C][C]-0.156003230177715[/C][/ROW]
[ROW][C]p-value[/C][C]0.88043412050898[/C][/ROW]
[/TABLE]
Source: https://freestatistics.org/blog/index.php?pk=280179&T=2

Globally Unique Identifier (entire table): ba.freestatistics.org/blog/index.php?pk=280179&T=2

As an alternative you can also use a QR Code:  

The GUIDs for individual cells are displayed in the table below:

Regression: S.E.(k) = alpha + beta * Mean(k)
alpha524442.230545732
beta-0.107448317059865
S.D.0.68875700161761
T-STAT-0.156003230177715
p-value0.88043412050898


Regression: ln S.E.(k) = alpha + beta * ln Mean(k)
alpha31.2696098924493
beta-1.29633550728187
S.D.3.4558277278626
T-STAT-0.375115778147784
p-value0.718681736243463
Lambda2.29633550728187

\begin{tabular}{lllllllll}
\hline
Regression: ln S.E.(k) = alpha + beta * ln Mean(k) \tabularnewline
alpha & 31.2696098924493 \tabularnewline
beta & -1.29633550728187 \tabularnewline
S.D. & 3.4558277278626 \tabularnewline
T-STAT & -0.375115778147784 \tabularnewline
p-value & 0.718681736243463 \tabularnewline
Lambda & 2.29633550728187 \tabularnewline
\hline
\end{tabular}
%Source: https://freestatistics.org/blog/index.php?pk=280179&T=3

[TABLE]
[ROW][C]Regression: ln S.E.(k) = alpha + beta * ln Mean(k)[/C][/ROW]
[ROW][C]alpha[/C][C]31.2696098924493[/C][/ROW]
[ROW][C]beta[/C][C]-1.29633550728187[/C][/ROW]
[ROW][C]S.D.[/C][C]3.4558277278626[/C][/ROW]
[ROW][C]T-STAT[/C][C]-0.375115778147784[/C][/ROW]
[ROW][C]p-value[/C][C]0.718681736243463[/C][/ROW]
[ROW][C]Lambda[/C][C]2.29633550728187[/C][/ROW]
[/TABLE]
Source: https://freestatistics.org/blog/index.php?pk=280179&T=3

Globally Unique Identifier (entire table): ba.freestatistics.org/blog/index.php?pk=280179&T=3

As an alternative you can also use a QR Code:  

The GUIDs for individual cells are displayed in the table below:

Regression: ln S.E.(k) = alpha + beta * ln Mean(k)
alpha31.2696098924493
beta-1.29633550728187
S.D.3.4558277278626
T-STAT-0.375115778147784
p-value0.718681736243463
Lambda2.29633550728187


Parameters (Session):
Parameters (R input):
par1 = 12 ;
R code (references can be found in the software module):
par1 <- as.numeric(par1)
(n <- length(x))
(np <- floor(n / par1))
arr <- array(NA,dim=c(par1,np))
j <- 0
k <- 1
for (i in 1:(np*par1))
{
j = j + 1
arr[j,k] <- x[i]
if (j == par1) {
j = 0
k=k+1
}
}
arr
arr.mean <- array(NA,dim=np)
arr.sd <- array(NA,dim=np)
arr.range <- array(NA,dim=np)
for (j in 1:np)
{
arr.mean[j] <- mean(arr[,j],na.rm=TRUE)
arr.sd[j] <- sd(arr[,j],na.rm=TRUE)
arr.range[j] <- max(arr[,j],na.rm=TRUE) - min(arr[,j],na.rm=TRUE)
}
arr.mean
arr.sd
arr.range
(lm1 <- lm(arr.sd~arr.mean))
(lnlm1 <- lm(log(arr.sd)~log(arr.mean)))
(lm2 <- lm(arr.range~arr.mean))
bitmap(file='test1.png')
plot(arr.mean,arr.sd,main='Standard Deviation-Mean Plot',xlab='mean',ylab='standard deviation')
dev.off()
bitmap(file='test2.png')
plot(arr.mean,arr.range,main='Range-Mean Plot',xlab='mean',ylab='range')
dev.off()
load(file='createtable')
a<-table.start()
a<-table.row.start(a)
a<-table.element(a,'Standard Deviation-Mean Plot',4,TRUE)
a<-table.row.end(a)
a<-table.row.start(a)
a<-table.element(a,'Section',header=TRUE)
a<-table.element(a,'Mean',header=TRUE)
a<-table.element(a,'Standard Deviation',header=TRUE)
a<-table.element(a,'Range',header=TRUE)
a<-table.row.end(a)
for (j in 1:np) {
a<-table.row.start(a)
a<-table.element(a,j,header=TRUE)
a<-table.element(a,arr.mean[j])
a<-table.element(a,arr.sd[j] )
a<-table.element(a,arr.range[j] )
a<-table.row.end(a)
}
a<-table.end(a)
table.save(a,file='mytable.tab')
a<-table.start()
a<-table.row.start(a)
a<-table.element(a,'Regression: S.E.(k) = alpha + beta * Mean(k)',2,TRUE)
a<-table.row.end(a)
a<-table.row.start(a)
a<-table.element(a,'alpha',header=TRUE)
a<-table.element(a,lm1$coefficients[[1]])
a<-table.row.end(a)
a<-table.row.start(a)
a<-table.element(a,'beta',header=TRUE)
a<-table.element(a,lm1$coefficients[[2]])
a<-table.row.end(a)
a<-table.row.start(a)
a<-table.element(a,'S.D.',header=TRUE)
a<-table.element(a,summary(lm1)$coefficients[2,2])
a<-table.row.end(a)
a<-table.row.start(a)
a<-table.element(a,'T-STAT',header=TRUE)
a<-table.element(a,summary(lm1)$coefficients[2,3])
a<-table.row.end(a)
a<-table.row.start(a)
a<-table.element(a,'p-value',header=TRUE)
a<-table.element(a,summary(lm1)$coefficients[2,4])
a<-table.row.end(a)
a<-table.end(a)
table.save(a,file='mytable1.tab')
a<-table.start()
a<-table.row.start(a)
a<-table.element(a,'Regression: ln S.E.(k) = alpha + beta * ln Mean(k)',2,TRUE)
a<-table.row.end(a)
a<-table.row.start(a)
a<-table.element(a,'alpha',header=TRUE)
a<-table.element(a,lnlm1$coefficients[[1]])
a<-table.row.end(a)
a<-table.row.start(a)
a<-table.element(a,'beta',header=TRUE)
a<-table.element(a,lnlm1$coefficients[[2]])
a<-table.row.end(a)
a<-table.row.start(a)
a<-table.element(a,'S.D.',header=TRUE)
a<-table.element(a,summary(lnlm1)$coefficients[2,2])
a<-table.row.end(a)
a<-table.row.start(a)
a<-table.element(a,'T-STAT',header=TRUE)
a<-table.element(a,summary(lnlm1)$coefficients[2,3])
a<-table.row.end(a)
a<-table.row.start(a)
a<-table.element(a,'p-value',header=TRUE)
a<-table.element(a,summary(lnlm1)$coefficients[2,4])
a<-table.row.end(a)
a<-table.row.start(a)
a<-table.element(a,'Lambda',header=TRUE)
a<-table.element(a,1-lnlm1$coefficients[[2]])
a<-table.row.end(a)
a<-table.end(a)
table.save(a,file='mytable2.tab')