Free Statistics

of Irreproducible Research!

Author's title

Author*Unverified author*
R Software Modulerwasp_smp.wasp
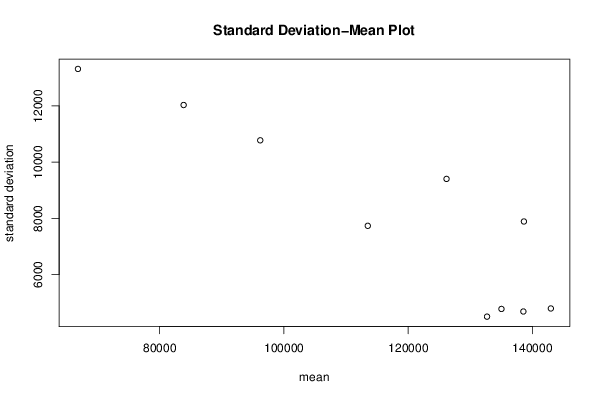
Title produced by softwareStandard Deviation-Mean Plot
Date of computationSun, 16 Aug 2015 10:08:27 +0100
Cite this page as followsStatistical Computations at FreeStatistics.org, Office for Research Development and Education, URL https://freestatistics.org/blog/index.php?v=date/2015/Aug/16/t1439716149chqsmhjyg9r7gxu.htm/, Retrieved Sat, 18 May 2024 19:10:18 +0000
Statistical Computations at FreeStatistics.org, Office for Research Development and Education, URL https://freestatistics.org/blog/index.php?pk=280107, Retrieved Sat, 18 May 2024 19:10:18 +0000
QR Codes:

Original text written by user:
IsPrivate?No (this computation is public)
User-defined keywords
Estimated Impact103
Family? (F = Feedback message, R = changed R code, M = changed R Module, P = changed Parameters, D = changed Data)
-       [Standard Deviation-Mean Plot] [spreidings- en ge...] [2015-08-16 09:08:27] [0d8529ada52922935dd1fcf0fb375c74] [Current]
Feedback Forum

Post a new message
Dataseries X:
133448.00
132951.00
132447.00
131404.00
141722.00
141176.00
133448.00
128310.00
128807.00
128807.00
129360.00
130354.00
131901.00
131901.00
130907.00
128310.00
141722.00
143766.00
140679.00
133448.00
136542.00
131901.00
133994.00
134995.00
136038.00
133448.00
133994.00
130354.00
141722.00
145313.00
142226.00
136542.00
142723.00
136038.00
142226.00
141722.00
143269.00
137585.00
143766.00
143269.00
152544.00
150451.00
142226.00
138082.00
143766.00
136038.00
141722.00
142723.00
144816.00
140182.00
142723.00
144270.00
149954.00
145313.00
139132.00
132447.00
138635.00
121625.00
129857.00
134491.00
139132.00
132447.00
132447.00
132447.00
136038.00
130907.00
124173.00
118538.00
122626.00
106666.00
116445.00
122129.00
123172.00
117488.00
117985.00
116445.00
121625.00
117985.00
110810.00
105623.00
114394.00
95347.00
107716.00
113351.00
113351.00
106666.00
100485.00
99988.00
105623.00
100485.00
90713.00
83979.00
91210.00
74207.00
89663.00
97888.00
100485.00
94801.00
87619.00
92757.00
94801.00
93254.00
77791.00
70616.00
75747.00
60291.00
76251.00
81935.00
86569.00
78841.00
71610.00
75747.00
77791.00
73703.00
58247.00
51513.00
57694.00
40691.00
59241.00
70616.00


Summary of computational transaction
Raw Inputview raw input (R code)
Raw Outputview raw output of R engine
Computing time1 seconds
R Server'Gwilym Jenkins' @ jenkins.wessa.net

\begin{tabular}{lllllllll}
\hline
Summary of computational transaction \tabularnewline
Raw Input & view raw input (R code)  \tabularnewline
Raw Output & view raw output of R engine  \tabularnewline
Computing time & 1 seconds \tabularnewline
R Server & 'Gwilym Jenkins' @ jenkins.wessa.net \tabularnewline
\hline
\end{tabular}
%Source: https://freestatistics.org/blog/index.php?pk=280107&T=0

[TABLE]
[ROW][C]Summary of computational transaction[/C][/ROW]
[ROW][C]Raw Input[/C][C]view raw input (R code) [/C][/ROW]
[ROW][C]Raw Output[/C][C]view raw output of R engine [/C][/ROW]
[ROW][C]Computing time[/C][C]1 seconds[/C][/ROW]
[ROW][C]R Server[/C][C]'Gwilym Jenkins' @ jenkins.wessa.net[/C][/ROW]
[/TABLE]
Source: https://freestatistics.org/blog/index.php?pk=280107&T=0

Globally Unique Identifier (entire table): ba.freestatistics.org/blog/index.php?pk=280107&T=0

As an alternative you can also use a QR Code:  

The GUIDs for individual cells are displayed in the table below:

Summary of computational transaction
Raw Inputview raw input (R code)
Raw Outputview raw output of R engine
Computing time1 seconds
R Server'Gwilym Jenkins' @ jenkins.wessa.net


Standard Deviation-Mean Plot
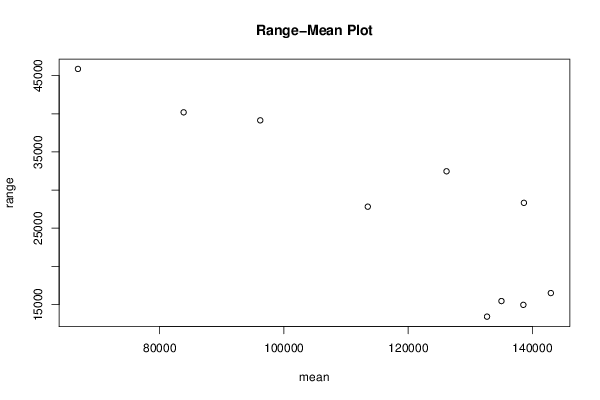
SectionMeanStandard DeviationRange
1132686.1666666674496.5108864001613412
2135005.54771.1004924535915456
3138528.8333333334679.8421658181714959
4142953.4166666674788.1009038189216506
5138620.4166666677884.8549010496128329
6126166.259400.864303833532466
7113495.0833333337731.0546670652627825
896188.166666666710775.352648380939144
983862.333333333312032.126618752740194
1066855.2513316.245861387145878

\begin{tabular}{lllllllll}
\hline
Standard Deviation-Mean Plot \tabularnewline
Section & Mean & Standard Deviation & Range \tabularnewline
1 & 132686.166666667 & 4496.51088640016 & 13412 \tabularnewline
2 & 135005.5 & 4771.10049245359 & 15456 \tabularnewline
3 & 138528.833333333 & 4679.84216581817 & 14959 \tabularnewline
4 & 142953.416666667 & 4788.10090381892 & 16506 \tabularnewline
5 & 138620.416666667 & 7884.85490104961 & 28329 \tabularnewline
6 & 126166.25 & 9400.8643038335 & 32466 \tabularnewline
7 & 113495.083333333 & 7731.05466706526 & 27825 \tabularnewline
8 & 96188.1666666667 & 10775.3526483809 & 39144 \tabularnewline
9 & 83862.3333333333 & 12032.1266187527 & 40194 \tabularnewline
10 & 66855.25 & 13316.2458613871 & 45878 \tabularnewline
\hline
\end{tabular}
%Source: https://freestatistics.org/blog/index.php?pk=280107&T=1

[TABLE]
[ROW][C]Standard Deviation-Mean Plot[/C][/ROW]
[ROW][C]Section[/C][C]Mean[/C][C]Standard Deviation[/C][C]Range[/C][/ROW]
[ROW][C]1[/C][C]132686.166666667[/C][C]4496.51088640016[/C][C]13412[/C][/ROW]
[ROW][C]2[/C][C]135005.5[/C][C]4771.10049245359[/C][C]15456[/C][/ROW]
[ROW][C]3[/C][C]138528.833333333[/C][C]4679.84216581817[/C][C]14959[/C][/ROW]
[ROW][C]4[/C][C]142953.416666667[/C][C]4788.10090381892[/C][C]16506[/C][/ROW]
[ROW][C]5[/C][C]138620.416666667[/C][C]7884.85490104961[/C][C]28329[/C][/ROW]
[ROW][C]6[/C][C]126166.25[/C][C]9400.8643038335[/C][C]32466[/C][/ROW]
[ROW][C]7[/C][C]113495.083333333[/C][C]7731.05466706526[/C][C]27825[/C][/ROW]
[ROW][C]8[/C][C]96188.1666666667[/C][C]10775.3526483809[/C][C]39144[/C][/ROW]
[ROW][C]9[/C][C]83862.3333333333[/C][C]12032.1266187527[/C][C]40194[/C][/ROW]
[ROW][C]10[/C][C]66855.25[/C][C]13316.2458613871[/C][C]45878[/C][/ROW]
[/TABLE]
Source: https://freestatistics.org/blog/index.php?pk=280107&T=1

Globally Unique Identifier (entire table): ba.freestatistics.org/blog/index.php?pk=280107&T=1

As an alternative you can also use a QR Code:  

The GUIDs for individual cells are displayed in the table below:

Standard Deviation-Mean Plot
SectionMeanStandard DeviationRange
1132686.1666666674496.5108864001613412
2135005.54771.1004924535915456
3138528.8333333334679.8421658181714959
4142953.4166666674788.1009038189216506
5138620.4166666677884.8549010496128329
6126166.259400.864303833532466
7113495.0833333337731.0546670652627825
896188.166666666710775.352648380939144
983862.333333333312032.126618752740194
1066855.2513316.245861387145878


Regression: S.E.(k) = alpha + beta * Mean(k)
alpha21275.7152457858
beta-0.113151792219188
S.D.0.0185894327362386
T-STAT-6.08688784777213
p-value0.000293686871073618

\begin{tabular}{lllllllll}
\hline
Regression: S.E.(k) = alpha + beta * Mean(k) \tabularnewline
alpha & 21275.7152457858 \tabularnewline
beta & -0.113151792219188 \tabularnewline
S.D. & 0.0185894327362386 \tabularnewline
T-STAT & -6.08688784777213 \tabularnewline
p-value & 0.000293686871073618 \tabularnewline
\hline
\end{tabular}
%Source: https://freestatistics.org/blog/index.php?pk=280107&T=2

[TABLE]
[ROW][C]Regression: S.E.(k) = alpha + beta * Mean(k)[/C][/ROW]
[ROW][C]alpha[/C][C]21275.7152457858[/C][/ROW]
[ROW][C]beta[/C][C]-0.113151792219188[/C][/ROW]
[ROW][C]S.D.[/C][C]0.0185894327362386[/C][/ROW]
[ROW][C]T-STAT[/C][C]-6.08688784777213[/C][/ROW]
[ROW][C]p-value[/C][C]0.000293686871073618[/C][/ROW]
[/TABLE]
Source: https://freestatistics.org/blog/index.php?pk=280107&T=2

Globally Unique Identifier (entire table): ba.freestatistics.org/blog/index.php?pk=280107&T=2

As an alternative you can also use a QR Code:  

The GUIDs for individual cells are displayed in the table below:

Regression: S.E.(k) = alpha + beta * Mean(k)
alpha21275.7152457858
beta-0.113151792219188
S.D.0.0185894327362386
T-STAT-6.08688784777213
p-value0.000293686871073618


Regression: ln S.E.(k) = alpha + beta * ln Mean(k)
alpha25.0463413102424
beta-1.38589065989076
S.D.0.316605261909548
T-STAT-4.37734563074539
p-value0.00235715681397519
Lambda2.38589065989076

\begin{tabular}{lllllllll}
\hline
Regression: ln S.E.(k) = alpha + beta * ln Mean(k) \tabularnewline
alpha & 25.0463413102424 \tabularnewline
beta & -1.38589065989076 \tabularnewline
S.D. & 0.316605261909548 \tabularnewline
T-STAT & -4.37734563074539 \tabularnewline
p-value & 0.00235715681397519 \tabularnewline
Lambda & 2.38589065989076 \tabularnewline
\hline
\end{tabular}
%Source: https://freestatistics.org/blog/index.php?pk=280107&T=3

[TABLE]
[ROW][C]Regression: ln S.E.(k) = alpha + beta * ln Mean(k)[/C][/ROW]
[ROW][C]alpha[/C][C]25.0463413102424[/C][/ROW]
[ROW][C]beta[/C][C]-1.38589065989076[/C][/ROW]
[ROW][C]S.D.[/C][C]0.316605261909548[/C][/ROW]
[ROW][C]T-STAT[/C][C]-4.37734563074539[/C][/ROW]
[ROW][C]p-value[/C][C]0.00235715681397519[/C][/ROW]
[ROW][C]Lambda[/C][C]2.38589065989076[/C][/ROW]
[/TABLE]
Source: https://freestatistics.org/blog/index.php?pk=280107&T=3

Globally Unique Identifier (entire table): ba.freestatistics.org/blog/index.php?pk=280107&T=3

As an alternative you can also use a QR Code:  

The GUIDs for individual cells are displayed in the table below:

Regression: ln S.E.(k) = alpha + beta * ln Mean(k)
alpha25.0463413102424
beta-1.38589065989076
S.D.0.316605261909548
T-STAT-4.37734563074539
p-value0.00235715681397519
Lambda2.38589065989076


Parameters (Session):
par1 = 12 ;
Parameters (R input):
par1 = 12 ;
R code (references can be found in the software module):
par1 <- as.numeric(par1)
(n <- length(x))
(np <- floor(n / par1))
arr <- array(NA,dim=c(par1,np))
j <- 0
k <- 1
for (i in 1:(np*par1))
{
j = j + 1
arr[j,k] <- x[i]
if (j == par1) {
j = 0
k=k+1
}
}
arr
arr.mean <- array(NA,dim=np)
arr.sd <- array(NA,dim=np)
arr.range <- array(NA,dim=np)
for (j in 1:np)
{
arr.mean[j] <- mean(arr[,j],na.rm=TRUE)
arr.sd[j] <- sd(arr[,j],na.rm=TRUE)
arr.range[j] <- max(arr[,j],na.rm=TRUE) - min(arr[,j],na.rm=TRUE)
}
arr.mean
arr.sd
arr.range
(lm1 <- lm(arr.sd~arr.mean))
(lnlm1 <- lm(log(arr.sd)~log(arr.mean)))
(lm2 <- lm(arr.range~arr.mean))
bitmap(file='test1.png')
plot(arr.mean,arr.sd,main='Standard Deviation-Mean Plot',xlab='mean',ylab='standard deviation')
dev.off()
bitmap(file='test2.png')
plot(arr.mean,arr.range,main='Range-Mean Plot',xlab='mean',ylab='range')
dev.off()
load(file='createtable')
a<-table.start()
a<-table.row.start(a)
a<-table.element(a,'Standard Deviation-Mean Plot',4,TRUE)
a<-table.row.end(a)
a<-table.row.start(a)
a<-table.element(a,'Section',header=TRUE)
a<-table.element(a,'Mean',header=TRUE)
a<-table.element(a,'Standard Deviation',header=TRUE)
a<-table.element(a,'Range',header=TRUE)
a<-table.row.end(a)
for (j in 1:np) {
a<-table.row.start(a)
a<-table.element(a,j,header=TRUE)
a<-table.element(a,arr.mean[j])
a<-table.element(a,arr.sd[j] )
a<-table.element(a,arr.range[j] )
a<-table.row.end(a)
}
a<-table.end(a)
table.save(a,file='mytable.tab')
a<-table.start()
a<-table.row.start(a)
a<-table.element(a,'Regression: S.E.(k) = alpha + beta * Mean(k)',2,TRUE)
a<-table.row.end(a)
a<-table.row.start(a)
a<-table.element(a,'alpha',header=TRUE)
a<-table.element(a,lm1$coefficients[[1]])
a<-table.row.end(a)
a<-table.row.start(a)
a<-table.element(a,'beta',header=TRUE)
a<-table.element(a,lm1$coefficients[[2]])
a<-table.row.end(a)
a<-table.row.start(a)
a<-table.element(a,'S.D.',header=TRUE)
a<-table.element(a,summary(lm1)$coefficients[2,2])
a<-table.row.end(a)
a<-table.row.start(a)
a<-table.element(a,'T-STAT',header=TRUE)
a<-table.element(a,summary(lm1)$coefficients[2,3])
a<-table.row.end(a)
a<-table.row.start(a)
a<-table.element(a,'p-value',header=TRUE)
a<-table.element(a,summary(lm1)$coefficients[2,4])
a<-table.row.end(a)
a<-table.end(a)
table.save(a,file='mytable1.tab')
a<-table.start()
a<-table.row.start(a)
a<-table.element(a,'Regression: ln S.E.(k) = alpha + beta * ln Mean(k)',2,TRUE)
a<-table.row.end(a)
a<-table.row.start(a)
a<-table.element(a,'alpha',header=TRUE)
a<-table.element(a,lnlm1$coefficients[[1]])
a<-table.row.end(a)
a<-table.row.start(a)
a<-table.element(a,'beta',header=TRUE)
a<-table.element(a,lnlm1$coefficients[[2]])
a<-table.row.end(a)
a<-table.row.start(a)
a<-table.element(a,'S.D.',header=TRUE)
a<-table.element(a,summary(lnlm1)$coefficients[2,2])
a<-table.row.end(a)
a<-table.row.start(a)
a<-table.element(a,'T-STAT',header=TRUE)
a<-table.element(a,summary(lnlm1)$coefficients[2,3])
a<-table.row.end(a)
a<-table.row.start(a)
a<-table.element(a,'p-value',header=TRUE)
a<-table.element(a,summary(lnlm1)$coefficients[2,4])
a<-table.row.end(a)
a<-table.row.start(a)
a<-table.element(a,'Lambda',header=TRUE)
a<-table.element(a,1-lnlm1$coefficients[[2]])
a<-table.row.end(a)
a<-table.end(a)
table.save(a,file='mytable2.tab')