Free Statistics
of Irreproducible Research!
Description of Statistical Computation | |||||||||||||||||||||||||||||||||||||||||
|---|---|---|---|---|---|---|---|---|---|---|---|---|---|---|---|---|---|---|---|---|---|---|---|---|---|---|---|---|---|---|---|---|---|---|---|---|---|---|---|---|---|
| Author's title | |||||||||||||||||||||||||||||||||||||||||
| Author | *Unverified author* | ||||||||||||||||||||||||||||||||||||||||
| R Software Module | rwasp_univariatedataseries.wasp | ||||||||||||||||||||||||||||||||||||||||
| Title produced by software | Univariate Data Series | ||||||||||||||||||||||||||||||||||||||||
| Date of computation | Fri, 14 Aug 2015 18:46:02 +0100 | ||||||||||||||||||||||||||||||||||||||||
| Cite this page as follows | Statistical Computations at FreeStatistics.org, Office for Research Development and Education, URL https://freestatistics.org/blog/index.php?v=date/2015/Aug/14/t1439574452bq9f5sovvd682dd.htm/, Retrieved Wed, 02 Jul 2025 04:17:14 +0000 | ||||||||||||||||||||||||||||||||||||||||
| Statistical Computations at FreeStatistics.org, Office for Research Development and Education, URL https://freestatistics.org/blog/index.php?pk=280073, Retrieved Wed, 02 Jul 2025 04:17:14 +0000 | |||||||||||||||||||||||||||||||||||||||||
| QR Codes: | |||||||||||||||||||||||||||||||||||||||||
|
| |||||||||||||||||||||||||||||||||||||||||
| Original text written by user: | |||||||||||||||||||||||||||||||||||||||||
| IsPrivate? | No (this computation is public) | ||||||||||||||||||||||||||||||||||||||||
| User-defined keywords | |||||||||||||||||||||||||||||||||||||||||
| Estimated Impact | 222 | ||||||||||||||||||||||||||||||||||||||||
Tree of Dependent Computations | |||||||||||||||||||||||||||||||||||||||||
| Family? (F = Feedback message, R = changed R code, M = changed R Module, P = changed Parameters, D = changed Data) | |||||||||||||||||||||||||||||||||||||||||
| - [Univariate Data Series] [] [2015-08-14 17:07:23] [74be16979710d4c4e7c6647856088456] - R PD [Univariate Data Series] [] [2015-08-14 17:46:02] [f898ec974b62c60a8bec4044c4c271e3] [Current] | |||||||||||||||||||||||||||||||||||||||||
| Feedback Forum | |||||||||||||||||||||||||||||||||||||||||
Post a new message | |||||||||||||||||||||||||||||||||||||||||
Dataset | |||||||||||||||||||||||||||||||||||||||||
| Dataseries X: | |||||||||||||||||||||||||||||||||||||||||
5452304 5431998 5411406 5368792 5790356 5768048 5452304 5242380 5262686 5262686 5285280 5325892 5389098 5389098 5348486 5242380 5790356 5873868 5747742 5452304 5578716 5389098 5474612 5515510 5558124 5452304 5474612 5325892 5790356 5937074 5810948 5578716 5831254 5558124 5810948 5790356 5853562 5621330 5873868 5853562 6232512 6146998 5810948 5641636 5873868 5558124 5790356 5831254 5916768 5727436 5831254 5894460 6126692 5937074 5684536 5411406 5664230 4969250 5305586 5494918 5684536 5411406 5411406 5411406 5558124 5348486 5073354 4843124 5010148 4358068 4757610 4989842 5032456 4800224 4820530 4757610 4969250 4820530 4527380 4315454 4673812 3895606 4400968 4631198 4631198 4358068 4105530 4085224 4315454 4105530 3706274 3431142 3726580 3031886 3663374 3999424 4105530 3873298 3579862 3789786 3873298 3810092 3178318 2885168 3094806 2463318 3115398 3347630 3536962 3221218 2925780 3094806 3178318 3011294 2379806 2104674 2357212 1662518 2420418 2885168 | |||||||||||||||||||||||||||||||||||||||||
Tables (Output of Computation) | |||||||||||||||||||||||||||||||||||||||||
| |||||||||||||||||||||||||||||||||||||||||
Figures (Output of Computation) | |||||||||||||||||||||||||||||||||||||||||
Input Parameters & R Code | |||||||||||||||||||||||||||||||||||||||||
| Parameters (Session): | |||||||||||||||||||||||||||||||||||||||||
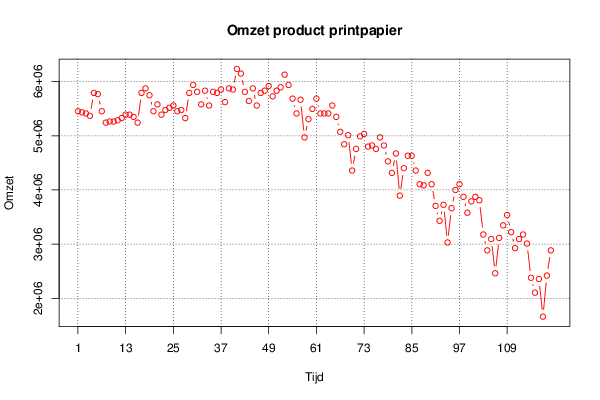
| par1 = Omzet product printpapier (EUR jaarbasis) ; par2 = niet gekend ; par3 = Deze reeks geeft de omzet van printpapier op jaarbasis weer van januari 2005 tot december 2014 ; par4 = 12 ; | |||||||||||||||||||||||||||||||||||||||||
| Parameters (R input): | |||||||||||||||||||||||||||||||||||||||||
| par1 = Omzet product printpapier (EUR jaarbasis) ; par2 = niet gekend ; par3 = Deze reeks geeft de omzet van printpapier op jaarbasis weer van januari 2005 tot december 2014 ; par4 = 12 ; | |||||||||||||||||||||||||||||||||||||||||
| R code (references can be found in the software module): | |||||||||||||||||||||||||||||||||||||||||
par4 <- 'No season' | |||||||||||||||||||||||||||||||||||||||||