Free Statistics

of Irreproducible Research!

Author's title

Author*Unverified author*
R Software Modulerwasp_exponentialsmoothing.wasp
Title produced by softwareExponential Smoothing
Date of computationWed, 01 Apr 2015 20:37:07 +0100
Cite this page as followsStatistical Computations at FreeStatistics.org, Office for Research Development and Education, URL https://freestatistics.org/blog/index.php?v=date/2015/Apr/01/t1427917104utl46y4w6wxberl.htm/, Retrieved Thu, 09 May 2024 17:15:26 +0000
Statistical Computations at FreeStatistics.org, Office for Research Development and Education, URL https://freestatistics.org/blog/index.php?pk=278534, Retrieved Thu, 09 May 2024 17:15:26 +0000
QR Codes:

Original text written by user:
IsPrivate?No (this computation is public)
User-defined keywords
Estimated Impact136
Family? (F = Feedback message, R = changed R code, M = changed R Module, P = changed Parameters, D = changed Data)
-       [Exponential Smoothing] [] [2015-04-01 19:37:07] [4fa22ecf638daf61dea82ccfb30e12bf] [Current]
Feedback Forum

Post a new message
Dataseries X:
2201
1239
966
1001
1079
909
1038
817
817
926
555
156
1604
610
635
623
744
939
993
634
858
849
458
109
1538
739
855
834
1004
1355
968
811
1121
960
973
233
1662
894
966
859
946
1156
895
952
1078
689
621
587
1425
1022
1406
776
1105
2244
679
665
704
449
560
229
1158
908
1104
731
989
1308
757
896
917
844
815
401


Summary of computational transaction
Raw Inputview raw input (R code)
Raw Outputview raw output of R engine
Computing time1 seconds
R Server'Herman Ole Andreas Wold' @ wold.wessa.net

\begin{tabular}{lllllllll}
\hline
Summary of computational transaction \tabularnewline
Raw Input & view raw input (R code)  \tabularnewline
Raw Output & view raw output of R engine  \tabularnewline
Computing time & 1 seconds \tabularnewline
R Server & 'Herman Ole Andreas Wold' @ wold.wessa.net \tabularnewline
\hline
\end{tabular}
%Source: https://freestatistics.org/blog/index.php?pk=278534&T=0

[TABLE]
[ROW][C]Summary of computational transaction[/C][/ROW]
[ROW][C]Raw Input[/C][C]view raw input (R code) [/C][/ROW]
[ROW][C]Raw Output[/C][C]view raw output of R engine [/C][/ROW]
[ROW][C]Computing time[/C][C]1 seconds[/C][/ROW]
[ROW][C]R Server[/C][C]'Herman Ole Andreas Wold' @ wold.wessa.net[/C][/ROW]
[/TABLE]
Source: https://freestatistics.org/blog/index.php?pk=278534&T=0

Globally Unique Identifier (entire table): ba.freestatistics.org/blog/index.php?pk=278534&T=0

As an alternative you can also use a QR Code:  

The GUIDs for individual cells are displayed in the table below:

Summary of computational transaction
Raw Inputview raw input (R code)
Raw Outputview raw output of R engine
Computing time1 seconds
R Server'Herman Ole Andreas Wold' @ wold.wessa.net


Estimated Parameters of Exponential Smoothing
ParameterValue
alpha0.117755567979608
beta0.00908839478896222
gamma0.581463350902353

\begin{tabular}{lllllllll}
\hline
Estimated Parameters of Exponential Smoothing \tabularnewline
Parameter & Value \tabularnewline
alpha & 0.117755567979608 \tabularnewline
beta & 0.00908839478896222 \tabularnewline
gamma & 0.581463350902353 \tabularnewline
\hline
\end{tabular}
%Source: https://freestatistics.org/blog/index.php?pk=278534&T=1

[TABLE]
[ROW][C]Estimated Parameters of Exponential Smoothing[/C][/ROW]
[ROW][C]Parameter[/C][C]Value[/C][/ROW]
[ROW][C]alpha[/C][C]0.117755567979608[/C][/ROW]
[ROW][C]beta[/C][C]0.00908839478896222[/C][/ROW]
[ROW][C]gamma[/C][C]0.581463350902353[/C][/ROW]
[/TABLE]
Source: https://freestatistics.org/blog/index.php?pk=278534&T=1

Globally Unique Identifier (entire table): ba.freestatistics.org/blog/index.php?pk=278534&T=1

As an alternative you can also use a QR Code:  

The GUIDs for individual cells are displayed in the table below:

Estimated Parameters of Exponential Smoothing
ParameterValue
alpha0.117755567979608
beta0.00908839478896222
gamma0.581463350902353


Interpolation Forecasts of Exponential Smoothing
tObservedFittedResiduals
1316041885.09849726468-281.098497264678
14610700.488574720233-90.4885747202334
15635710.469776451733-75.4697764517333
16623676.66631661472-53.6663166147202
17744792.412149160289-48.4121491602888
18939980.689566208545-41.6895662085452
19993840.961888098667152.038111901333
20634699.798213494159-65.7982134941594
21858708.905825502506149.094174497494
22849834.85838103389614.1416189661041
23458508.909668586783-50.9096685867834
24109140.461570487184-31.461570487184
2515381267.1928567617270.807143238296
26739494.051314643772244.948685356228
27855543.404584959564311.595415040436
28834566.905634867509267.094365132491
291004714.424663947271289.575336052729
301355943.989728410954411.010271589046
31968957.006534332610.9934656674
32811682.830556986684128.169443013316
331121833.937860031864287.062139968136
34960914.00936809093645.9906319090637
35973528.163020120619444.836979879381
36233151.98552280257581.0144771974246
3716621897.64031645829-235.640316458291
38894804.3293384880889.67066151192
39966878.08038176554187.9196182344592
40859842.19221627532516.8077837246746
41946988.224411734167-42.2244117341667
4211561259.72414113128-103.72414113128
438951000.7347436359-105.734743635901
44952767.882704581822184.117295418178
4510781011.1498388482466.8501611517631
46689942.877110784029-253.877110784029
47621712.979936180994-91.9799361809937
48587165.59611997757421.40388002243
4914251886.0947827842-461.094782784204
501022892.189651749958129.810348250042
511406975.138908516748430.861091483252
52776938.174670904841-162.174670904841
5311051044.7658328079260.2341671920819
5422441323.69231276601920.307687233988
556791140.08786078242-461.087860782421
566651004.18138849425-339.181388494253
577041143.8749591542-439.874959154205
58449840.029420745063-391.029420745063
59560675.868030934987-115.868030934987
60229336.219871208435-107.219871208435
6111581225.7774061206-67.7774061205982
62908727.529719010156180.470280989844
631104906.932428753586197.067571246414
64731633.24374423948997.756255760511
65989825.918728082081163.081271917919
6613081368.20229817919-60.2022981791943
67757633.688753128639123.311246871361
68896625.332451213403270.667548786597
69917752.788206716594164.211793283406
70844558.877342363816285.122657636184
71815615.163381506915199.836618493085
72401296.542483153954104.457516846046

\begin{tabular}{lllllllll}
\hline
Interpolation Forecasts of Exponential Smoothing \tabularnewline
t & Observed & Fitted & Residuals \tabularnewline
13 & 1604 & 1885.09849726468 & -281.098497264678 \tabularnewline
14 & 610 & 700.488574720233 & -90.4885747202334 \tabularnewline
15 & 635 & 710.469776451733 & -75.4697764517333 \tabularnewline
16 & 623 & 676.66631661472 & -53.6663166147202 \tabularnewline
17 & 744 & 792.412149160289 & -48.4121491602888 \tabularnewline
18 & 939 & 980.689566208545 & -41.6895662085452 \tabularnewline
19 & 993 & 840.961888098667 & 152.038111901333 \tabularnewline
20 & 634 & 699.798213494159 & -65.7982134941594 \tabularnewline
21 & 858 & 708.905825502506 & 149.094174497494 \tabularnewline
22 & 849 & 834.858381033896 & 14.1416189661041 \tabularnewline
23 & 458 & 508.909668586783 & -50.9096685867834 \tabularnewline
24 & 109 & 140.461570487184 & -31.461570487184 \tabularnewline
25 & 1538 & 1267.1928567617 & 270.807143238296 \tabularnewline
26 & 739 & 494.051314643772 & 244.948685356228 \tabularnewline
27 & 855 & 543.404584959564 & 311.595415040436 \tabularnewline
28 & 834 & 566.905634867509 & 267.094365132491 \tabularnewline
29 & 1004 & 714.424663947271 & 289.575336052729 \tabularnewline
30 & 1355 & 943.989728410954 & 411.010271589046 \tabularnewline
31 & 968 & 957.0065343326 & 10.9934656674 \tabularnewline
32 & 811 & 682.830556986684 & 128.169443013316 \tabularnewline
33 & 1121 & 833.937860031864 & 287.062139968136 \tabularnewline
34 & 960 & 914.009368090936 & 45.9906319090637 \tabularnewline
35 & 973 & 528.163020120619 & 444.836979879381 \tabularnewline
36 & 233 & 151.985522802575 & 81.0144771974246 \tabularnewline
37 & 1662 & 1897.64031645829 & -235.640316458291 \tabularnewline
38 & 894 & 804.32933848808 & 89.67066151192 \tabularnewline
39 & 966 & 878.080381765541 & 87.9196182344592 \tabularnewline
40 & 859 & 842.192216275325 & 16.8077837246746 \tabularnewline
41 & 946 & 988.224411734167 & -42.2244117341667 \tabularnewline
42 & 1156 & 1259.72414113128 & -103.72414113128 \tabularnewline
43 & 895 & 1000.7347436359 & -105.734743635901 \tabularnewline
44 & 952 & 767.882704581822 & 184.117295418178 \tabularnewline
45 & 1078 & 1011.14983884824 & 66.8501611517631 \tabularnewline
46 & 689 & 942.877110784029 & -253.877110784029 \tabularnewline
47 & 621 & 712.979936180994 & -91.9799361809937 \tabularnewline
48 & 587 & 165.59611997757 & 421.40388002243 \tabularnewline
49 & 1425 & 1886.0947827842 & -461.094782784204 \tabularnewline
50 & 1022 & 892.189651749958 & 129.810348250042 \tabularnewline
51 & 1406 & 975.138908516748 & 430.861091483252 \tabularnewline
52 & 776 & 938.174670904841 & -162.174670904841 \tabularnewline
53 & 1105 & 1044.76583280792 & 60.2341671920819 \tabularnewline
54 & 2244 & 1323.69231276601 & 920.307687233988 \tabularnewline
55 & 679 & 1140.08786078242 & -461.087860782421 \tabularnewline
56 & 665 & 1004.18138849425 & -339.181388494253 \tabularnewline
57 & 704 & 1143.8749591542 & -439.874959154205 \tabularnewline
58 & 449 & 840.029420745063 & -391.029420745063 \tabularnewline
59 & 560 & 675.868030934987 & -115.868030934987 \tabularnewline
60 & 229 & 336.219871208435 & -107.219871208435 \tabularnewline
61 & 1158 & 1225.7774061206 & -67.7774061205982 \tabularnewline
62 & 908 & 727.529719010156 & 180.470280989844 \tabularnewline
63 & 1104 & 906.932428753586 & 197.067571246414 \tabularnewline
64 & 731 & 633.243744239489 & 97.756255760511 \tabularnewline
65 & 989 & 825.918728082081 & 163.081271917919 \tabularnewline
66 & 1308 & 1368.20229817919 & -60.2022981791943 \tabularnewline
67 & 757 & 633.688753128639 & 123.311246871361 \tabularnewline
68 & 896 & 625.332451213403 & 270.667548786597 \tabularnewline
69 & 917 & 752.788206716594 & 164.211793283406 \tabularnewline
70 & 844 & 558.877342363816 & 285.122657636184 \tabularnewline
71 & 815 & 615.163381506915 & 199.836618493085 \tabularnewline
72 & 401 & 296.542483153954 & 104.457516846046 \tabularnewline
\hline
\end{tabular}
%Source: https://freestatistics.org/blog/index.php?pk=278534&T=2

[TABLE]
[ROW][C]Interpolation Forecasts of Exponential Smoothing[/C][/ROW]
[ROW][C]t[/C][C]Observed[/C][C]Fitted[/C][C]Residuals[/C][/ROW]
[ROW][C]13[/C][C]1604[/C][C]1885.09849726468[/C][C]-281.098497264678[/C][/ROW]
[ROW][C]14[/C][C]610[/C][C]700.488574720233[/C][C]-90.4885747202334[/C][/ROW]
[ROW][C]15[/C][C]635[/C][C]710.469776451733[/C][C]-75.4697764517333[/C][/ROW]
[ROW][C]16[/C][C]623[/C][C]676.66631661472[/C][C]-53.6663166147202[/C][/ROW]
[ROW][C]17[/C][C]744[/C][C]792.412149160289[/C][C]-48.4121491602888[/C][/ROW]
[ROW][C]18[/C][C]939[/C][C]980.689566208545[/C][C]-41.6895662085452[/C][/ROW]
[ROW][C]19[/C][C]993[/C][C]840.961888098667[/C][C]152.038111901333[/C][/ROW]
[ROW][C]20[/C][C]634[/C][C]699.798213494159[/C][C]-65.7982134941594[/C][/ROW]
[ROW][C]21[/C][C]858[/C][C]708.905825502506[/C][C]149.094174497494[/C][/ROW]
[ROW][C]22[/C][C]849[/C][C]834.858381033896[/C][C]14.1416189661041[/C][/ROW]
[ROW][C]23[/C][C]458[/C][C]508.909668586783[/C][C]-50.9096685867834[/C][/ROW]
[ROW][C]24[/C][C]109[/C][C]140.461570487184[/C][C]-31.461570487184[/C][/ROW]
[ROW][C]25[/C][C]1538[/C][C]1267.1928567617[/C][C]270.807143238296[/C][/ROW]
[ROW][C]26[/C][C]739[/C][C]494.051314643772[/C][C]244.948685356228[/C][/ROW]
[ROW][C]27[/C][C]855[/C][C]543.404584959564[/C][C]311.595415040436[/C][/ROW]
[ROW][C]28[/C][C]834[/C][C]566.905634867509[/C][C]267.094365132491[/C][/ROW]
[ROW][C]29[/C][C]1004[/C][C]714.424663947271[/C][C]289.575336052729[/C][/ROW]
[ROW][C]30[/C][C]1355[/C][C]943.989728410954[/C][C]411.010271589046[/C][/ROW]
[ROW][C]31[/C][C]968[/C][C]957.0065343326[/C][C]10.9934656674[/C][/ROW]
[ROW][C]32[/C][C]811[/C][C]682.830556986684[/C][C]128.169443013316[/C][/ROW]
[ROW][C]33[/C][C]1121[/C][C]833.937860031864[/C][C]287.062139968136[/C][/ROW]
[ROW][C]34[/C][C]960[/C][C]914.009368090936[/C][C]45.9906319090637[/C][/ROW]
[ROW][C]35[/C][C]973[/C][C]528.163020120619[/C][C]444.836979879381[/C][/ROW]
[ROW][C]36[/C][C]233[/C][C]151.985522802575[/C][C]81.0144771974246[/C][/ROW]
[ROW][C]37[/C][C]1662[/C][C]1897.64031645829[/C][C]-235.640316458291[/C][/ROW]
[ROW][C]38[/C][C]894[/C][C]804.32933848808[/C][C]89.67066151192[/C][/ROW]
[ROW][C]39[/C][C]966[/C][C]878.080381765541[/C][C]87.9196182344592[/C][/ROW]
[ROW][C]40[/C][C]859[/C][C]842.192216275325[/C][C]16.8077837246746[/C][/ROW]
[ROW][C]41[/C][C]946[/C][C]988.224411734167[/C][C]-42.2244117341667[/C][/ROW]
[ROW][C]42[/C][C]1156[/C][C]1259.72414113128[/C][C]-103.72414113128[/C][/ROW]
[ROW][C]43[/C][C]895[/C][C]1000.7347436359[/C][C]-105.734743635901[/C][/ROW]
[ROW][C]44[/C][C]952[/C][C]767.882704581822[/C][C]184.117295418178[/C][/ROW]
[ROW][C]45[/C][C]1078[/C][C]1011.14983884824[/C][C]66.8501611517631[/C][/ROW]
[ROW][C]46[/C][C]689[/C][C]942.877110784029[/C][C]-253.877110784029[/C][/ROW]
[ROW][C]47[/C][C]621[/C][C]712.979936180994[/C][C]-91.9799361809937[/C][/ROW]
[ROW][C]48[/C][C]587[/C][C]165.59611997757[/C][C]421.40388002243[/C][/ROW]
[ROW][C]49[/C][C]1425[/C][C]1886.0947827842[/C][C]-461.094782784204[/C][/ROW]
[ROW][C]50[/C][C]1022[/C][C]892.189651749958[/C][C]129.810348250042[/C][/ROW]
[ROW][C]51[/C][C]1406[/C][C]975.138908516748[/C][C]430.861091483252[/C][/ROW]
[ROW][C]52[/C][C]776[/C][C]938.174670904841[/C][C]-162.174670904841[/C][/ROW]
[ROW][C]53[/C][C]1105[/C][C]1044.76583280792[/C][C]60.2341671920819[/C][/ROW]
[ROW][C]54[/C][C]2244[/C][C]1323.69231276601[/C][C]920.307687233988[/C][/ROW]
[ROW][C]55[/C][C]679[/C][C]1140.08786078242[/C][C]-461.087860782421[/C][/ROW]
[ROW][C]56[/C][C]665[/C][C]1004.18138849425[/C][C]-339.181388494253[/C][/ROW]
[ROW][C]57[/C][C]704[/C][C]1143.8749591542[/C][C]-439.874959154205[/C][/ROW]
[ROW][C]58[/C][C]449[/C][C]840.029420745063[/C][C]-391.029420745063[/C][/ROW]
[ROW][C]59[/C][C]560[/C][C]675.868030934987[/C][C]-115.868030934987[/C][/ROW]
[ROW][C]60[/C][C]229[/C][C]336.219871208435[/C][C]-107.219871208435[/C][/ROW]
[ROW][C]61[/C][C]1158[/C][C]1225.7774061206[/C][C]-67.7774061205982[/C][/ROW]
[ROW][C]62[/C][C]908[/C][C]727.529719010156[/C][C]180.470280989844[/C][/ROW]
[ROW][C]63[/C][C]1104[/C][C]906.932428753586[/C][C]197.067571246414[/C][/ROW]
[ROW][C]64[/C][C]731[/C][C]633.243744239489[/C][C]97.756255760511[/C][/ROW]
[ROW][C]65[/C][C]989[/C][C]825.918728082081[/C][C]163.081271917919[/C][/ROW]
[ROW][C]66[/C][C]1308[/C][C]1368.20229817919[/C][C]-60.2022981791943[/C][/ROW]
[ROW][C]67[/C][C]757[/C][C]633.688753128639[/C][C]123.311246871361[/C][/ROW]
[ROW][C]68[/C][C]896[/C][C]625.332451213403[/C][C]270.667548786597[/C][/ROW]
[ROW][C]69[/C][C]917[/C][C]752.788206716594[/C][C]164.211793283406[/C][/ROW]
[ROW][C]70[/C][C]844[/C][C]558.877342363816[/C][C]285.122657636184[/C][/ROW]
[ROW][C]71[/C][C]815[/C][C]615.163381506915[/C][C]199.836618493085[/C][/ROW]
[ROW][C]72[/C][C]401[/C][C]296.542483153954[/C][C]104.457516846046[/C][/ROW]
[/TABLE]
Source: https://freestatistics.org/blog/index.php?pk=278534&T=2

Globally Unique Identifier (entire table): ba.freestatistics.org/blog/index.php?pk=278534&T=2

As an alternative you can also use a QR Code:  

The GUIDs for individual cells are displayed in the table below:

Interpolation Forecasts of Exponential Smoothing
tObservedFittedResiduals
1316041885.09849726468-281.098497264678
14610700.488574720233-90.4885747202334
15635710.469776451733-75.4697764517333
16623676.66631661472-53.6663166147202
17744792.412149160289-48.4121491602888
18939980.689566208545-41.6895662085452
19993840.961888098667152.038111901333
20634699.798213494159-65.7982134941594
21858708.905825502506149.094174497494
22849834.85838103389614.1416189661041
23458508.909668586783-50.9096685867834
24109140.461570487184-31.461570487184
2515381267.1928567617270.807143238296
26739494.051314643772244.948685356228
27855543.404584959564311.595415040436
28834566.905634867509267.094365132491
291004714.424663947271289.575336052729
301355943.989728410954411.010271589046
31968957.006534332610.9934656674
32811682.830556986684128.169443013316
331121833.937860031864287.062139968136
34960914.00936809093645.9906319090637
35973528.163020120619444.836979879381
36233151.98552280257581.0144771974246
3716621897.64031645829-235.640316458291
38894804.3293384880889.67066151192
39966878.08038176554187.9196182344592
40859842.19221627532516.8077837246746
41946988.224411734167-42.2244117341667
4211561259.72414113128-103.72414113128
438951000.7347436359-105.734743635901
44952767.882704581822184.117295418178
4510781011.1498388482466.8501611517631
46689942.877110784029-253.877110784029
47621712.979936180994-91.9799361809937
48587165.59611997757421.40388002243
4914251886.0947827842-461.094782784204
501022892.189651749958129.810348250042
511406975.138908516748430.861091483252
52776938.174670904841-162.174670904841
5311051044.7658328079260.2341671920819
5422441323.69231276601920.307687233988
556791140.08786078242-461.087860782421
566651004.18138849425-339.181388494253
577041143.8749591542-439.874959154205
58449840.029420745063-391.029420745063
59560675.868030934987-115.868030934987
60229336.219871208435-107.219871208435
6111581225.7774061206-67.7774061205982
62908727.529719010156180.470280989844
631104906.932428753586197.067571246414
64731633.24374423948997.756255760511
65989825.918728082081163.081271917919
6613081368.20229817919-60.2022981791943
67757633.688753128639123.311246871361
68896625.332451213403270.667548786597
69917752.788206716594164.211793283406
70844558.877342363816285.122657636184
71815615.163381506915199.836618493085
72401296.542483153954104.457516846046


Extrapolation Forecasts of Exponential Smoothing
tForecast95% Lower Bound95% Upper Bound
731375.743025690381070.832431224491680.65362015626
74955.457234562286647.8881178557831263.02635126879
751146.94763038628830.2757210463041463.61953972627
76762.070053158495449.3000746691821074.84003164781
77998.990336694259671.1613804157081326.81929297281
781442.733522765921080.031513222591805.43553230925
79756.875017787165432.8783789210281080.8716566533
80808.107313014992474.7954770193691141.41914901061
81849.043960153976506.1454485954271191.94247171253
82691.730639217704356.6756312695441026.78564716586
83668.43791724461329.4190486345171007.4567858547
84313.546492856644236.051720053311391.041265659977

\begin{tabular}{lllllllll}
\hline
Extrapolation Forecasts of Exponential Smoothing \tabularnewline
t & Forecast & 95% Lower Bound & 95% Upper Bound \tabularnewline
73 & 1375.74302569038 & 1070.83243122449 & 1680.65362015626 \tabularnewline
74 & 955.457234562286 & 647.888117855783 & 1263.02635126879 \tabularnewline
75 & 1146.94763038628 & 830.275721046304 & 1463.61953972627 \tabularnewline
76 & 762.070053158495 & 449.300074669182 & 1074.84003164781 \tabularnewline
77 & 998.990336694259 & 671.161380415708 & 1326.81929297281 \tabularnewline
78 & 1442.73352276592 & 1080.03151322259 & 1805.43553230925 \tabularnewline
79 & 756.875017787165 & 432.878378921028 & 1080.8716566533 \tabularnewline
80 & 808.107313014992 & 474.795477019369 & 1141.41914901061 \tabularnewline
81 & 849.043960153976 & 506.145448595427 & 1191.94247171253 \tabularnewline
82 & 691.730639217704 & 356.675631269544 & 1026.78564716586 \tabularnewline
83 & 668.43791724461 & 329.419048634517 & 1007.4567858547 \tabularnewline
84 & 313.546492856644 & 236.051720053311 & 391.041265659977 \tabularnewline
\hline
\end{tabular}
%Source: https://freestatistics.org/blog/index.php?pk=278534&T=3

[TABLE]
[ROW][C]Extrapolation Forecasts of Exponential Smoothing[/C][/ROW]
[ROW][C]t[/C][C]Forecast[/C][C]95% Lower Bound[/C][C]95% Upper Bound[/C][/ROW]
[ROW][C]73[/C][C]1375.74302569038[/C][C]1070.83243122449[/C][C]1680.65362015626[/C][/ROW]
[ROW][C]74[/C][C]955.457234562286[/C][C]647.888117855783[/C][C]1263.02635126879[/C][/ROW]
[ROW][C]75[/C][C]1146.94763038628[/C][C]830.275721046304[/C][C]1463.61953972627[/C][/ROW]
[ROW][C]76[/C][C]762.070053158495[/C][C]449.300074669182[/C][C]1074.84003164781[/C][/ROW]
[ROW][C]77[/C][C]998.990336694259[/C][C]671.161380415708[/C][C]1326.81929297281[/C][/ROW]
[ROW][C]78[/C][C]1442.73352276592[/C][C]1080.03151322259[/C][C]1805.43553230925[/C][/ROW]
[ROW][C]79[/C][C]756.875017787165[/C][C]432.878378921028[/C][C]1080.8716566533[/C][/ROW]
[ROW][C]80[/C][C]808.107313014992[/C][C]474.795477019369[/C][C]1141.41914901061[/C][/ROW]
[ROW][C]81[/C][C]849.043960153976[/C][C]506.145448595427[/C][C]1191.94247171253[/C][/ROW]
[ROW][C]82[/C][C]691.730639217704[/C][C]356.675631269544[/C][C]1026.78564716586[/C][/ROW]
[ROW][C]83[/C][C]668.43791724461[/C][C]329.419048634517[/C][C]1007.4567858547[/C][/ROW]
[ROW][C]84[/C][C]313.546492856644[/C][C]236.051720053311[/C][C]391.041265659977[/C][/ROW]
[/TABLE]
Source: https://freestatistics.org/blog/index.php?pk=278534&T=3

Globally Unique Identifier (entire table): ba.freestatistics.org/blog/index.php?pk=278534&T=3

As an alternative you can also use a QR Code:  

The GUIDs for individual cells are displayed in the table below:

Extrapolation Forecasts of Exponential Smoothing
tForecast95% Lower Bound95% Upper Bound
731375.743025690381070.832431224491680.65362015626
74955.457234562286647.8881178557831263.02635126879
751146.94763038628830.2757210463041463.61953972627
76762.070053158495449.3000746691821074.84003164781
77998.990336694259671.1613804157081326.81929297281
781442.733522765921080.031513222591805.43553230925
79756.875017787165432.8783789210281080.8716566533
80808.107313014992474.7954770193691141.41914901061
81849.043960153976506.1454485954271191.94247171253
82691.730639217704356.6756312695441026.78564716586
83668.43791724461329.4190486345171007.4567858547
84313.546492856644236.051720053311391.041265659977


Parameters (Session):
par1 = 12 ; par2 = Triple ; par3 = multiplicative ;
Parameters (R input):
par1 = 12 ; par2 = Triple ; par3 = multiplicative ;
R code (references can be found in the software module):
par1 <- as.numeric(par1)
if (par2 == 'Single') K <- 1
if (par2 == 'Double') K <- 2
if (par2 == 'Triple') K <- par1
nx <- length(x)
nxmK <- nx - K
x <- ts(x, frequency = par1)
if (par2 == 'Single') fit <- HoltWinters(x, gamma=F, beta=F)
if (par2 == 'Double') fit <- HoltWinters(x, gamma=F)
if (par2 == 'Triple') fit <- HoltWinters(x, seasonal=par3)
fit
myresid <- x - fit$fitted[,'xhat']
bitmap(file='test1.png')
op <- par(mfrow=c(2,1))
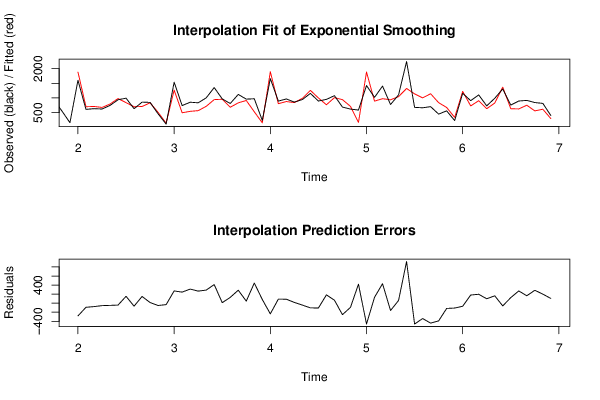
plot(fit,ylab='Observed (black) / Fitted (red)',main='Interpolation Fit of Exponential Smoothing')
plot(myresid,ylab='Residuals',main='Interpolation Prediction Errors')
par(op)
dev.off()
bitmap(file='test2.png')
p <- predict(fit, par1, prediction.interval=TRUE)
np <- length(p[,1])
plot(fit,p,ylab='Observed (black) / Fitted (red)',main='Extrapolation Fit of Exponential Smoothing')
dev.off()
bitmap(file='test3.png')
op <- par(mfrow = c(2,2))
acf(as.numeric(myresid),lag.max = nx/2,main='Residual ACF')
spectrum(myresid,main='Residals Periodogram')
cpgram(myresid,main='Residal Cumulative Periodogram')
qqnorm(myresid,main='Residual Normal QQ Plot')
qqline(myresid)
par(op)
dev.off()
load(file='createtable')
a<-table.start()
a<-table.row.start(a)
a<-table.element(a,'Estimated Parameters of Exponential Smoothing',2,TRUE)
a<-table.row.end(a)
a<-table.row.start(a)
a<-table.element(a,'Parameter',header=TRUE)
a<-table.element(a,'Value',header=TRUE)
a<-table.row.end(a)
a<-table.row.start(a)
a<-table.element(a,'alpha',header=TRUE)
a<-table.element(a,fit$alpha)
a<-table.row.end(a)
a<-table.row.start(a)
a<-table.element(a,'beta',header=TRUE)
a<-table.element(a,fit$beta)
a<-table.row.end(a)
a<-table.row.start(a)
a<-table.element(a,'gamma',header=TRUE)
a<-table.element(a,fit$gamma)
a<-table.row.end(a)
a<-table.end(a)
table.save(a,file='mytable.tab')
a<-table.start()
a<-table.row.start(a)
a<-table.element(a,'Interpolation Forecasts of Exponential Smoothing',4,TRUE)
a<-table.row.end(a)
a<-table.row.start(a)
a<-table.element(a,'t',header=TRUE)
a<-table.element(a,'Observed',header=TRUE)
a<-table.element(a,'Fitted',header=TRUE)
a<-table.element(a,'Residuals',header=TRUE)
a<-table.row.end(a)
for (i in 1:nxmK) {
a<-table.row.start(a)
a<-table.element(a,i+K,header=TRUE)
a<-table.element(a,x[i+K])
a<-table.element(a,fit$fitted[i,'xhat'])
a<-table.element(a,myresid[i])
a<-table.row.end(a)
}
a<-table.end(a)
table.save(a,file='mytable1.tab')
a<-table.start()
a<-table.row.start(a)
a<-table.element(a,'Extrapolation Forecasts of Exponential Smoothing',4,TRUE)
a<-table.row.end(a)
a<-table.row.start(a)
a<-table.element(a,'t',header=TRUE)
a<-table.element(a,'Forecast',header=TRUE)
a<-table.element(a,'95% Lower Bound',header=TRUE)
a<-table.element(a,'95% Upper Bound',header=TRUE)
a<-table.row.end(a)
for (i in 1:np) {
a<-table.row.start(a)
a<-table.element(a,nx+i,header=TRUE)
a<-table.element(a,p[i,'fit'])
a<-table.element(a,p[i,'lwr'])
a<-table.element(a,p[i,'upr'])
a<-table.row.end(a)
}
a<-table.end(a)
table.save(a,file='mytable2.tab')