Free Statistics

of Irreproducible Research!

Author's title

Author*Unverified author*
R Software Modulerwasp_autocorrelation.wasp
Title produced by software(Partial) Autocorrelation Function
Date of computationWed, 15 Oct 2014 14:20:46 +0100
Cite this page as followsStatistical Computations at FreeStatistics.org, Office for Research Development and Education, URL https://freestatistics.org/blog/index.php?v=date/2014/Oct/15/t14133792902y9mn9dizysm7i0.htm/, Retrieved Tue, 14 May 2024 01:19:24 +0000
Statistical Computations at FreeStatistics.org, Office for Research Development and Education, URL https://freestatistics.org/blog/index.php?pk=241401, Retrieved Tue, 14 May 2024 01:19:24 +0000
QR Codes:

Original text written by user:
IsPrivate?No (this computation is public)
User-defined keywords
Estimated Impact48
Family? (F = Feedback message, R = changed R code, M = changed R Module, P = changed Parameters, D = changed Data)
-       [(Partial) Autocorrelation Function] [] [2014-10-15 13:20:46] [e05db0df8788e4fa845cdc810f8bbe4c] [Current]
Feedback Forum

Post a new message
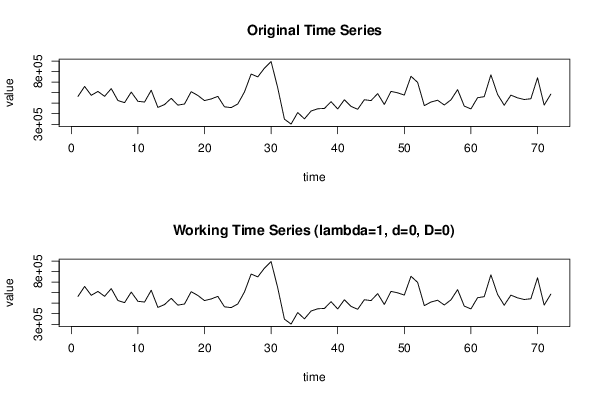
Dataseries X:
564410
658506
574787
611567
565210
638288
524970
505151
605350
517957
510879
622942
459903
486911
545974
481494
492324
609265
573243
524622
540071
564556
465319
458048
492603
606596
776475
749810
832426
895273
643875
348031
301771
411429
350941
425245
447041
449723
514318
445044
532552
469484
442289
532681
524463
590857
487590
612157
598030
577042
755394
697253
476835
510995
527816
482667
531528
628748
472131
445430
551715
561949
769474
583410
480271
576444
550457
534892
541769
741041
482062
586176


Summary of computational transaction
Raw Inputview raw input (R code)
Raw Outputview raw output of R engine
Computing time1 seconds
R Server'Sir Ronald Aylmer Fisher' @ fisher.wessa.net

\begin{tabular}{lllllllll}
\hline
Summary of computational transaction \tabularnewline
Raw Input & view raw input (R code)  \tabularnewline
Raw Output & view raw output of R engine  \tabularnewline
Computing time & 1 seconds \tabularnewline
R Server & 'Sir Ronald Aylmer Fisher' @ fisher.wessa.net \tabularnewline
\hline
\end{tabular}
%Source: https://freestatistics.org/blog/index.php?pk=241401&T=0

[TABLE]
[ROW][C]Summary of computational transaction[/C][/ROW]
[ROW][C]Raw Input[/C][C]view raw input (R code) [/C][/ROW]
[ROW][C]Raw Output[/C][C]view raw output of R engine [/C][/ROW]
[ROW][C]Computing time[/C][C]1 seconds[/C][/ROW]
[ROW][C]R Server[/C][C]'Sir Ronald Aylmer Fisher' @ fisher.wessa.net[/C][/ROW]
[/TABLE]
Source: https://freestatistics.org/blog/index.php?pk=241401&T=0

Globally Unique Identifier (entire table): ba.freestatistics.org/blog/index.php?pk=241401&T=0

As an alternative you can also use a QR Code:  

The GUIDs for individual cells are displayed in the table below:

Summary of computational transaction
Raw Inputview raw input (R code)
Raw Outputview raw output of R engine
Computing time1 seconds
R Server'Sir Ronald Aylmer Fisher' @ fisher.wessa.net


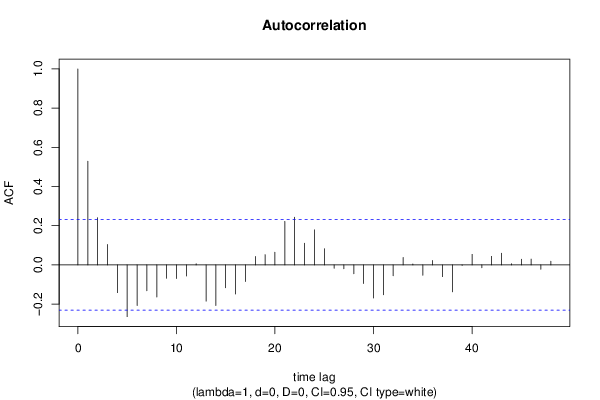
Autocorrelation Function
Time lag kACF(k)T-STATP-value
10.5292764.49111.3e-05
20.240852.04370.022322
30.1040930.88330.190017
4-0.141652-1.2020.116659
5-0.264087-2.24090.01406
6-0.207096-1.75730.041561
7-0.132332-1.12290.132611
8-0.164069-1.39220.084078
9-0.067808-0.57540.283416
10-0.069422-0.58910.278831
11-0.057072-0.48430.314832
120.0056540.0480.480934
13-0.184786-1.5680.060637
14-0.207285-1.75890.041424
15-0.116625-0.98960.162843
16-0.148393-1.25920.106021
17-0.084804-0.71960.237055
180.0431650.36630.357621
190.0523190.44390.329209
200.064220.54490.293745
210.2220161.88390.03181
220.242892.0610.021458
230.1107050.93940.175343
240.1789491.51840.066642
250.0823830.6990.24339
26-0.017199-0.14590.442189
27-0.02001-0.16980.432824
28-0.045247-0.38390.351081
29-0.095013-0.80620.211387
30-0.169385-1.43730.077485
31-0.152769-1.29630.099507
32-0.055628-0.4720.319171
330.0381710.32390.373481
340.0042760.03630.485577
35-0.052463-0.44520.328769
360.0223490.18960.425064
37-0.059925-0.50850.306336
38-0.137507-1.16680.123573
39-0.002625-0.02230.491147
400.0539780.4580.324158
41-0.014199-0.12050.45222
420.0435710.36970.35634
430.0594570.50450.307722
440.0060050.0510.479753
450.029210.24790.402477
460.0294620.250.401652
47-0.022071-0.18730.425985
480.0190.16120.436184

\begin{tabular}{lllllllll}
\hline
Autocorrelation Function \tabularnewline
Time lag k & ACF(k) & T-STAT & P-value \tabularnewline
1 & 0.529276 & 4.4911 & 1.3e-05 \tabularnewline
2 & 0.24085 & 2.0437 & 0.022322 \tabularnewline
3 & 0.104093 & 0.8833 & 0.190017 \tabularnewline
4 & -0.141652 & -1.202 & 0.116659 \tabularnewline
5 & -0.264087 & -2.2409 & 0.01406 \tabularnewline
6 & -0.207096 & -1.7573 & 0.041561 \tabularnewline
7 & -0.132332 & -1.1229 & 0.132611 \tabularnewline
8 & -0.164069 & -1.3922 & 0.084078 \tabularnewline
9 & -0.067808 & -0.5754 & 0.283416 \tabularnewline
10 & -0.069422 & -0.5891 & 0.278831 \tabularnewline
11 & -0.057072 & -0.4843 & 0.314832 \tabularnewline
12 & 0.005654 & 0.048 & 0.480934 \tabularnewline
13 & -0.184786 & -1.568 & 0.060637 \tabularnewline
14 & -0.207285 & -1.7589 & 0.041424 \tabularnewline
15 & -0.116625 & -0.9896 & 0.162843 \tabularnewline
16 & -0.148393 & -1.2592 & 0.106021 \tabularnewline
17 & -0.084804 & -0.7196 & 0.237055 \tabularnewline
18 & 0.043165 & 0.3663 & 0.357621 \tabularnewline
19 & 0.052319 & 0.4439 & 0.329209 \tabularnewline
20 & 0.06422 & 0.5449 & 0.293745 \tabularnewline
21 & 0.222016 & 1.8839 & 0.03181 \tabularnewline
22 & 0.24289 & 2.061 & 0.021458 \tabularnewline
23 & 0.110705 & 0.9394 & 0.175343 \tabularnewline
24 & 0.178949 & 1.5184 & 0.066642 \tabularnewline
25 & 0.082383 & 0.699 & 0.24339 \tabularnewline
26 & -0.017199 & -0.1459 & 0.442189 \tabularnewline
27 & -0.02001 & -0.1698 & 0.432824 \tabularnewline
28 & -0.045247 & -0.3839 & 0.351081 \tabularnewline
29 & -0.095013 & -0.8062 & 0.211387 \tabularnewline
30 & -0.169385 & -1.4373 & 0.077485 \tabularnewline
31 & -0.152769 & -1.2963 & 0.099507 \tabularnewline
32 & -0.055628 & -0.472 & 0.319171 \tabularnewline
33 & 0.038171 & 0.3239 & 0.373481 \tabularnewline
34 & 0.004276 & 0.0363 & 0.485577 \tabularnewline
35 & -0.052463 & -0.4452 & 0.328769 \tabularnewline
36 & 0.022349 & 0.1896 & 0.425064 \tabularnewline
37 & -0.059925 & -0.5085 & 0.306336 \tabularnewline
38 & -0.137507 & -1.1668 & 0.123573 \tabularnewline
39 & -0.002625 & -0.0223 & 0.491147 \tabularnewline
40 & 0.053978 & 0.458 & 0.324158 \tabularnewline
41 & -0.014199 & -0.1205 & 0.45222 \tabularnewline
42 & 0.043571 & 0.3697 & 0.35634 \tabularnewline
43 & 0.059457 & 0.5045 & 0.307722 \tabularnewline
44 & 0.006005 & 0.051 & 0.479753 \tabularnewline
45 & 0.02921 & 0.2479 & 0.402477 \tabularnewline
46 & 0.029462 & 0.25 & 0.401652 \tabularnewline
47 & -0.022071 & -0.1873 & 0.425985 \tabularnewline
48 & 0.019 & 0.1612 & 0.436184 \tabularnewline
\hline
\end{tabular}
%Source: https://freestatistics.org/blog/index.php?pk=241401&T=1

[TABLE]
[ROW][C]Autocorrelation Function[/C][/ROW]
[ROW][C]Time lag k[/C][C]ACF(k)[/C][C]T-STAT[/C][C]P-value[/C][/ROW]
[ROW][C]1[/C][C]0.529276[/C][C]4.4911[/C][C]1.3e-05[/C][/ROW]
[ROW][C]2[/C][C]0.24085[/C][C]2.0437[/C][C]0.022322[/C][/ROW]
[ROW][C]3[/C][C]0.104093[/C][C]0.8833[/C][C]0.190017[/C][/ROW]
[ROW][C]4[/C][C]-0.141652[/C][C]-1.202[/C][C]0.116659[/C][/ROW]
[ROW][C]5[/C][C]-0.264087[/C][C]-2.2409[/C][C]0.01406[/C][/ROW]
[ROW][C]6[/C][C]-0.207096[/C][C]-1.7573[/C][C]0.041561[/C][/ROW]
[ROW][C]7[/C][C]-0.132332[/C][C]-1.1229[/C][C]0.132611[/C][/ROW]
[ROW][C]8[/C][C]-0.164069[/C][C]-1.3922[/C][C]0.084078[/C][/ROW]
[ROW][C]9[/C][C]-0.067808[/C][C]-0.5754[/C][C]0.283416[/C][/ROW]
[ROW][C]10[/C][C]-0.069422[/C][C]-0.5891[/C][C]0.278831[/C][/ROW]
[ROW][C]11[/C][C]-0.057072[/C][C]-0.4843[/C][C]0.314832[/C][/ROW]
[ROW][C]12[/C][C]0.005654[/C][C]0.048[/C][C]0.480934[/C][/ROW]
[ROW][C]13[/C][C]-0.184786[/C][C]-1.568[/C][C]0.060637[/C][/ROW]
[ROW][C]14[/C][C]-0.207285[/C][C]-1.7589[/C][C]0.041424[/C][/ROW]
[ROW][C]15[/C][C]-0.116625[/C][C]-0.9896[/C][C]0.162843[/C][/ROW]
[ROW][C]16[/C][C]-0.148393[/C][C]-1.2592[/C][C]0.106021[/C][/ROW]
[ROW][C]17[/C][C]-0.084804[/C][C]-0.7196[/C][C]0.237055[/C][/ROW]
[ROW][C]18[/C][C]0.043165[/C][C]0.3663[/C][C]0.357621[/C][/ROW]
[ROW][C]19[/C][C]0.052319[/C][C]0.4439[/C][C]0.329209[/C][/ROW]
[ROW][C]20[/C][C]0.06422[/C][C]0.5449[/C][C]0.293745[/C][/ROW]
[ROW][C]21[/C][C]0.222016[/C][C]1.8839[/C][C]0.03181[/C][/ROW]
[ROW][C]22[/C][C]0.24289[/C][C]2.061[/C][C]0.021458[/C][/ROW]
[ROW][C]23[/C][C]0.110705[/C][C]0.9394[/C][C]0.175343[/C][/ROW]
[ROW][C]24[/C][C]0.178949[/C][C]1.5184[/C][C]0.066642[/C][/ROW]
[ROW][C]25[/C][C]0.082383[/C][C]0.699[/C][C]0.24339[/C][/ROW]
[ROW][C]26[/C][C]-0.017199[/C][C]-0.1459[/C][C]0.442189[/C][/ROW]
[ROW][C]27[/C][C]-0.02001[/C][C]-0.1698[/C][C]0.432824[/C][/ROW]
[ROW][C]28[/C][C]-0.045247[/C][C]-0.3839[/C][C]0.351081[/C][/ROW]
[ROW][C]29[/C][C]-0.095013[/C][C]-0.8062[/C][C]0.211387[/C][/ROW]
[ROW][C]30[/C][C]-0.169385[/C][C]-1.4373[/C][C]0.077485[/C][/ROW]
[ROW][C]31[/C][C]-0.152769[/C][C]-1.2963[/C][C]0.099507[/C][/ROW]
[ROW][C]32[/C][C]-0.055628[/C][C]-0.472[/C][C]0.319171[/C][/ROW]
[ROW][C]33[/C][C]0.038171[/C][C]0.3239[/C][C]0.373481[/C][/ROW]
[ROW][C]34[/C][C]0.004276[/C][C]0.0363[/C][C]0.485577[/C][/ROW]
[ROW][C]35[/C][C]-0.052463[/C][C]-0.4452[/C][C]0.328769[/C][/ROW]
[ROW][C]36[/C][C]0.022349[/C][C]0.1896[/C][C]0.425064[/C][/ROW]
[ROW][C]37[/C][C]-0.059925[/C][C]-0.5085[/C][C]0.306336[/C][/ROW]
[ROW][C]38[/C][C]-0.137507[/C][C]-1.1668[/C][C]0.123573[/C][/ROW]
[ROW][C]39[/C][C]-0.002625[/C][C]-0.0223[/C][C]0.491147[/C][/ROW]
[ROW][C]40[/C][C]0.053978[/C][C]0.458[/C][C]0.324158[/C][/ROW]
[ROW][C]41[/C][C]-0.014199[/C][C]-0.1205[/C][C]0.45222[/C][/ROW]
[ROW][C]42[/C][C]0.043571[/C][C]0.3697[/C][C]0.35634[/C][/ROW]
[ROW][C]43[/C][C]0.059457[/C][C]0.5045[/C][C]0.307722[/C][/ROW]
[ROW][C]44[/C][C]0.006005[/C][C]0.051[/C][C]0.479753[/C][/ROW]
[ROW][C]45[/C][C]0.02921[/C][C]0.2479[/C][C]0.402477[/C][/ROW]
[ROW][C]46[/C][C]0.029462[/C][C]0.25[/C][C]0.401652[/C][/ROW]
[ROW][C]47[/C][C]-0.022071[/C][C]-0.1873[/C][C]0.425985[/C][/ROW]
[ROW][C]48[/C][C]0.019[/C][C]0.1612[/C][C]0.436184[/C][/ROW]
[/TABLE]
Source: https://freestatistics.org/blog/index.php?pk=241401&T=1

Globally Unique Identifier (entire table): ba.freestatistics.org/blog/index.php?pk=241401&T=1

As an alternative you can also use a QR Code:  

The GUIDs for individual cells are displayed in the table below:

Autocorrelation Function
Time lag kACF(k)T-STATP-value
10.5292764.49111.3e-05
20.240852.04370.022322
30.1040930.88330.190017
4-0.141652-1.2020.116659
5-0.264087-2.24090.01406
6-0.207096-1.75730.041561
7-0.132332-1.12290.132611
8-0.164069-1.39220.084078
9-0.067808-0.57540.283416
10-0.069422-0.58910.278831
11-0.057072-0.48430.314832
120.0056540.0480.480934
13-0.184786-1.5680.060637
14-0.207285-1.75890.041424
15-0.116625-0.98960.162843
16-0.148393-1.25920.106021
17-0.084804-0.71960.237055
180.0431650.36630.357621
190.0523190.44390.329209
200.064220.54490.293745
210.2220161.88390.03181
220.242892.0610.021458
230.1107050.93940.175343
240.1789491.51840.066642
250.0823830.6990.24339
26-0.017199-0.14590.442189
27-0.02001-0.16980.432824
28-0.045247-0.38390.351081
29-0.095013-0.80620.211387
30-0.169385-1.43730.077485
31-0.152769-1.29630.099507
32-0.055628-0.4720.319171
330.0381710.32390.373481
340.0042760.03630.485577
35-0.052463-0.44520.328769
360.0223490.18960.425064
37-0.059925-0.50850.306336
38-0.137507-1.16680.123573
39-0.002625-0.02230.491147
400.0539780.4580.324158
41-0.014199-0.12050.45222
420.0435710.36970.35634
430.0594570.50450.307722
440.0060050.0510.479753
450.029210.24790.402477
460.0294620.250.401652
47-0.022071-0.18730.425985
480.0190.16120.436184


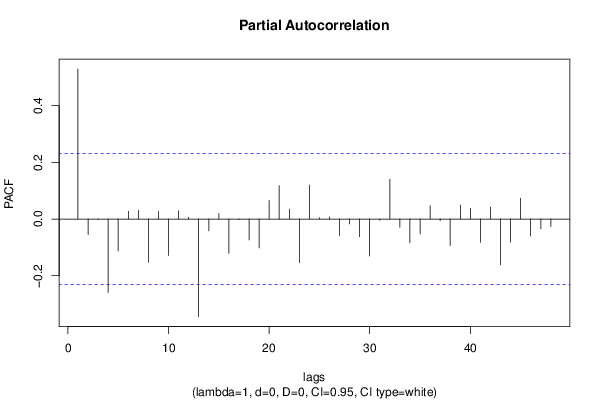
Partial Autocorrelation Function
Time lag kPACF(k)T-STATP-value
10.5292764.49111.3e-05
2-0.054569-0.4630.322367
3-0.00203-0.01720.493154
4-0.258871-2.19660.015635
5-0.112603-0.95550.17127
60.0271830.23070.409118
70.0312530.26520.39581
8-0.152226-1.29170.1003
90.0263670.22370.411799
10-0.12843-1.08980.139725
110.0293790.24930.401925
120.0060470.05130.479611
13-0.344303-2.92150.002325
14-0.041692-0.35380.362272
150.019390.16450.434886
16-0.120798-1.0250.154397
17-0.002191-0.01860.49261
18-0.073465-0.62340.267507
19-0.101796-0.86380.195293
200.0656320.55690.289659
210.1177310.9990.160574
220.0343090.29110.385897
23-0.154052-1.30720.097656
240.1196821.01550.156626
250.00450.03820.484822
260.0068930.05850.47676
27-0.059273-0.50290.308269
28-0.01718-0.14580.442251
29-0.062278-0.52840.299406
30-0.130672-1.10880.135605
31-0.004504-0.03820.484811
320.1403321.19080.11883
33-0.029067-0.24660.402945
34-0.08396-0.71240.239253
35-0.05172-0.43890.331039
360.0473090.40140.344646
37-0.005967-0.05060.479879
38-0.093194-0.79080.215835
390.0495060.42010.337843
400.0381820.3240.373445
41-0.082311-0.69840.243578
420.0417510.35430.362085
43-0.161482-1.37020.087438
44-0.081385-0.69060.246026
450.0732130.62120.268204
46-0.0594-0.5040.307892
47-0.034099-0.28930.386578
48-0.026148-0.22190.41252

\begin{tabular}{lllllllll}
\hline
Partial Autocorrelation Function \tabularnewline
Time lag k & PACF(k) & T-STAT & P-value \tabularnewline
1 & 0.529276 & 4.4911 & 1.3e-05 \tabularnewline
2 & -0.054569 & -0.463 & 0.322367 \tabularnewline
3 & -0.00203 & -0.0172 & 0.493154 \tabularnewline
4 & -0.258871 & -2.1966 & 0.015635 \tabularnewline
5 & -0.112603 & -0.9555 & 0.17127 \tabularnewline
6 & 0.027183 & 0.2307 & 0.409118 \tabularnewline
7 & 0.031253 & 0.2652 & 0.39581 \tabularnewline
8 & -0.152226 & -1.2917 & 0.1003 \tabularnewline
9 & 0.026367 & 0.2237 & 0.411799 \tabularnewline
10 & -0.12843 & -1.0898 & 0.139725 \tabularnewline
11 & 0.029379 & 0.2493 & 0.401925 \tabularnewline
12 & 0.006047 & 0.0513 & 0.479611 \tabularnewline
13 & -0.344303 & -2.9215 & 0.002325 \tabularnewline
14 & -0.041692 & -0.3538 & 0.362272 \tabularnewline
15 & 0.01939 & 0.1645 & 0.434886 \tabularnewline
16 & -0.120798 & -1.025 & 0.154397 \tabularnewline
17 & -0.002191 & -0.0186 & 0.49261 \tabularnewline
18 & -0.073465 & -0.6234 & 0.267507 \tabularnewline
19 & -0.101796 & -0.8638 & 0.195293 \tabularnewline
20 & 0.065632 & 0.5569 & 0.289659 \tabularnewline
21 & 0.117731 & 0.999 & 0.160574 \tabularnewline
22 & 0.034309 & 0.2911 & 0.385897 \tabularnewline
23 & -0.154052 & -1.3072 & 0.097656 \tabularnewline
24 & 0.119682 & 1.0155 & 0.156626 \tabularnewline
25 & 0.0045 & 0.0382 & 0.484822 \tabularnewline
26 & 0.006893 & 0.0585 & 0.47676 \tabularnewline
27 & -0.059273 & -0.5029 & 0.308269 \tabularnewline
28 & -0.01718 & -0.1458 & 0.442251 \tabularnewline
29 & -0.062278 & -0.5284 & 0.299406 \tabularnewline
30 & -0.130672 & -1.1088 & 0.135605 \tabularnewline
31 & -0.004504 & -0.0382 & 0.484811 \tabularnewline
32 & 0.140332 & 1.1908 & 0.11883 \tabularnewline
33 & -0.029067 & -0.2466 & 0.402945 \tabularnewline
34 & -0.08396 & -0.7124 & 0.239253 \tabularnewline
35 & -0.05172 & -0.4389 & 0.331039 \tabularnewline
36 & 0.047309 & 0.4014 & 0.344646 \tabularnewline
37 & -0.005967 & -0.0506 & 0.479879 \tabularnewline
38 & -0.093194 & -0.7908 & 0.215835 \tabularnewline
39 & 0.049506 & 0.4201 & 0.337843 \tabularnewline
40 & 0.038182 & 0.324 & 0.373445 \tabularnewline
41 & -0.082311 & -0.6984 & 0.243578 \tabularnewline
42 & 0.041751 & 0.3543 & 0.362085 \tabularnewline
43 & -0.161482 & -1.3702 & 0.087438 \tabularnewline
44 & -0.081385 & -0.6906 & 0.246026 \tabularnewline
45 & 0.073213 & 0.6212 & 0.268204 \tabularnewline
46 & -0.0594 & -0.504 & 0.307892 \tabularnewline
47 & -0.034099 & -0.2893 & 0.386578 \tabularnewline
48 & -0.026148 & -0.2219 & 0.41252 \tabularnewline
\hline
\end{tabular}
%Source: https://freestatistics.org/blog/index.php?pk=241401&T=2

[TABLE]
[ROW][C]Partial Autocorrelation Function[/C][/ROW]
[ROW][C]Time lag k[/C][C]PACF(k)[/C][C]T-STAT[/C][C]P-value[/C][/ROW]
[ROW][C]1[/C][C]0.529276[/C][C]4.4911[/C][C]1.3e-05[/C][/ROW]
[ROW][C]2[/C][C]-0.054569[/C][C]-0.463[/C][C]0.322367[/C][/ROW]
[ROW][C]3[/C][C]-0.00203[/C][C]-0.0172[/C][C]0.493154[/C][/ROW]
[ROW][C]4[/C][C]-0.258871[/C][C]-2.1966[/C][C]0.015635[/C][/ROW]
[ROW][C]5[/C][C]-0.112603[/C][C]-0.9555[/C][C]0.17127[/C][/ROW]
[ROW][C]6[/C][C]0.027183[/C][C]0.2307[/C][C]0.409118[/C][/ROW]
[ROW][C]7[/C][C]0.031253[/C][C]0.2652[/C][C]0.39581[/C][/ROW]
[ROW][C]8[/C][C]-0.152226[/C][C]-1.2917[/C][C]0.1003[/C][/ROW]
[ROW][C]9[/C][C]0.026367[/C][C]0.2237[/C][C]0.411799[/C][/ROW]
[ROW][C]10[/C][C]-0.12843[/C][C]-1.0898[/C][C]0.139725[/C][/ROW]
[ROW][C]11[/C][C]0.029379[/C][C]0.2493[/C][C]0.401925[/C][/ROW]
[ROW][C]12[/C][C]0.006047[/C][C]0.0513[/C][C]0.479611[/C][/ROW]
[ROW][C]13[/C][C]-0.344303[/C][C]-2.9215[/C][C]0.002325[/C][/ROW]
[ROW][C]14[/C][C]-0.041692[/C][C]-0.3538[/C][C]0.362272[/C][/ROW]
[ROW][C]15[/C][C]0.01939[/C][C]0.1645[/C][C]0.434886[/C][/ROW]
[ROW][C]16[/C][C]-0.120798[/C][C]-1.025[/C][C]0.154397[/C][/ROW]
[ROW][C]17[/C][C]-0.002191[/C][C]-0.0186[/C][C]0.49261[/C][/ROW]
[ROW][C]18[/C][C]-0.073465[/C][C]-0.6234[/C][C]0.267507[/C][/ROW]
[ROW][C]19[/C][C]-0.101796[/C][C]-0.8638[/C][C]0.195293[/C][/ROW]
[ROW][C]20[/C][C]0.065632[/C][C]0.5569[/C][C]0.289659[/C][/ROW]
[ROW][C]21[/C][C]0.117731[/C][C]0.999[/C][C]0.160574[/C][/ROW]
[ROW][C]22[/C][C]0.034309[/C][C]0.2911[/C][C]0.385897[/C][/ROW]
[ROW][C]23[/C][C]-0.154052[/C][C]-1.3072[/C][C]0.097656[/C][/ROW]
[ROW][C]24[/C][C]0.119682[/C][C]1.0155[/C][C]0.156626[/C][/ROW]
[ROW][C]25[/C][C]0.0045[/C][C]0.0382[/C][C]0.484822[/C][/ROW]
[ROW][C]26[/C][C]0.006893[/C][C]0.0585[/C][C]0.47676[/C][/ROW]
[ROW][C]27[/C][C]-0.059273[/C][C]-0.5029[/C][C]0.308269[/C][/ROW]
[ROW][C]28[/C][C]-0.01718[/C][C]-0.1458[/C][C]0.442251[/C][/ROW]
[ROW][C]29[/C][C]-0.062278[/C][C]-0.5284[/C][C]0.299406[/C][/ROW]
[ROW][C]30[/C][C]-0.130672[/C][C]-1.1088[/C][C]0.135605[/C][/ROW]
[ROW][C]31[/C][C]-0.004504[/C][C]-0.0382[/C][C]0.484811[/C][/ROW]
[ROW][C]32[/C][C]0.140332[/C][C]1.1908[/C][C]0.11883[/C][/ROW]
[ROW][C]33[/C][C]-0.029067[/C][C]-0.2466[/C][C]0.402945[/C][/ROW]
[ROW][C]34[/C][C]-0.08396[/C][C]-0.7124[/C][C]0.239253[/C][/ROW]
[ROW][C]35[/C][C]-0.05172[/C][C]-0.4389[/C][C]0.331039[/C][/ROW]
[ROW][C]36[/C][C]0.047309[/C][C]0.4014[/C][C]0.344646[/C][/ROW]
[ROW][C]37[/C][C]-0.005967[/C][C]-0.0506[/C][C]0.479879[/C][/ROW]
[ROW][C]38[/C][C]-0.093194[/C][C]-0.7908[/C][C]0.215835[/C][/ROW]
[ROW][C]39[/C][C]0.049506[/C][C]0.4201[/C][C]0.337843[/C][/ROW]
[ROW][C]40[/C][C]0.038182[/C][C]0.324[/C][C]0.373445[/C][/ROW]
[ROW][C]41[/C][C]-0.082311[/C][C]-0.6984[/C][C]0.243578[/C][/ROW]
[ROW][C]42[/C][C]0.041751[/C][C]0.3543[/C][C]0.362085[/C][/ROW]
[ROW][C]43[/C][C]-0.161482[/C][C]-1.3702[/C][C]0.087438[/C][/ROW]
[ROW][C]44[/C][C]-0.081385[/C][C]-0.6906[/C][C]0.246026[/C][/ROW]
[ROW][C]45[/C][C]0.073213[/C][C]0.6212[/C][C]0.268204[/C][/ROW]
[ROW][C]46[/C][C]-0.0594[/C][C]-0.504[/C][C]0.307892[/C][/ROW]
[ROW][C]47[/C][C]-0.034099[/C][C]-0.2893[/C][C]0.386578[/C][/ROW]
[ROW][C]48[/C][C]-0.026148[/C][C]-0.2219[/C][C]0.41252[/C][/ROW]
[/TABLE]
Source: https://freestatistics.org/blog/index.php?pk=241401&T=2

Globally Unique Identifier (entire table): ba.freestatistics.org/blog/index.php?pk=241401&T=2

As an alternative you can also use a QR Code:  

The GUIDs for individual cells are displayed in the table below:

Partial Autocorrelation Function
Time lag kPACF(k)T-STATP-value
10.5292764.49111.3e-05
2-0.054569-0.4630.322367
3-0.00203-0.01720.493154
4-0.258871-2.19660.015635
5-0.112603-0.95550.17127
60.0271830.23070.409118
70.0312530.26520.39581
8-0.152226-1.29170.1003
90.0263670.22370.411799
10-0.12843-1.08980.139725
110.0293790.24930.401925
120.0060470.05130.479611
13-0.344303-2.92150.002325
14-0.041692-0.35380.362272
150.019390.16450.434886
16-0.120798-1.0250.154397
17-0.002191-0.01860.49261
18-0.073465-0.62340.267507
19-0.101796-0.86380.195293
200.0656320.55690.289659
210.1177310.9990.160574
220.0343090.29110.385897
23-0.154052-1.30720.097656
240.1196821.01550.156626
250.00450.03820.484822
260.0068930.05850.47676
27-0.059273-0.50290.308269
28-0.01718-0.14580.442251
29-0.062278-0.52840.299406
30-0.130672-1.10880.135605
31-0.004504-0.03820.484811
320.1403321.19080.11883
33-0.029067-0.24660.402945
34-0.08396-0.71240.239253
35-0.05172-0.43890.331039
360.0473090.40140.344646
37-0.005967-0.05060.479879
38-0.093194-0.79080.215835
390.0495060.42010.337843
400.0381820.3240.373445
41-0.082311-0.69840.243578
420.0417510.35430.362085
43-0.161482-1.37020.087438
44-0.081385-0.69060.246026
450.0732130.62120.268204
46-0.0594-0.5040.307892
47-0.034099-0.28930.386578
48-0.026148-0.22190.41252


Parameters (Session):
par1 = 48 ; par2 = 1 ; par3 = 0 ; par4 = 0 ; par5 = 12 ; par6 = White Noise ; par7 = 0.95 ;
Parameters (R input):
par1 = 48 ; par2 = 1 ; par3 = 0 ; par4 = 0 ; par5 = 12 ; par6 = White Noise ; par7 = 0.95 ; par8 = ;
R code (references can be found in the software module):
if (par1 == 'Default') {
par1 = 10*log10(length(x))
} else {
par1 <- as.numeric(par1)
}
par2 <- as.numeric(par2)
par3 <- as.numeric(par3)
par4 <- as.numeric(par4)
par5 <- as.numeric(par5)
if (par6 == 'White Noise') par6 <- 'white' else par6 <- 'ma'
par7 <- as.numeric(par7)
if (par8 != '') par8 <- as.numeric(par8)
ox <- x
if (par8 == '') {
if (par2 == 0) {
x <- log(x)
} else {
x <- (x ^ par2 - 1) / par2
}
} else {
x <- log(x,base=par8)
}
if (par3 > 0) x <- diff(x,lag=1,difference=par3)
if (par4 > 0) x <- diff(x,lag=par5,difference=par4)
bitmap(file='picts.png')
op <- par(mfrow=c(2,1))
plot(ox,type='l',main='Original Time Series',xlab='time',ylab='value')
if (par8=='') {
mytitle <- paste('Working Time Series (lambda=',par2,', d=',par3,', D=',par4,')',sep='')
mysub <- paste('(lambda=',par2,', d=',par3,', D=',par4,', CI=', par7, ', CI type=',par6,')',sep='')
} else {
mytitle <- paste('Working Time Series (base=',par8,', d=',par3,', D=',par4,')',sep='')
mysub <- paste('(base=',par8,', d=',par3,', D=',par4,', CI=', par7, ', CI type=',par6,')',sep='')
}
plot(x,type='l', main=mytitle,xlab='time',ylab='value')
par(op)
dev.off()
bitmap(file='pic1.png')
racf <- acf(x, par1, main='Autocorrelation', xlab='time lag', ylab='ACF', ci.type=par6, ci=par7, sub=mysub)
dev.off()
bitmap(file='pic2.png')
rpacf <- pacf(x,par1,main='Partial Autocorrelation',xlab='lags',ylab='PACF',sub=mysub)
dev.off()
(myacf <- c(racf$acf))
(mypacf <- c(rpacf$acf))
lengthx <- length(x)
sqrtn <- sqrt(lengthx)
load(file='createtable')
a<-table.start()
a<-table.row.start(a)
a<-table.element(a,'Autocorrelation Function',4,TRUE)
a<-table.row.end(a)
a<-table.row.start(a)
a<-table.element(a,'Time lag k',header=TRUE)
a<-table.element(a,hyperlink('basics.htm','ACF(k)','click here for more information about the Autocorrelation Function'),header=TRUE)
a<-table.element(a,'T-STAT',header=TRUE)
a<-table.element(a,'P-value',header=TRUE)
a<-table.row.end(a)
for (i in 2:(par1+1)) {
a<-table.row.start(a)
a<-table.element(a,i-1,header=TRUE)
a<-table.element(a,round(myacf[i],6))
mytstat <- myacf[i]*sqrtn
a<-table.element(a,round(mytstat,4))
a<-table.element(a,round(1-pt(abs(mytstat),lengthx),6))
a<-table.row.end(a)
}
a<-table.end(a)
table.save(a,file='mytable.tab')
a<-table.start()
a<-table.row.start(a)
a<-table.element(a,'Partial Autocorrelation Function',4,TRUE)
a<-table.row.end(a)
a<-table.row.start(a)
a<-table.element(a,'Time lag k',header=TRUE)
a<-table.element(a,hyperlink('basics.htm','PACF(k)','click here for more information about the Partial Autocorrelation Function'),header=TRUE)
a<-table.element(a,'T-STAT',header=TRUE)
a<-table.element(a,'P-value',header=TRUE)
a<-table.row.end(a)
for (i in 1:par1) {
a<-table.row.start(a)
a<-table.element(a,i,header=TRUE)
a<-table.element(a,round(mypacf[i],6))
mytstat <- mypacf[i]*sqrtn
a<-table.element(a,round(mytstat,4))
a<-table.element(a,round(1-pt(abs(mytstat),lengthx),6))
a<-table.row.end(a)
}
a<-table.end(a)
table.save(a,file='mytable1.tab')