Free Statistics

of Irreproducible Research!

Author's title

Author*Unverified author*
R Software Modulerwasp_autocorrelation.wasp
Title produced by software(Partial) Autocorrelation Function
Date of computationWed, 15 Oct 2014 09:48:54 +0100
Cite this page as followsStatistical Computations at FreeStatistics.org, Office for Research Development and Education, URL https://freestatistics.org/blog/index.php?v=date/2014/Oct/15/t14133629595ut5vg4fqyu820h.htm/, Retrieved Mon, 13 May 2024 23:03:36 +0000
Statistical Computations at FreeStatistics.org, Office for Research Development and Education, URL https://freestatistics.org/blog/index.php?pk=241037, Retrieved Mon, 13 May 2024 23:03:36 +0000
QR Codes:

Original text written by user:
IsPrivate?No (this computation is public)
User-defined keywords
Estimated Impact118
Family? (F = Feedback message, R = changed R code, M = changed R Module, P = changed Parameters, D = changed Data)
-       [(Partial) Autocorrelation Function] [] [2014-10-15 08:48:54] [959220cfe8d8b51f3b8cc01ba011fecd] [Current]
Feedback Forum

Post a new message
Dataseries X:
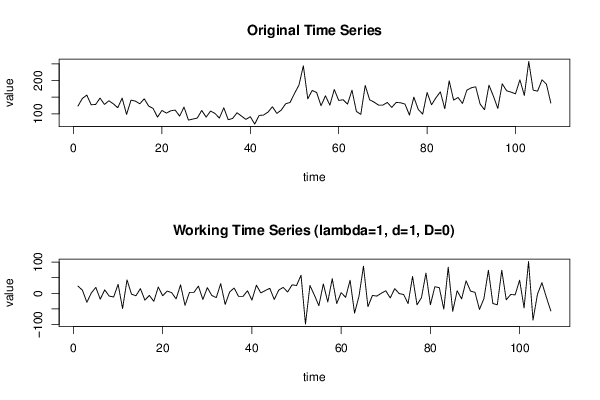
123
146
156
127
128
147
128
139
130
118
147
98
141
138
130
145
123
116
90
110
102
109
111
93
120
81
84
87
110
90
108
101
87
118
82
86
103
93
83
91
69
95
96
105
121
101
111
130
134
161
186
244
145
170
164
124
154
126
173
140
142
129
171
107
98
185
142
135
126
126
134
119
134
133
129
96
150
113
99
164
127
148
166
115
199
141
149
131
171
178
181
129
112
186
153
116
190
169
165
160
202
155
257
171
168
202
189
132


Summary of computational transaction
Raw Inputview raw input (R code)
Raw Outputview raw output of R engine
Computing time2 seconds
R Server'Gwilym Jenkins' @ jenkins.wessa.net

\begin{tabular}{lllllllll}
\hline
Summary of computational transaction \tabularnewline
Raw Input & view raw input (R code)  \tabularnewline
Raw Output & view raw output of R engine  \tabularnewline
Computing time & 2 seconds \tabularnewline
R Server & 'Gwilym Jenkins' @ jenkins.wessa.net \tabularnewline
\hline
\end{tabular}
%Source: https://freestatistics.org/blog/index.php?pk=241037&T=0

[TABLE]
[ROW][C]Summary of computational transaction[/C][/ROW]
[ROW][C]Raw Input[/C][C]view raw input (R code) [/C][/ROW]
[ROW][C]Raw Output[/C][C]view raw output of R engine [/C][/ROW]
[ROW][C]Computing time[/C][C]2 seconds[/C][/ROW]
[ROW][C]R Server[/C][C]'Gwilym Jenkins' @ jenkins.wessa.net[/C][/ROW]
[/TABLE]
Source: https://freestatistics.org/blog/index.php?pk=241037&T=0

Globally Unique Identifier (entire table): ba.freestatistics.org/blog/index.php?pk=241037&T=0

As an alternative you can also use a QR Code:  

The GUIDs for individual cells are displayed in the table below:

Summary of computational transaction
Raw Inputview raw input (R code)
Raw Outputview raw output of R engine
Computing time2 seconds
R Server'Gwilym Jenkins' @ jenkins.wessa.net


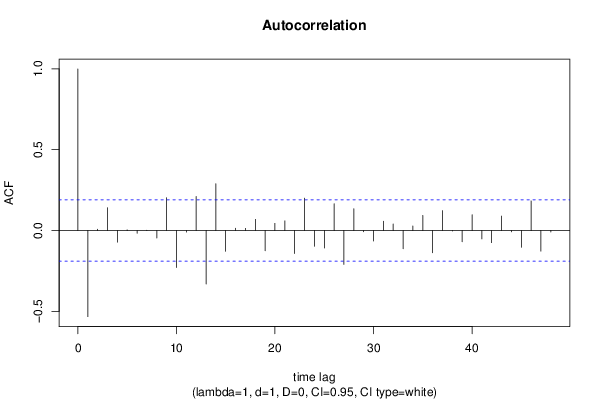
Autocorrelation Function
Time lag kACF(k)T-STATP-value
1-0.532961-5.5130
20.0084010.08690.465455
30.1405381.45370.074472
4-0.071841-0.74310.229515
50.0041740.04320.482819
6-0.016481-0.17050.432478
70.0016250.01680.493308
8-0.046608-0.48210.315353
90.2032072.1020.018951
10-0.229155-2.37040.00978
11-0.00972-0.10050.460048
120.2111752.18440.015557
13-0.331285-3.42680.000434
140.2896912.99660.001697
15-0.128031-1.32440.094103
160.0140270.14510.442453
170.0134770.13940.444695
180.0693230.71710.237443
19-0.124978-1.29280.099435
200.0441840.4570.324282
210.0599950.62060.268095
22-0.142404-1.4730.071838
230.2004142.07310.020282
24-0.097256-1.0060.158337
25-0.108099-1.11820.132996
260.1657311.71430.044681
27-0.209716-2.16930.016136
280.1349831.39630.08276
29-0.00722-0.07470.470301
30-0.064495-0.66710.253059
310.057290.59260.277345
320.0402880.41670.338852
33-0.112912-1.1680.122708
340.0281780.29150.385625
350.0936530.96880.167426
36-0.137896-1.42640.078331
370.1234371.27680.102211
38-0.003106-0.03210.487215
39-0.069596-0.71990.236575
400.0974091.00760.157959
41-0.051584-0.53360.297365
42-0.074981-0.77560.219846
430.0893870.92460.178621
44-0.008134-0.08410.466551
45-0.103041-1.06590.144443
460.1834191.89730.030242
47-0.127457-1.31840.095089
48-0.008958-0.09270.463174

\begin{tabular}{lllllllll}
\hline
Autocorrelation Function \tabularnewline
Time lag k & ACF(k) & T-STAT & P-value \tabularnewline
1 & -0.532961 & -5.513 & 0 \tabularnewline
2 & 0.008401 & 0.0869 & 0.465455 \tabularnewline
3 & 0.140538 & 1.4537 & 0.074472 \tabularnewline
4 & -0.071841 & -0.7431 & 0.229515 \tabularnewline
5 & 0.004174 & 0.0432 & 0.482819 \tabularnewline
6 & -0.016481 & -0.1705 & 0.432478 \tabularnewline
7 & 0.001625 & 0.0168 & 0.493308 \tabularnewline
8 & -0.046608 & -0.4821 & 0.315353 \tabularnewline
9 & 0.203207 & 2.102 & 0.018951 \tabularnewline
10 & -0.229155 & -2.3704 & 0.00978 \tabularnewline
11 & -0.00972 & -0.1005 & 0.460048 \tabularnewline
12 & 0.211175 & 2.1844 & 0.015557 \tabularnewline
13 & -0.331285 & -3.4268 & 0.000434 \tabularnewline
14 & 0.289691 & 2.9966 & 0.001697 \tabularnewline
15 & -0.128031 & -1.3244 & 0.094103 \tabularnewline
16 & 0.014027 & 0.1451 & 0.442453 \tabularnewline
17 & 0.013477 & 0.1394 & 0.444695 \tabularnewline
18 & 0.069323 & 0.7171 & 0.237443 \tabularnewline
19 & -0.124978 & -1.2928 & 0.099435 \tabularnewline
20 & 0.044184 & 0.457 & 0.324282 \tabularnewline
21 & 0.059995 & 0.6206 & 0.268095 \tabularnewline
22 & -0.142404 & -1.473 & 0.071838 \tabularnewline
23 & 0.200414 & 2.0731 & 0.020282 \tabularnewline
24 & -0.097256 & -1.006 & 0.158337 \tabularnewline
25 & -0.108099 & -1.1182 & 0.132996 \tabularnewline
26 & 0.165731 & 1.7143 & 0.044681 \tabularnewline
27 & -0.209716 & -2.1693 & 0.016136 \tabularnewline
28 & 0.134983 & 1.3963 & 0.08276 \tabularnewline
29 & -0.00722 & -0.0747 & 0.470301 \tabularnewline
30 & -0.064495 & -0.6671 & 0.253059 \tabularnewline
31 & 0.05729 & 0.5926 & 0.277345 \tabularnewline
32 & 0.040288 & 0.4167 & 0.338852 \tabularnewline
33 & -0.112912 & -1.168 & 0.122708 \tabularnewline
34 & 0.028178 & 0.2915 & 0.385625 \tabularnewline
35 & 0.093653 & 0.9688 & 0.167426 \tabularnewline
36 & -0.137896 & -1.4264 & 0.078331 \tabularnewline
37 & 0.123437 & 1.2768 & 0.102211 \tabularnewline
38 & -0.003106 & -0.0321 & 0.487215 \tabularnewline
39 & -0.069596 & -0.7199 & 0.236575 \tabularnewline
40 & 0.097409 & 1.0076 & 0.157959 \tabularnewline
41 & -0.051584 & -0.5336 & 0.297365 \tabularnewline
42 & -0.074981 & -0.7756 & 0.219846 \tabularnewline
43 & 0.089387 & 0.9246 & 0.178621 \tabularnewline
44 & -0.008134 & -0.0841 & 0.466551 \tabularnewline
45 & -0.103041 & -1.0659 & 0.144443 \tabularnewline
46 & 0.183419 & 1.8973 & 0.030242 \tabularnewline
47 & -0.127457 & -1.3184 & 0.095089 \tabularnewline
48 & -0.008958 & -0.0927 & 0.463174 \tabularnewline
\hline
\end{tabular}
%Source: https://freestatistics.org/blog/index.php?pk=241037&T=1

[TABLE]
[ROW][C]Autocorrelation Function[/C][/ROW]
[ROW][C]Time lag k[/C][C]ACF(k)[/C][C]T-STAT[/C][C]P-value[/C][/ROW]
[ROW][C]1[/C][C]-0.532961[/C][C]-5.513[/C][C]0[/C][/ROW]
[ROW][C]2[/C][C]0.008401[/C][C]0.0869[/C][C]0.465455[/C][/ROW]
[ROW][C]3[/C][C]0.140538[/C][C]1.4537[/C][C]0.074472[/C][/ROW]
[ROW][C]4[/C][C]-0.071841[/C][C]-0.7431[/C][C]0.229515[/C][/ROW]
[ROW][C]5[/C][C]0.004174[/C][C]0.0432[/C][C]0.482819[/C][/ROW]
[ROW][C]6[/C][C]-0.016481[/C][C]-0.1705[/C][C]0.432478[/C][/ROW]
[ROW][C]7[/C][C]0.001625[/C][C]0.0168[/C][C]0.493308[/C][/ROW]
[ROW][C]8[/C][C]-0.046608[/C][C]-0.4821[/C][C]0.315353[/C][/ROW]
[ROW][C]9[/C][C]0.203207[/C][C]2.102[/C][C]0.018951[/C][/ROW]
[ROW][C]10[/C][C]-0.229155[/C][C]-2.3704[/C][C]0.00978[/C][/ROW]
[ROW][C]11[/C][C]-0.00972[/C][C]-0.1005[/C][C]0.460048[/C][/ROW]
[ROW][C]12[/C][C]0.211175[/C][C]2.1844[/C][C]0.015557[/C][/ROW]
[ROW][C]13[/C][C]-0.331285[/C][C]-3.4268[/C][C]0.000434[/C][/ROW]
[ROW][C]14[/C][C]0.289691[/C][C]2.9966[/C][C]0.001697[/C][/ROW]
[ROW][C]15[/C][C]-0.128031[/C][C]-1.3244[/C][C]0.094103[/C][/ROW]
[ROW][C]16[/C][C]0.014027[/C][C]0.1451[/C][C]0.442453[/C][/ROW]
[ROW][C]17[/C][C]0.013477[/C][C]0.1394[/C][C]0.444695[/C][/ROW]
[ROW][C]18[/C][C]0.069323[/C][C]0.7171[/C][C]0.237443[/C][/ROW]
[ROW][C]19[/C][C]-0.124978[/C][C]-1.2928[/C][C]0.099435[/C][/ROW]
[ROW][C]20[/C][C]0.044184[/C][C]0.457[/C][C]0.324282[/C][/ROW]
[ROW][C]21[/C][C]0.059995[/C][C]0.6206[/C][C]0.268095[/C][/ROW]
[ROW][C]22[/C][C]-0.142404[/C][C]-1.473[/C][C]0.071838[/C][/ROW]
[ROW][C]23[/C][C]0.200414[/C][C]2.0731[/C][C]0.020282[/C][/ROW]
[ROW][C]24[/C][C]-0.097256[/C][C]-1.006[/C][C]0.158337[/C][/ROW]
[ROW][C]25[/C][C]-0.108099[/C][C]-1.1182[/C][C]0.132996[/C][/ROW]
[ROW][C]26[/C][C]0.165731[/C][C]1.7143[/C][C]0.044681[/C][/ROW]
[ROW][C]27[/C][C]-0.209716[/C][C]-2.1693[/C][C]0.016136[/C][/ROW]
[ROW][C]28[/C][C]0.134983[/C][C]1.3963[/C][C]0.08276[/C][/ROW]
[ROW][C]29[/C][C]-0.00722[/C][C]-0.0747[/C][C]0.470301[/C][/ROW]
[ROW][C]30[/C][C]-0.064495[/C][C]-0.6671[/C][C]0.253059[/C][/ROW]
[ROW][C]31[/C][C]0.05729[/C][C]0.5926[/C][C]0.277345[/C][/ROW]
[ROW][C]32[/C][C]0.040288[/C][C]0.4167[/C][C]0.338852[/C][/ROW]
[ROW][C]33[/C][C]-0.112912[/C][C]-1.168[/C][C]0.122708[/C][/ROW]
[ROW][C]34[/C][C]0.028178[/C][C]0.2915[/C][C]0.385625[/C][/ROW]
[ROW][C]35[/C][C]0.093653[/C][C]0.9688[/C][C]0.167426[/C][/ROW]
[ROW][C]36[/C][C]-0.137896[/C][C]-1.4264[/C][C]0.078331[/C][/ROW]
[ROW][C]37[/C][C]0.123437[/C][C]1.2768[/C][C]0.102211[/C][/ROW]
[ROW][C]38[/C][C]-0.003106[/C][C]-0.0321[/C][C]0.487215[/C][/ROW]
[ROW][C]39[/C][C]-0.069596[/C][C]-0.7199[/C][C]0.236575[/C][/ROW]
[ROW][C]40[/C][C]0.097409[/C][C]1.0076[/C][C]0.157959[/C][/ROW]
[ROW][C]41[/C][C]-0.051584[/C][C]-0.5336[/C][C]0.297365[/C][/ROW]
[ROW][C]42[/C][C]-0.074981[/C][C]-0.7756[/C][C]0.219846[/C][/ROW]
[ROW][C]43[/C][C]0.089387[/C][C]0.9246[/C][C]0.178621[/C][/ROW]
[ROW][C]44[/C][C]-0.008134[/C][C]-0.0841[/C][C]0.466551[/C][/ROW]
[ROW][C]45[/C][C]-0.103041[/C][C]-1.0659[/C][C]0.144443[/C][/ROW]
[ROW][C]46[/C][C]0.183419[/C][C]1.8973[/C][C]0.030242[/C][/ROW]
[ROW][C]47[/C][C]-0.127457[/C][C]-1.3184[/C][C]0.095089[/C][/ROW]
[ROW][C]48[/C][C]-0.008958[/C][C]-0.0927[/C][C]0.463174[/C][/ROW]
[/TABLE]
Source: https://freestatistics.org/blog/index.php?pk=241037&T=1

Globally Unique Identifier (entire table): ba.freestatistics.org/blog/index.php?pk=241037&T=1

As an alternative you can also use a QR Code:  

The GUIDs for individual cells are displayed in the table below:

Autocorrelation Function
Time lag kACF(k)T-STATP-value
1-0.532961-5.5130
20.0084010.08690.465455
30.1405381.45370.074472
4-0.071841-0.74310.229515
50.0041740.04320.482819
6-0.016481-0.17050.432478
70.0016250.01680.493308
8-0.046608-0.48210.315353
90.2032072.1020.018951
10-0.229155-2.37040.00978
11-0.00972-0.10050.460048
120.2111752.18440.015557
13-0.331285-3.42680.000434
140.2896912.99660.001697
15-0.128031-1.32440.094103
160.0140270.14510.442453
170.0134770.13940.444695
180.0693230.71710.237443
19-0.124978-1.29280.099435
200.0441840.4570.324282
210.0599950.62060.268095
22-0.142404-1.4730.071838
230.2004142.07310.020282
24-0.097256-1.0060.158337
25-0.108099-1.11820.132996
260.1657311.71430.044681
27-0.209716-2.16930.016136
280.1349831.39630.08276
29-0.00722-0.07470.470301
30-0.064495-0.66710.253059
310.057290.59260.277345
320.0402880.41670.338852
33-0.112912-1.1680.122708
340.0281780.29150.385625
350.0936530.96880.167426
36-0.137896-1.42640.078331
370.1234371.27680.102211
38-0.003106-0.03210.487215
39-0.069596-0.71990.236575
400.0974091.00760.157959
41-0.051584-0.53360.297365
42-0.074981-0.77560.219846
430.0893870.92460.178621
44-0.008134-0.08410.466551
45-0.103041-1.06590.144443
460.1834191.89730.030242
47-0.127457-1.31840.095089
48-0.008958-0.09270.463174


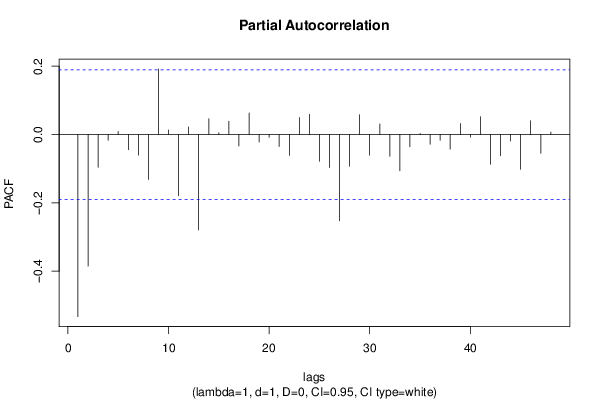
Partial Autocorrelation Function
Time lag kPACF(k)T-STATP-value
1-0.532961-5.5130
2-0.385005-3.98256.2e-05
3-0.095851-0.99150.16184
4-0.016835-0.17410.431041
50.0090220.09330.462911
6-0.044461-0.45990.323258
7-0.060221-0.62290.267328
8-0.131556-1.36080.088214
90.1919771.98580.024805
100.013370.13830.44513
11-0.17938-1.85550.033137
120.0221980.22960.409413
13-0.279124-2.88730.002351
140.0462520.47840.316657
150.0053760.05560.477879
160.0391560.4050.343131
17-0.033802-0.34970.363644
180.0632250.6540.257257
19-0.02204-0.2280.410046
20-0.008208-0.08490.466246
21-0.035158-0.36370.358409
22-0.061082-0.63180.264419
230.0497710.51480.303864
240.0595810.61630.269498
25-0.078294-0.80990.209904
26-0.096525-0.99850.160153
27-0.252559-2.61250.00514
28-0.092593-0.95780.170163
290.0579740.59970.274991
30-0.060289-0.62360.267099
310.0307590.31820.375486
32-0.063623-0.65810.255937
33-0.105845-1.09490.138017
34-0.03586-0.37090.35571
350.0029380.03040.487906
36-0.028329-0.2930.385032
37-0.016503-0.17070.432386
38-0.042799-0.44270.329431
390.032250.33360.369669
40-0.007614-0.07880.468687
410.0521040.5390.295516
42-0.086996-0.89990.185099
43-0.061985-0.64120.26139
44-0.018514-0.19150.424246
45-0.101574-1.05070.147885
460.040410.4180.33839
47-0.054531-0.56410.286941
480.0073550.07610.469747

\begin{tabular}{lllllllll}
\hline
Partial Autocorrelation Function \tabularnewline
Time lag k & PACF(k) & T-STAT & P-value \tabularnewline
1 & -0.532961 & -5.513 & 0 \tabularnewline
2 & -0.385005 & -3.9825 & 6.2e-05 \tabularnewline
3 & -0.095851 & -0.9915 & 0.16184 \tabularnewline
4 & -0.016835 & -0.1741 & 0.431041 \tabularnewline
5 & 0.009022 & 0.0933 & 0.462911 \tabularnewline
6 & -0.044461 & -0.4599 & 0.323258 \tabularnewline
7 & -0.060221 & -0.6229 & 0.267328 \tabularnewline
8 & -0.131556 & -1.3608 & 0.088214 \tabularnewline
9 & 0.191977 & 1.9858 & 0.024805 \tabularnewline
10 & 0.01337 & 0.1383 & 0.44513 \tabularnewline
11 & -0.17938 & -1.8555 & 0.033137 \tabularnewline
12 & 0.022198 & 0.2296 & 0.409413 \tabularnewline
13 & -0.279124 & -2.8873 & 0.002351 \tabularnewline
14 & 0.046252 & 0.4784 & 0.316657 \tabularnewline
15 & 0.005376 & 0.0556 & 0.477879 \tabularnewline
16 & 0.039156 & 0.405 & 0.343131 \tabularnewline
17 & -0.033802 & -0.3497 & 0.363644 \tabularnewline
18 & 0.063225 & 0.654 & 0.257257 \tabularnewline
19 & -0.02204 & -0.228 & 0.410046 \tabularnewline
20 & -0.008208 & -0.0849 & 0.466246 \tabularnewline
21 & -0.035158 & -0.3637 & 0.358409 \tabularnewline
22 & -0.061082 & -0.6318 & 0.264419 \tabularnewline
23 & 0.049771 & 0.5148 & 0.303864 \tabularnewline
24 & 0.059581 & 0.6163 & 0.269498 \tabularnewline
25 & -0.078294 & -0.8099 & 0.209904 \tabularnewline
26 & -0.096525 & -0.9985 & 0.160153 \tabularnewline
27 & -0.252559 & -2.6125 & 0.00514 \tabularnewline
28 & -0.092593 & -0.9578 & 0.170163 \tabularnewline
29 & 0.057974 & 0.5997 & 0.274991 \tabularnewline
30 & -0.060289 & -0.6236 & 0.267099 \tabularnewline
31 & 0.030759 & 0.3182 & 0.375486 \tabularnewline
32 & -0.063623 & -0.6581 & 0.255937 \tabularnewline
33 & -0.105845 & -1.0949 & 0.138017 \tabularnewline
34 & -0.03586 & -0.3709 & 0.35571 \tabularnewline
35 & 0.002938 & 0.0304 & 0.487906 \tabularnewline
36 & -0.028329 & -0.293 & 0.385032 \tabularnewline
37 & -0.016503 & -0.1707 & 0.432386 \tabularnewline
38 & -0.042799 & -0.4427 & 0.329431 \tabularnewline
39 & 0.03225 & 0.3336 & 0.369669 \tabularnewline
40 & -0.007614 & -0.0788 & 0.468687 \tabularnewline
41 & 0.052104 & 0.539 & 0.295516 \tabularnewline
42 & -0.086996 & -0.8999 & 0.185099 \tabularnewline
43 & -0.061985 & -0.6412 & 0.26139 \tabularnewline
44 & -0.018514 & -0.1915 & 0.424246 \tabularnewline
45 & -0.101574 & -1.0507 & 0.147885 \tabularnewline
46 & 0.04041 & 0.418 & 0.33839 \tabularnewline
47 & -0.054531 & -0.5641 & 0.286941 \tabularnewline
48 & 0.007355 & 0.0761 & 0.469747 \tabularnewline
\hline
\end{tabular}
%Source: https://freestatistics.org/blog/index.php?pk=241037&T=2

[TABLE]
[ROW][C]Partial Autocorrelation Function[/C][/ROW]
[ROW][C]Time lag k[/C][C]PACF(k)[/C][C]T-STAT[/C][C]P-value[/C][/ROW]
[ROW][C]1[/C][C]-0.532961[/C][C]-5.513[/C][C]0[/C][/ROW]
[ROW][C]2[/C][C]-0.385005[/C][C]-3.9825[/C][C]6.2e-05[/C][/ROW]
[ROW][C]3[/C][C]-0.095851[/C][C]-0.9915[/C][C]0.16184[/C][/ROW]
[ROW][C]4[/C][C]-0.016835[/C][C]-0.1741[/C][C]0.431041[/C][/ROW]
[ROW][C]5[/C][C]0.009022[/C][C]0.0933[/C][C]0.462911[/C][/ROW]
[ROW][C]6[/C][C]-0.044461[/C][C]-0.4599[/C][C]0.323258[/C][/ROW]
[ROW][C]7[/C][C]-0.060221[/C][C]-0.6229[/C][C]0.267328[/C][/ROW]
[ROW][C]8[/C][C]-0.131556[/C][C]-1.3608[/C][C]0.088214[/C][/ROW]
[ROW][C]9[/C][C]0.191977[/C][C]1.9858[/C][C]0.024805[/C][/ROW]
[ROW][C]10[/C][C]0.01337[/C][C]0.1383[/C][C]0.44513[/C][/ROW]
[ROW][C]11[/C][C]-0.17938[/C][C]-1.8555[/C][C]0.033137[/C][/ROW]
[ROW][C]12[/C][C]0.022198[/C][C]0.2296[/C][C]0.409413[/C][/ROW]
[ROW][C]13[/C][C]-0.279124[/C][C]-2.8873[/C][C]0.002351[/C][/ROW]
[ROW][C]14[/C][C]0.046252[/C][C]0.4784[/C][C]0.316657[/C][/ROW]
[ROW][C]15[/C][C]0.005376[/C][C]0.0556[/C][C]0.477879[/C][/ROW]
[ROW][C]16[/C][C]0.039156[/C][C]0.405[/C][C]0.343131[/C][/ROW]
[ROW][C]17[/C][C]-0.033802[/C][C]-0.3497[/C][C]0.363644[/C][/ROW]
[ROW][C]18[/C][C]0.063225[/C][C]0.654[/C][C]0.257257[/C][/ROW]
[ROW][C]19[/C][C]-0.02204[/C][C]-0.228[/C][C]0.410046[/C][/ROW]
[ROW][C]20[/C][C]-0.008208[/C][C]-0.0849[/C][C]0.466246[/C][/ROW]
[ROW][C]21[/C][C]-0.035158[/C][C]-0.3637[/C][C]0.358409[/C][/ROW]
[ROW][C]22[/C][C]-0.061082[/C][C]-0.6318[/C][C]0.264419[/C][/ROW]
[ROW][C]23[/C][C]0.049771[/C][C]0.5148[/C][C]0.303864[/C][/ROW]
[ROW][C]24[/C][C]0.059581[/C][C]0.6163[/C][C]0.269498[/C][/ROW]
[ROW][C]25[/C][C]-0.078294[/C][C]-0.8099[/C][C]0.209904[/C][/ROW]
[ROW][C]26[/C][C]-0.096525[/C][C]-0.9985[/C][C]0.160153[/C][/ROW]
[ROW][C]27[/C][C]-0.252559[/C][C]-2.6125[/C][C]0.00514[/C][/ROW]
[ROW][C]28[/C][C]-0.092593[/C][C]-0.9578[/C][C]0.170163[/C][/ROW]
[ROW][C]29[/C][C]0.057974[/C][C]0.5997[/C][C]0.274991[/C][/ROW]
[ROW][C]30[/C][C]-0.060289[/C][C]-0.6236[/C][C]0.267099[/C][/ROW]
[ROW][C]31[/C][C]0.030759[/C][C]0.3182[/C][C]0.375486[/C][/ROW]
[ROW][C]32[/C][C]-0.063623[/C][C]-0.6581[/C][C]0.255937[/C][/ROW]
[ROW][C]33[/C][C]-0.105845[/C][C]-1.0949[/C][C]0.138017[/C][/ROW]
[ROW][C]34[/C][C]-0.03586[/C][C]-0.3709[/C][C]0.35571[/C][/ROW]
[ROW][C]35[/C][C]0.002938[/C][C]0.0304[/C][C]0.487906[/C][/ROW]
[ROW][C]36[/C][C]-0.028329[/C][C]-0.293[/C][C]0.385032[/C][/ROW]
[ROW][C]37[/C][C]-0.016503[/C][C]-0.1707[/C][C]0.432386[/C][/ROW]
[ROW][C]38[/C][C]-0.042799[/C][C]-0.4427[/C][C]0.329431[/C][/ROW]
[ROW][C]39[/C][C]0.03225[/C][C]0.3336[/C][C]0.369669[/C][/ROW]
[ROW][C]40[/C][C]-0.007614[/C][C]-0.0788[/C][C]0.468687[/C][/ROW]
[ROW][C]41[/C][C]0.052104[/C][C]0.539[/C][C]0.295516[/C][/ROW]
[ROW][C]42[/C][C]-0.086996[/C][C]-0.8999[/C][C]0.185099[/C][/ROW]
[ROW][C]43[/C][C]-0.061985[/C][C]-0.6412[/C][C]0.26139[/C][/ROW]
[ROW][C]44[/C][C]-0.018514[/C][C]-0.1915[/C][C]0.424246[/C][/ROW]
[ROW][C]45[/C][C]-0.101574[/C][C]-1.0507[/C][C]0.147885[/C][/ROW]
[ROW][C]46[/C][C]0.04041[/C][C]0.418[/C][C]0.33839[/C][/ROW]
[ROW][C]47[/C][C]-0.054531[/C][C]-0.5641[/C][C]0.286941[/C][/ROW]
[ROW][C]48[/C][C]0.007355[/C][C]0.0761[/C][C]0.469747[/C][/ROW]
[/TABLE]
Source: https://freestatistics.org/blog/index.php?pk=241037&T=2

Globally Unique Identifier (entire table): ba.freestatistics.org/blog/index.php?pk=241037&T=2

As an alternative you can also use a QR Code:  

The GUIDs for individual cells are displayed in the table below:

Partial Autocorrelation Function
Time lag kPACF(k)T-STATP-value
1-0.532961-5.5130
2-0.385005-3.98256.2e-05
3-0.095851-0.99150.16184
4-0.016835-0.17410.431041
50.0090220.09330.462911
6-0.044461-0.45990.323258
7-0.060221-0.62290.267328
8-0.131556-1.36080.088214
90.1919771.98580.024805
100.013370.13830.44513
11-0.17938-1.85550.033137
120.0221980.22960.409413
13-0.279124-2.88730.002351
140.0462520.47840.316657
150.0053760.05560.477879
160.0391560.4050.343131
17-0.033802-0.34970.363644
180.0632250.6540.257257
19-0.02204-0.2280.410046
20-0.008208-0.08490.466246
21-0.035158-0.36370.358409
22-0.061082-0.63180.264419
230.0497710.51480.303864
240.0595810.61630.269498
25-0.078294-0.80990.209904
26-0.096525-0.99850.160153
27-0.252559-2.61250.00514
28-0.092593-0.95780.170163
290.0579740.59970.274991
30-0.060289-0.62360.267099
310.0307590.31820.375486
32-0.063623-0.65810.255937
33-0.105845-1.09490.138017
34-0.03586-0.37090.35571
350.0029380.03040.487906
36-0.028329-0.2930.385032
37-0.016503-0.17070.432386
38-0.042799-0.44270.329431
390.032250.33360.369669
40-0.007614-0.07880.468687
410.0521040.5390.295516
42-0.086996-0.89990.185099
43-0.061985-0.64120.26139
44-0.018514-0.19150.424246
45-0.101574-1.05070.147885
460.040410.4180.33839
47-0.054531-0.56410.286941
480.0073550.07610.469747


Parameters (Session):
par1 = 48 ; par2 = 1 ; par3 = 1 ; par4 = 0 ; par5 = 12 ; par6 = White Noise ; par7 = 0.95 ;
Parameters (R input):
par1 = 48 ; par2 = 1 ; par3 = 1 ; par4 = 0 ; par5 = 12 ; par6 = White Noise ; par7 = 0.95 ; par8 = ;
R code (references can be found in the software module):
par8 <- ''
par7 <- '0.95'
par6 <- 'White Noise'
par5 <- '12'
par4 <- '0'
par3 <- '0'
par2 <- '1'
par1 <- '48'
if (par1 == 'Default') {
par1 = 10*log10(length(x))
} else {
par1 <- as.numeric(par1)
}
par2 <- as.numeric(par2)
par3 <- as.numeric(par3)
par4 <- as.numeric(par4)
par5 <- as.numeric(par5)
if (par6 == 'White Noise') par6 <- 'white' else par6 <- 'ma'
par7 <- as.numeric(par7)
if (par8 != '') par8 <- as.numeric(par8)
ox <- x
if (par8 == '') {
if (par2 == 0) {
x <- log(x)
} else {
x <- (x ^ par2 - 1) / par2
}
} else {
x <- log(x,base=par8)
}
if (par3 > 0) x <- diff(x,lag=1,difference=par3)
if (par4 > 0) x <- diff(x,lag=par5,difference=par4)
bitmap(file='picts.png')
op <- par(mfrow=c(2,1))
plot(ox,type='l',main='Original Time Series',xlab='time',ylab='value')
if (par8=='') {
mytitle <- paste('Working Time Series (lambda=',par2,', d=',par3,', D=',par4,')',sep='')
mysub <- paste('(lambda=',par2,', d=',par3,', D=',par4,', CI=', par7, ', CI type=',par6,')',sep='')
} else {
mytitle <- paste('Working Time Series (base=',par8,', d=',par3,', D=',par4,')',sep='')
mysub <- paste('(base=',par8,', d=',par3,', D=',par4,', CI=', par7, ', CI type=',par6,')',sep='')
}
plot(x,type='l', main=mytitle,xlab='time',ylab='value')
par(op)
dev.off()
bitmap(file='pic1.png')
racf <- acf(x, par1, main='Autocorrelation', xlab='time lag', ylab='ACF', ci.type=par6, ci=par7, sub=mysub)
dev.off()
bitmap(file='pic2.png')
rpacf <- pacf(x,par1,main='Partial Autocorrelation',xlab='lags',ylab='PACF',sub=mysub)
dev.off()
(myacf <- c(racf$acf))
(mypacf <- c(rpacf$acf))
lengthx <- length(x)
sqrtn <- sqrt(lengthx)
load(file='createtable')
a<-table.start()
a<-table.row.start(a)
a<-table.element(a,'Autocorrelation Function',4,TRUE)
a<-table.row.end(a)
a<-table.row.start(a)
a<-table.element(a,'Time lag k',header=TRUE)
a<-table.element(a,hyperlink('basics.htm','ACF(k)','click here for more information about the Autocorrelation Function'),header=TRUE)
a<-table.element(a,'T-STAT',header=TRUE)
a<-table.element(a,'P-value',header=TRUE)
a<-table.row.end(a)
for (i in 2:(par1+1)) {
a<-table.row.start(a)
a<-table.element(a,i-1,header=TRUE)
a<-table.element(a,round(myacf[i],6))
mytstat <- myacf[i]*sqrtn
a<-table.element(a,round(mytstat,4))
a<-table.element(a,round(1-pt(abs(mytstat),lengthx),6))
a<-table.row.end(a)
}
a<-table.end(a)
table.save(a,file='mytable.tab')
a<-table.start()
a<-table.row.start(a)
a<-table.element(a,'Partial Autocorrelation Function',4,TRUE)
a<-table.row.end(a)
a<-table.row.start(a)
a<-table.element(a,'Time lag k',header=TRUE)
a<-table.element(a,hyperlink('basics.htm','PACF(k)','click here for more information about the Partial Autocorrelation Function'),header=TRUE)
a<-table.element(a,'T-STAT',header=TRUE)
a<-table.element(a,'P-value',header=TRUE)
a<-table.row.end(a)
for (i in 1:par1) {
a<-table.row.start(a)
a<-table.element(a,i,header=TRUE)
a<-table.element(a,round(mypacf[i],6))
mytstat <- mypacf[i]*sqrtn
a<-table.element(a,round(mytstat,4))
a<-table.element(a,round(1-pt(abs(mytstat),lengthx),6))
a<-table.row.end(a)
}
a<-table.end(a)
table.save(a,file='mytable1.tab')