Free Statistics

of Irreproducible Research!

Author's title

Author*Unverified author*
R Software Modulerwasp_autocorrelation.wasp
Title produced by software(Partial) Autocorrelation Function
Date of computationWed, 15 Oct 2014 09:39:12 +0100
Cite this page as followsStatistical Computations at FreeStatistics.org, Office for Research Development and Education, URL https://freestatistics.org/blog/index.php?v=date/2014/Oct/15/t1413362438b3bv1wsilyhnjn7.htm/, Retrieved Tue, 14 May 2024 02:13:47 +0000
Statistical Computations at FreeStatistics.org, Office for Research Development and Education, URL https://freestatistics.org/blog/index.php?pk=241036, Retrieved Tue, 14 May 2024 02:13:47 +0000
QR Codes:

Original text written by user:
IsPrivate?No (this computation is public)
User-defined keywords
Estimated Impact89
Family? (F = Feedback message, R = changed R code, M = changed R Module, P = changed Parameters, D = changed Data)
-       [(Partial) Autocorrelation Function] [] [2014-10-15 08:39:12] [959220cfe8d8b51f3b8cc01ba011fecd] [Current]
Feedback Forum

Post a new message
Dataseries X:
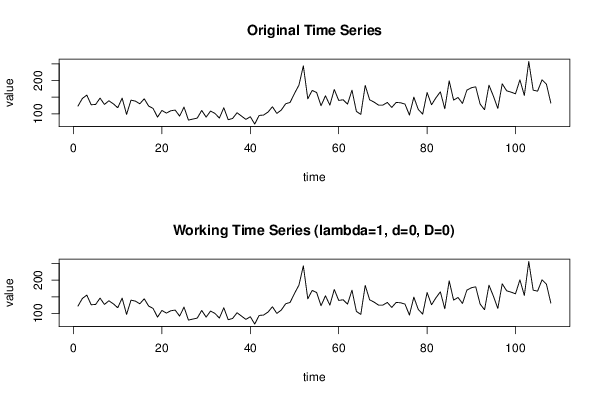
123
146
156
127
128
147
128
139
130
118
147
98
141
138
130
145
123
116
90
110
102
109
111
93
120
81
84
87
110
90
108
101
87
118
82
86
103
93
83
91
69
95
96
105
121
101
111
130
134
161
186
244
145
170
164
124
154
126
173
140
142
129
171
107
98
185
142
135
126
126
134
119
134
133
129
96
150
113
99
164
127
148
166
115
199
141
149
131
171
178
181
129
112
186
153
116
190
169
165
160
202
155
257
171
168
202
189
132


Summary of computational transaction
Raw Inputview raw input (R code)
Raw Outputview raw output of R engine
Computing time2 seconds
R Server'Gwilym Jenkins' @ jenkins.wessa.net

\begin{tabular}{lllllllll}
\hline
Summary of computational transaction \tabularnewline
Raw Input & view raw input (R code)  \tabularnewline
Raw Output & view raw output of R engine  \tabularnewline
Computing time & 2 seconds \tabularnewline
R Server & 'Gwilym Jenkins' @ jenkins.wessa.net \tabularnewline
\hline
\end{tabular}
%Source: https://freestatistics.org/blog/index.php?pk=241036&T=0

[TABLE]
[ROW][C]Summary of computational transaction[/C][/ROW]
[ROW][C]Raw Input[/C][C]view raw input (R code) [/C][/ROW]
[ROW][C]Raw Output[/C][C]view raw output of R engine [/C][/ROW]
[ROW][C]Computing time[/C][C]2 seconds[/C][/ROW]
[ROW][C]R Server[/C][C]'Gwilym Jenkins' @ jenkins.wessa.net[/C][/ROW]
[/TABLE]
Source: https://freestatistics.org/blog/index.php?pk=241036&T=0

Globally Unique Identifier (entire table): ba.freestatistics.org/blog/index.php?pk=241036&T=0

As an alternative you can also use a QR Code:  

The GUIDs for individual cells are displayed in the table below:

Summary of computational transaction
Raw Inputview raw input (R code)
Raw Outputview raw output of R engine
Computing time2 seconds
R Server'Gwilym Jenkins' @ jenkins.wessa.net


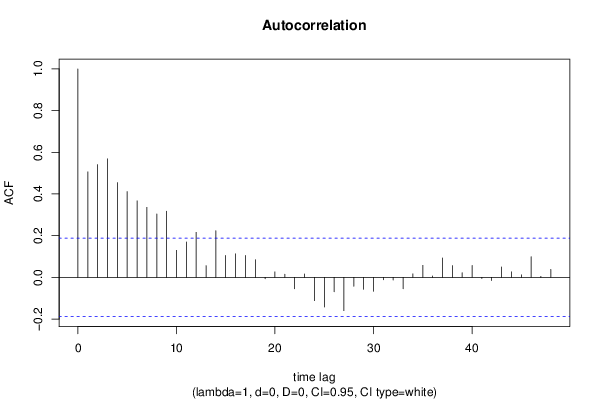
Autocorrelation Function
Time lag kACF(k)T-STATP-value
10.5063375.2620
20.5411315.62360
30.5686475.90960
40.4545574.72394e-06
50.4114294.27572.1e-05
60.3669923.81390.000114
70.3356763.48840.000352
80.3043423.16280.001015
90.3175773.30040.000654
100.1294031.34480.090755
110.1697581.76420.040265
120.2158052.24270.013479
130.0561150.58320.2805
140.2234772.32240.011042
150.1048721.08990.139101
160.1127461.17170.121949
170.105171.0930.138422
180.0844340.87750.19109
19-0.006983-0.07260.471144
200.0264230.27460.392074
210.0149580.15550.438378
22-0.054852-0.570.284917
230.015830.16450.434817
24-0.111905-1.1630.123706
25-0.142667-1.48260.070541
26-0.069405-0.72130.236148
27-0.159671-1.65940.049973
28-0.043164-0.44860.32732
29-0.057343-0.59590.276237
30-0.067062-0.69690.243674
31-0.011439-0.11890.452796
32-0.012405-0.12890.448833
33-0.0551-0.57260.284048
340.016680.17330.431353
350.0576430.5990.275198
360.006550.06810.472928
370.0926780.96310.168816
380.0563980.58610.279514
390.0221870.23060.409041
400.0572760.59520.276468
41-0.00549-0.05710.477304
42-0.015104-0.1570.437784
430.0499020.51860.302551
440.0262160.27240.392901
450.0120470.12520.450302
460.098721.02590.153608
470.0046860.04870.480626
480.038160.39660.346233

\begin{tabular}{lllllllll}
\hline
Autocorrelation Function \tabularnewline
Time lag k & ACF(k) & T-STAT & P-value \tabularnewline
1 & 0.506337 & 5.262 & 0 \tabularnewline
2 & 0.541131 & 5.6236 & 0 \tabularnewline
3 & 0.568647 & 5.9096 & 0 \tabularnewline
4 & 0.454557 & 4.7239 & 4e-06 \tabularnewline
5 & 0.411429 & 4.2757 & 2.1e-05 \tabularnewline
6 & 0.366992 & 3.8139 & 0.000114 \tabularnewline
7 & 0.335676 & 3.4884 & 0.000352 \tabularnewline
8 & 0.304342 & 3.1628 & 0.001015 \tabularnewline
9 & 0.317577 & 3.3004 & 0.000654 \tabularnewline
10 & 0.129403 & 1.3448 & 0.090755 \tabularnewline
11 & 0.169758 & 1.7642 & 0.040265 \tabularnewline
12 & 0.215805 & 2.2427 & 0.013479 \tabularnewline
13 & 0.056115 & 0.5832 & 0.2805 \tabularnewline
14 & 0.223477 & 2.3224 & 0.011042 \tabularnewline
15 & 0.104872 & 1.0899 & 0.139101 \tabularnewline
16 & 0.112746 & 1.1717 & 0.121949 \tabularnewline
17 & 0.10517 & 1.093 & 0.138422 \tabularnewline
18 & 0.084434 & 0.8775 & 0.19109 \tabularnewline
19 & -0.006983 & -0.0726 & 0.471144 \tabularnewline
20 & 0.026423 & 0.2746 & 0.392074 \tabularnewline
21 & 0.014958 & 0.1555 & 0.438378 \tabularnewline
22 & -0.054852 & -0.57 & 0.284917 \tabularnewline
23 & 0.01583 & 0.1645 & 0.434817 \tabularnewline
24 & -0.111905 & -1.163 & 0.123706 \tabularnewline
25 & -0.142667 & -1.4826 & 0.070541 \tabularnewline
26 & -0.069405 & -0.7213 & 0.236148 \tabularnewline
27 & -0.159671 & -1.6594 & 0.049973 \tabularnewline
28 & -0.043164 & -0.4486 & 0.32732 \tabularnewline
29 & -0.057343 & -0.5959 & 0.276237 \tabularnewline
30 & -0.067062 & -0.6969 & 0.243674 \tabularnewline
31 & -0.011439 & -0.1189 & 0.452796 \tabularnewline
32 & -0.012405 & -0.1289 & 0.448833 \tabularnewline
33 & -0.0551 & -0.5726 & 0.284048 \tabularnewline
34 & 0.01668 & 0.1733 & 0.431353 \tabularnewline
35 & 0.057643 & 0.599 & 0.275198 \tabularnewline
36 & 0.00655 & 0.0681 & 0.472928 \tabularnewline
37 & 0.092678 & 0.9631 & 0.168816 \tabularnewline
38 & 0.056398 & 0.5861 & 0.279514 \tabularnewline
39 & 0.022187 & 0.2306 & 0.409041 \tabularnewline
40 & 0.057276 & 0.5952 & 0.276468 \tabularnewline
41 & -0.00549 & -0.0571 & 0.477304 \tabularnewline
42 & -0.015104 & -0.157 & 0.437784 \tabularnewline
43 & 0.049902 & 0.5186 & 0.302551 \tabularnewline
44 & 0.026216 & 0.2724 & 0.392901 \tabularnewline
45 & 0.012047 & 0.1252 & 0.450302 \tabularnewline
46 & 0.09872 & 1.0259 & 0.153608 \tabularnewline
47 & 0.004686 & 0.0487 & 0.480626 \tabularnewline
48 & 0.03816 & 0.3966 & 0.346233 \tabularnewline
\hline
\end{tabular}
%Source: https://freestatistics.org/blog/index.php?pk=241036&T=1

[TABLE]
[ROW][C]Autocorrelation Function[/C][/ROW]
[ROW][C]Time lag k[/C][C]ACF(k)[/C][C]T-STAT[/C][C]P-value[/C][/ROW]
[ROW][C]1[/C][C]0.506337[/C][C]5.262[/C][C]0[/C][/ROW]
[ROW][C]2[/C][C]0.541131[/C][C]5.6236[/C][C]0[/C][/ROW]
[ROW][C]3[/C][C]0.568647[/C][C]5.9096[/C][C]0[/C][/ROW]
[ROW][C]4[/C][C]0.454557[/C][C]4.7239[/C][C]4e-06[/C][/ROW]
[ROW][C]5[/C][C]0.411429[/C][C]4.2757[/C][C]2.1e-05[/C][/ROW]
[ROW][C]6[/C][C]0.366992[/C][C]3.8139[/C][C]0.000114[/C][/ROW]
[ROW][C]7[/C][C]0.335676[/C][C]3.4884[/C][C]0.000352[/C][/ROW]
[ROW][C]8[/C][C]0.304342[/C][C]3.1628[/C][C]0.001015[/C][/ROW]
[ROW][C]9[/C][C]0.317577[/C][C]3.3004[/C][C]0.000654[/C][/ROW]
[ROW][C]10[/C][C]0.129403[/C][C]1.3448[/C][C]0.090755[/C][/ROW]
[ROW][C]11[/C][C]0.169758[/C][C]1.7642[/C][C]0.040265[/C][/ROW]
[ROW][C]12[/C][C]0.215805[/C][C]2.2427[/C][C]0.013479[/C][/ROW]
[ROW][C]13[/C][C]0.056115[/C][C]0.5832[/C][C]0.2805[/C][/ROW]
[ROW][C]14[/C][C]0.223477[/C][C]2.3224[/C][C]0.011042[/C][/ROW]
[ROW][C]15[/C][C]0.104872[/C][C]1.0899[/C][C]0.139101[/C][/ROW]
[ROW][C]16[/C][C]0.112746[/C][C]1.1717[/C][C]0.121949[/C][/ROW]
[ROW][C]17[/C][C]0.10517[/C][C]1.093[/C][C]0.138422[/C][/ROW]
[ROW][C]18[/C][C]0.084434[/C][C]0.8775[/C][C]0.19109[/C][/ROW]
[ROW][C]19[/C][C]-0.006983[/C][C]-0.0726[/C][C]0.471144[/C][/ROW]
[ROW][C]20[/C][C]0.026423[/C][C]0.2746[/C][C]0.392074[/C][/ROW]
[ROW][C]21[/C][C]0.014958[/C][C]0.1555[/C][C]0.438378[/C][/ROW]
[ROW][C]22[/C][C]-0.054852[/C][C]-0.57[/C][C]0.284917[/C][/ROW]
[ROW][C]23[/C][C]0.01583[/C][C]0.1645[/C][C]0.434817[/C][/ROW]
[ROW][C]24[/C][C]-0.111905[/C][C]-1.163[/C][C]0.123706[/C][/ROW]
[ROW][C]25[/C][C]-0.142667[/C][C]-1.4826[/C][C]0.070541[/C][/ROW]
[ROW][C]26[/C][C]-0.069405[/C][C]-0.7213[/C][C]0.236148[/C][/ROW]
[ROW][C]27[/C][C]-0.159671[/C][C]-1.6594[/C][C]0.049973[/C][/ROW]
[ROW][C]28[/C][C]-0.043164[/C][C]-0.4486[/C][C]0.32732[/C][/ROW]
[ROW][C]29[/C][C]-0.057343[/C][C]-0.5959[/C][C]0.276237[/C][/ROW]
[ROW][C]30[/C][C]-0.067062[/C][C]-0.6969[/C][C]0.243674[/C][/ROW]
[ROW][C]31[/C][C]-0.011439[/C][C]-0.1189[/C][C]0.452796[/C][/ROW]
[ROW][C]32[/C][C]-0.012405[/C][C]-0.1289[/C][C]0.448833[/C][/ROW]
[ROW][C]33[/C][C]-0.0551[/C][C]-0.5726[/C][C]0.284048[/C][/ROW]
[ROW][C]34[/C][C]0.01668[/C][C]0.1733[/C][C]0.431353[/C][/ROW]
[ROW][C]35[/C][C]0.057643[/C][C]0.599[/C][C]0.275198[/C][/ROW]
[ROW][C]36[/C][C]0.00655[/C][C]0.0681[/C][C]0.472928[/C][/ROW]
[ROW][C]37[/C][C]0.092678[/C][C]0.9631[/C][C]0.168816[/C][/ROW]
[ROW][C]38[/C][C]0.056398[/C][C]0.5861[/C][C]0.279514[/C][/ROW]
[ROW][C]39[/C][C]0.022187[/C][C]0.2306[/C][C]0.409041[/C][/ROW]
[ROW][C]40[/C][C]0.057276[/C][C]0.5952[/C][C]0.276468[/C][/ROW]
[ROW][C]41[/C][C]-0.00549[/C][C]-0.0571[/C][C]0.477304[/C][/ROW]
[ROW][C]42[/C][C]-0.015104[/C][C]-0.157[/C][C]0.437784[/C][/ROW]
[ROW][C]43[/C][C]0.049902[/C][C]0.5186[/C][C]0.302551[/C][/ROW]
[ROW][C]44[/C][C]0.026216[/C][C]0.2724[/C][C]0.392901[/C][/ROW]
[ROW][C]45[/C][C]0.012047[/C][C]0.1252[/C][C]0.450302[/C][/ROW]
[ROW][C]46[/C][C]0.09872[/C][C]1.0259[/C][C]0.153608[/C][/ROW]
[ROW][C]47[/C][C]0.004686[/C][C]0.0487[/C][C]0.480626[/C][/ROW]
[ROW][C]48[/C][C]0.03816[/C][C]0.3966[/C][C]0.346233[/C][/ROW]
[/TABLE]
Source: https://freestatistics.org/blog/index.php?pk=241036&T=1

Globally Unique Identifier (entire table): ba.freestatistics.org/blog/index.php?pk=241036&T=1

As an alternative you can also use a QR Code:  

The GUIDs for individual cells are displayed in the table below:

Autocorrelation Function
Time lag kACF(k)T-STATP-value
10.5063375.2620
20.5411315.62360
30.5686475.90960
40.4545574.72394e-06
50.4114294.27572.1e-05
60.3669923.81390.000114
70.3356763.48840.000352
80.3043423.16280.001015
90.3175773.30040.000654
100.1294031.34480.090755
110.1697581.76420.040265
120.2158052.24270.013479
130.0561150.58320.2805
140.2234772.32240.011042
150.1048721.08990.139101
160.1127461.17170.121949
170.105171.0930.138422
180.0844340.87750.19109
19-0.006983-0.07260.471144
200.0264230.27460.392074
210.0149580.15550.438378
22-0.054852-0.570.284917
230.015830.16450.434817
24-0.111905-1.1630.123706
25-0.142667-1.48260.070541
26-0.069405-0.72130.236148
27-0.159671-1.65940.049973
28-0.043164-0.44860.32732
29-0.057343-0.59590.276237
30-0.067062-0.69690.243674
31-0.011439-0.11890.452796
32-0.012405-0.12890.448833
33-0.0551-0.57260.284048
340.016680.17330.431353
350.0576430.5990.275198
360.006550.06810.472928
370.0926780.96310.168816
380.0563980.58610.279514
390.0221870.23060.409041
400.0572760.59520.276468
41-0.00549-0.05710.477304
42-0.015104-0.1570.437784
430.0499020.51860.302551
440.0262160.27240.392901
450.0120470.12520.450302
460.098721.02590.153608
470.0046860.04870.480626
480.038160.39660.346233


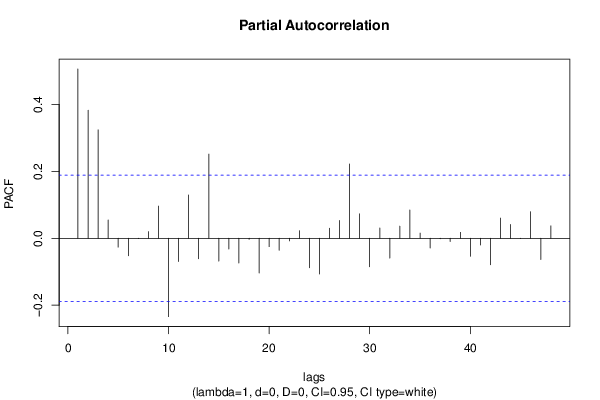
Partial Autocorrelation Function
Time lag kPACF(k)T-STATP-value
10.5063375.2620
20.3829283.97956.3e-05
30.3241233.36840.000524
40.054470.56610.286261
5-0.026516-0.27560.391704
6-0.052407-0.54460.293566
7-0.000886-0.00920.496337
80.0198190.2060.418603
90.0961690.99940.159914
10-0.234426-2.43620.008238
11-0.069422-0.72150.236094
120.1293081.34380.090913
13-0.061326-0.63730.262632
140.251582.61450.005106
15-0.068302-0.70980.239675
16-0.032003-0.33260.370047
17-0.073854-0.76750.222224
18-0.003249-0.03380.486565
19-0.104159-1.08250.140731
20-0.025072-0.26060.397465
21-0.035878-0.37290.354994
22-0.007932-0.08240.46723
230.0224140.23290.408126
24-0.088031-0.91480.181155
25-0.107042-1.11240.134216
260.0298430.31010.378526
270.0530540.55140.291266
280.222332.31050.01138
290.0729590.75820.224987
30-0.085438-0.88790.188285
310.0309650.32180.374116
32-0.059339-0.61670.269374
330.036230.37650.353638
340.0846860.88010.190384
350.015470.16080.43629
36-0.029088-0.30230.381507
37-0.001633-0.0170.493246
38-0.00979-0.10170.459574
390.0176820.18380.427274
40-0.053629-0.55730.289228
41-0.020067-0.20850.417597
42-0.079291-0.8240.205873
430.0602310.62590.266336
440.0410840.4270.335128
45-0.00099-0.01030.495907
460.0794180.82530.2055
47-0.063301-0.65780.256018
480.0371490.38610.350106

\begin{tabular}{lllllllll}
\hline
Partial Autocorrelation Function \tabularnewline
Time lag k & PACF(k) & T-STAT & P-value \tabularnewline
1 & 0.506337 & 5.262 & 0 \tabularnewline
2 & 0.382928 & 3.9795 & 6.3e-05 \tabularnewline
3 & 0.324123 & 3.3684 & 0.000524 \tabularnewline
4 & 0.05447 & 0.5661 & 0.286261 \tabularnewline
5 & -0.026516 & -0.2756 & 0.391704 \tabularnewline
6 & -0.052407 & -0.5446 & 0.293566 \tabularnewline
7 & -0.000886 & -0.0092 & 0.496337 \tabularnewline
8 & 0.019819 & 0.206 & 0.418603 \tabularnewline
9 & 0.096169 & 0.9994 & 0.159914 \tabularnewline
10 & -0.234426 & -2.4362 & 0.008238 \tabularnewline
11 & -0.069422 & -0.7215 & 0.236094 \tabularnewline
12 & 0.129308 & 1.3438 & 0.090913 \tabularnewline
13 & -0.061326 & -0.6373 & 0.262632 \tabularnewline
14 & 0.25158 & 2.6145 & 0.005106 \tabularnewline
15 & -0.068302 & -0.7098 & 0.239675 \tabularnewline
16 & -0.032003 & -0.3326 & 0.370047 \tabularnewline
17 & -0.073854 & -0.7675 & 0.222224 \tabularnewline
18 & -0.003249 & -0.0338 & 0.486565 \tabularnewline
19 & -0.104159 & -1.0825 & 0.140731 \tabularnewline
20 & -0.025072 & -0.2606 & 0.397465 \tabularnewline
21 & -0.035878 & -0.3729 & 0.354994 \tabularnewline
22 & -0.007932 & -0.0824 & 0.46723 \tabularnewline
23 & 0.022414 & 0.2329 & 0.408126 \tabularnewline
24 & -0.088031 & -0.9148 & 0.181155 \tabularnewline
25 & -0.107042 & -1.1124 & 0.134216 \tabularnewline
26 & 0.029843 & 0.3101 & 0.378526 \tabularnewline
27 & 0.053054 & 0.5514 & 0.291266 \tabularnewline
28 & 0.22233 & 2.3105 & 0.01138 \tabularnewline
29 & 0.072959 & 0.7582 & 0.224987 \tabularnewline
30 & -0.085438 & -0.8879 & 0.188285 \tabularnewline
31 & 0.030965 & 0.3218 & 0.374116 \tabularnewline
32 & -0.059339 & -0.6167 & 0.269374 \tabularnewline
33 & 0.03623 & 0.3765 & 0.353638 \tabularnewline
34 & 0.084686 & 0.8801 & 0.190384 \tabularnewline
35 & 0.01547 & 0.1608 & 0.43629 \tabularnewline
36 & -0.029088 & -0.3023 & 0.381507 \tabularnewline
37 & -0.001633 & -0.017 & 0.493246 \tabularnewline
38 & -0.00979 & -0.1017 & 0.459574 \tabularnewline
39 & 0.017682 & 0.1838 & 0.427274 \tabularnewline
40 & -0.053629 & -0.5573 & 0.289228 \tabularnewline
41 & -0.020067 & -0.2085 & 0.417597 \tabularnewline
42 & -0.079291 & -0.824 & 0.205873 \tabularnewline
43 & 0.060231 & 0.6259 & 0.266336 \tabularnewline
44 & 0.041084 & 0.427 & 0.335128 \tabularnewline
45 & -0.00099 & -0.0103 & 0.495907 \tabularnewline
46 & 0.079418 & 0.8253 & 0.2055 \tabularnewline
47 & -0.063301 & -0.6578 & 0.256018 \tabularnewline
48 & 0.037149 & 0.3861 & 0.350106 \tabularnewline
\hline
\end{tabular}
%Source: https://freestatistics.org/blog/index.php?pk=241036&T=2

[TABLE]
[ROW][C]Partial Autocorrelation Function[/C][/ROW]
[ROW][C]Time lag k[/C][C]PACF(k)[/C][C]T-STAT[/C][C]P-value[/C][/ROW]
[ROW][C]1[/C][C]0.506337[/C][C]5.262[/C][C]0[/C][/ROW]
[ROW][C]2[/C][C]0.382928[/C][C]3.9795[/C][C]6.3e-05[/C][/ROW]
[ROW][C]3[/C][C]0.324123[/C][C]3.3684[/C][C]0.000524[/C][/ROW]
[ROW][C]4[/C][C]0.05447[/C][C]0.5661[/C][C]0.286261[/C][/ROW]
[ROW][C]5[/C][C]-0.026516[/C][C]-0.2756[/C][C]0.391704[/C][/ROW]
[ROW][C]6[/C][C]-0.052407[/C][C]-0.5446[/C][C]0.293566[/C][/ROW]
[ROW][C]7[/C][C]-0.000886[/C][C]-0.0092[/C][C]0.496337[/C][/ROW]
[ROW][C]8[/C][C]0.019819[/C][C]0.206[/C][C]0.418603[/C][/ROW]
[ROW][C]9[/C][C]0.096169[/C][C]0.9994[/C][C]0.159914[/C][/ROW]
[ROW][C]10[/C][C]-0.234426[/C][C]-2.4362[/C][C]0.008238[/C][/ROW]
[ROW][C]11[/C][C]-0.069422[/C][C]-0.7215[/C][C]0.236094[/C][/ROW]
[ROW][C]12[/C][C]0.129308[/C][C]1.3438[/C][C]0.090913[/C][/ROW]
[ROW][C]13[/C][C]-0.061326[/C][C]-0.6373[/C][C]0.262632[/C][/ROW]
[ROW][C]14[/C][C]0.25158[/C][C]2.6145[/C][C]0.005106[/C][/ROW]
[ROW][C]15[/C][C]-0.068302[/C][C]-0.7098[/C][C]0.239675[/C][/ROW]
[ROW][C]16[/C][C]-0.032003[/C][C]-0.3326[/C][C]0.370047[/C][/ROW]
[ROW][C]17[/C][C]-0.073854[/C][C]-0.7675[/C][C]0.222224[/C][/ROW]
[ROW][C]18[/C][C]-0.003249[/C][C]-0.0338[/C][C]0.486565[/C][/ROW]
[ROW][C]19[/C][C]-0.104159[/C][C]-1.0825[/C][C]0.140731[/C][/ROW]
[ROW][C]20[/C][C]-0.025072[/C][C]-0.2606[/C][C]0.397465[/C][/ROW]
[ROW][C]21[/C][C]-0.035878[/C][C]-0.3729[/C][C]0.354994[/C][/ROW]
[ROW][C]22[/C][C]-0.007932[/C][C]-0.0824[/C][C]0.46723[/C][/ROW]
[ROW][C]23[/C][C]0.022414[/C][C]0.2329[/C][C]0.408126[/C][/ROW]
[ROW][C]24[/C][C]-0.088031[/C][C]-0.9148[/C][C]0.181155[/C][/ROW]
[ROW][C]25[/C][C]-0.107042[/C][C]-1.1124[/C][C]0.134216[/C][/ROW]
[ROW][C]26[/C][C]0.029843[/C][C]0.3101[/C][C]0.378526[/C][/ROW]
[ROW][C]27[/C][C]0.053054[/C][C]0.5514[/C][C]0.291266[/C][/ROW]
[ROW][C]28[/C][C]0.22233[/C][C]2.3105[/C][C]0.01138[/C][/ROW]
[ROW][C]29[/C][C]0.072959[/C][C]0.7582[/C][C]0.224987[/C][/ROW]
[ROW][C]30[/C][C]-0.085438[/C][C]-0.8879[/C][C]0.188285[/C][/ROW]
[ROW][C]31[/C][C]0.030965[/C][C]0.3218[/C][C]0.374116[/C][/ROW]
[ROW][C]32[/C][C]-0.059339[/C][C]-0.6167[/C][C]0.269374[/C][/ROW]
[ROW][C]33[/C][C]0.03623[/C][C]0.3765[/C][C]0.353638[/C][/ROW]
[ROW][C]34[/C][C]0.084686[/C][C]0.8801[/C][C]0.190384[/C][/ROW]
[ROW][C]35[/C][C]0.01547[/C][C]0.1608[/C][C]0.43629[/C][/ROW]
[ROW][C]36[/C][C]-0.029088[/C][C]-0.3023[/C][C]0.381507[/C][/ROW]
[ROW][C]37[/C][C]-0.001633[/C][C]-0.017[/C][C]0.493246[/C][/ROW]
[ROW][C]38[/C][C]-0.00979[/C][C]-0.1017[/C][C]0.459574[/C][/ROW]
[ROW][C]39[/C][C]0.017682[/C][C]0.1838[/C][C]0.427274[/C][/ROW]
[ROW][C]40[/C][C]-0.053629[/C][C]-0.5573[/C][C]0.289228[/C][/ROW]
[ROW][C]41[/C][C]-0.020067[/C][C]-0.2085[/C][C]0.417597[/C][/ROW]
[ROW][C]42[/C][C]-0.079291[/C][C]-0.824[/C][C]0.205873[/C][/ROW]
[ROW][C]43[/C][C]0.060231[/C][C]0.6259[/C][C]0.266336[/C][/ROW]
[ROW][C]44[/C][C]0.041084[/C][C]0.427[/C][C]0.335128[/C][/ROW]
[ROW][C]45[/C][C]-0.00099[/C][C]-0.0103[/C][C]0.495907[/C][/ROW]
[ROW][C]46[/C][C]0.079418[/C][C]0.8253[/C][C]0.2055[/C][/ROW]
[ROW][C]47[/C][C]-0.063301[/C][C]-0.6578[/C][C]0.256018[/C][/ROW]
[ROW][C]48[/C][C]0.037149[/C][C]0.3861[/C][C]0.350106[/C][/ROW]
[/TABLE]
Source: https://freestatistics.org/blog/index.php?pk=241036&T=2

Globally Unique Identifier (entire table): ba.freestatistics.org/blog/index.php?pk=241036&T=2

As an alternative you can also use a QR Code:  

The GUIDs for individual cells are displayed in the table below:

Partial Autocorrelation Function
Time lag kPACF(k)T-STATP-value
10.5063375.2620
20.3829283.97956.3e-05
30.3241233.36840.000524
40.054470.56610.286261
5-0.026516-0.27560.391704
6-0.052407-0.54460.293566
7-0.000886-0.00920.496337
80.0198190.2060.418603
90.0961690.99940.159914
10-0.234426-2.43620.008238
11-0.069422-0.72150.236094
120.1293081.34380.090913
13-0.061326-0.63730.262632
140.251582.61450.005106
15-0.068302-0.70980.239675
16-0.032003-0.33260.370047
17-0.073854-0.76750.222224
18-0.003249-0.03380.486565
19-0.104159-1.08250.140731
20-0.025072-0.26060.397465
21-0.035878-0.37290.354994
22-0.007932-0.08240.46723
230.0224140.23290.408126
24-0.088031-0.91480.181155
25-0.107042-1.11240.134216
260.0298430.31010.378526
270.0530540.55140.291266
280.222332.31050.01138
290.0729590.75820.224987
30-0.085438-0.88790.188285
310.0309650.32180.374116
32-0.059339-0.61670.269374
330.036230.37650.353638
340.0846860.88010.190384
350.015470.16080.43629
36-0.029088-0.30230.381507
37-0.001633-0.0170.493246
38-0.00979-0.10170.459574
390.0176820.18380.427274
40-0.053629-0.55730.289228
41-0.020067-0.20850.417597
42-0.079291-0.8240.205873
430.0602310.62590.266336
440.0410840.4270.335128
45-0.00099-0.01030.495907
460.0794180.82530.2055
47-0.063301-0.65780.256018
480.0371490.38610.350106


Parameters (Session):
par1 = 48 ; par2 = 1 ; par3 = 0 ; par4 = 0 ; par5 = 12 ; par6 = White Noise ; par7 = 0.95 ;
Parameters (R input):
par1 = 48 ; par2 = 1 ; par3 = 0 ; par4 = 0 ; par5 = 12 ; par6 = White Noise ; par7 = 0.95 ; par8 = ;
R code (references can be found in the software module):
if (par1 == 'Default') {
par1 = 10*log10(length(x))
} else {
par1 <- as.numeric(par1)
}
par2 <- as.numeric(par2)
par3 <- as.numeric(par3)
par4 <- as.numeric(par4)
par5 <- as.numeric(par5)
if (par6 == 'White Noise') par6 <- 'white' else par6 <- 'ma'
par7 <- as.numeric(par7)
if (par8 != '') par8 <- as.numeric(par8)
ox <- x
if (par8 == '') {
if (par2 == 0) {
x <- log(x)
} else {
x <- (x ^ par2 - 1) / par2
}
} else {
x <- log(x,base=par8)
}
if (par3 > 0) x <- diff(x,lag=1,difference=par3)
if (par4 > 0) x <- diff(x,lag=par5,difference=par4)
bitmap(file='picts.png')
op <- par(mfrow=c(2,1))
plot(ox,type='l',main='Original Time Series',xlab='time',ylab='value')
if (par8=='') {
mytitle <- paste('Working Time Series (lambda=',par2,', d=',par3,', D=',par4,')',sep='')
mysub <- paste('(lambda=',par2,', d=',par3,', D=',par4,', CI=', par7, ', CI type=',par6,')',sep='')
} else {
mytitle <- paste('Working Time Series (base=',par8,', d=',par3,', D=',par4,')',sep='')
mysub <- paste('(base=',par8,', d=',par3,', D=',par4,', CI=', par7, ', CI type=',par6,')',sep='')
}
plot(x,type='l', main=mytitle,xlab='time',ylab='value')
par(op)
dev.off()
bitmap(file='pic1.png')
racf <- acf(x, par1, main='Autocorrelation', xlab='time lag', ylab='ACF', ci.type=par6, ci=par7, sub=mysub)
dev.off()
bitmap(file='pic2.png')
rpacf <- pacf(x,par1,main='Partial Autocorrelation',xlab='lags',ylab='PACF',sub=mysub)
dev.off()
(myacf <- c(racf$acf))
(mypacf <- c(rpacf$acf))
lengthx <- length(x)
sqrtn <- sqrt(lengthx)
load(file='createtable')
a<-table.start()
a<-table.row.start(a)
a<-table.element(a,'Autocorrelation Function',4,TRUE)
a<-table.row.end(a)
a<-table.row.start(a)
a<-table.element(a,'Time lag k',header=TRUE)
a<-table.element(a,hyperlink('basics.htm','ACF(k)','click here for more information about the Autocorrelation Function'),header=TRUE)
a<-table.element(a,'T-STAT',header=TRUE)
a<-table.element(a,'P-value',header=TRUE)
a<-table.row.end(a)
for (i in 2:(par1+1)) {
a<-table.row.start(a)
a<-table.element(a,i-1,header=TRUE)
a<-table.element(a,round(myacf[i],6))
mytstat <- myacf[i]*sqrtn
a<-table.element(a,round(mytstat,4))
a<-table.element(a,round(1-pt(abs(mytstat),lengthx),6))
a<-table.row.end(a)
}
a<-table.end(a)
table.save(a,file='mytable.tab')
a<-table.start()
a<-table.row.start(a)
a<-table.element(a,'Partial Autocorrelation Function',4,TRUE)
a<-table.row.end(a)
a<-table.row.start(a)
a<-table.element(a,'Time lag k',header=TRUE)
a<-table.element(a,hyperlink('basics.htm','PACF(k)','click here for more information about the Partial Autocorrelation Function'),header=TRUE)
a<-table.element(a,'T-STAT',header=TRUE)
a<-table.element(a,'P-value',header=TRUE)
a<-table.row.end(a)
for (i in 1:par1) {
a<-table.row.start(a)
a<-table.element(a,i,header=TRUE)
a<-table.element(a,round(mypacf[i],6))
mytstat <- mypacf[i]*sqrtn
a<-table.element(a,round(mytstat,4))
a<-table.element(a,round(1-pt(abs(mytstat),lengthx),6))
a<-table.row.end(a)
}
a<-table.end(a)
table.save(a,file='mytable1.tab')