Free Statistics

of Irreproducible Research!

Author's title

Author*Unverified author*
R Software Modulerwasp_centraltendency.wasp
Title produced by softwareCentral Tendency
Date of computationSun, 12 Oct 2014 23:55:47 +0100
Cite this page as followsStatistical Computations at FreeStatistics.org, Office for Research Development and Education, URL https://freestatistics.org/blog/index.php?v=date/2014/Oct/12/t14131545730q0n0ph82z6r1ox.htm/, Retrieved Wed, 15 May 2024 08:31:37 +0000
Statistical Computations at FreeStatistics.org, Office for Research Development and Education, URL https://freestatistics.org/blog/index.php?pk=240696, Retrieved Wed, 15 May 2024 08:31:37 +0000
QR Codes:

Original text written by user:
IsPrivate?No (this computation is public)
User-defined keywords
Estimated Impact80
Family? (F = Feedback message, R = changed R code, M = changed R Module, P = changed Parameters, D = changed Data)
-       [Central Tendency] [Gemiddelde prijs ...] [2014-10-12 22:55:47] [6100e5aa5cdb51a951984168d031078f] [Current]
Feedback Forum

Post a new message
Dataseries X:
110,48
111,41
115,5
118,32
118,42
117,5
110,23
109,19
118,41
118,3
116,1
114,11
113,41
114,33
116,61
123,64
123,77
123,39
116,03
114,95
123,4
123,53
114,45
114,26
114,35
112,77
115,31
114,93
116,38
115,07
105
103,43
114,52
115,04
117,16
115
116,22
112,92
116,56
114,32
113,22
111,56
103,87
102,85
112,27
112,76
118,55
122,73
115,44
116,97
119,84
116,37
117,23
115,58
109,82
108,46
116,54
117,49
122,87
127,1
119,81
120,03
128,58
120,4
121,54
118,71
111,57
109,97
120,29
120,61
130,15
136,12


Summary of computational transaction
Raw Inputview raw input (R code)
Raw Outputview raw output of R engine
Computing time2 seconds
R Server'George Udny Yule' @ yule.wessa.net

\begin{tabular}{lllllllll}
\hline
Summary of computational transaction \tabularnewline
Raw Input & view raw input (R code)  \tabularnewline
Raw Output & view raw output of R engine  \tabularnewline
Computing time & 2 seconds \tabularnewline
R Server & 'George Udny Yule' @ yule.wessa.net \tabularnewline
\hline
\end{tabular}
%Source: https://freestatistics.org/blog/index.php?pk=240696&T=0

[TABLE]
[ROW][C]Summary of computational transaction[/C][/ROW]
[ROW][C]Raw Input[/C][C]view raw input (R code) [/C][/ROW]
[ROW][C]Raw Output[/C][C]view raw output of R engine [/C][/ROW]
[ROW][C]Computing time[/C][C]2 seconds[/C][/ROW]
[ROW][C]R Server[/C][C]'George Udny Yule' @ yule.wessa.net[/C][/ROW]
[/TABLE]
Source: https://freestatistics.org/blog/index.php?pk=240696&T=0

Globally Unique Identifier (entire table): ba.freestatistics.org/blog/index.php?pk=240696&T=0

As an alternative you can also use a QR Code:  

The GUIDs for individual cells are displayed in the table below:

Summary of computational transaction
Raw Inputview raw input (R code)
Raw Outputview raw output of R engine
Computing time2 seconds
R Server'George Udny Yule' @ yule.wessa.net


Central Tendency - Ungrouped Data
MeasureValueS.E.Value/S.E.
Arithmetic Mean116.3613888888890.688171987864146169.087656778991
Geometric Mean116.218202558477
Harmonic Mean116.076007757827
Quadratic Mean116.505781198951
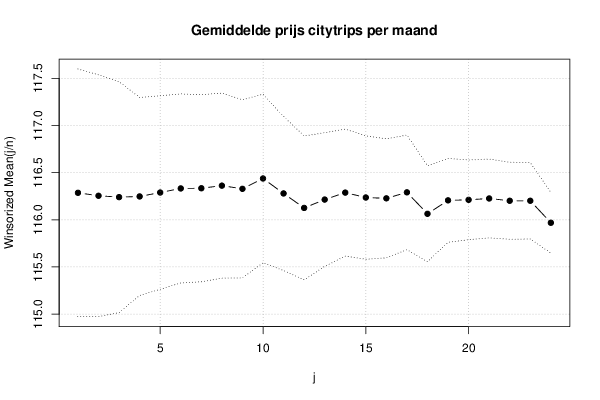
Winsorized Mean ( 1 / 24 )116.2865277777780.65675245977184177.062949742398
Winsorized Mean ( 2 / 24 )116.2551388888890.641009082997848181.36270136016
Winsorized Mean ( 3 / 24 )116.2405555555560.612444909498746189.797569957259
Winsorized Mean ( 4 / 24 )116.2477777777780.525048966425842221.403688439022
Winsorized Mean ( 5 / 24 )116.2894444444440.512987082514403226.69078502806
Winsorized Mean ( 6 / 24 )116.3327777777780.501210671294665232.103553336726
Winsorized Mean ( 7 / 24 )116.3347222222220.496012305342265234.539992192225
Winsorized Mean ( 8 / 24 )116.36250.490635018163719237.167131762232
Winsorized Mean ( 9 / 24 )116.328750.4722575446492246.324810091516
Winsorized Mean ( 10 / 24 )116.4384722222220.446905315149649260.543941356419
Winsorized Mean ( 11 / 24 )116.2795833333330.408653387911427284.543299463692
Winsorized Mean ( 12 / 24 )116.126250.381454286067354304.43031902254
Winsorized Mean ( 13 / 24 )116.2147222222220.354605401944904327.729700632928
Winsorized Mean ( 14 / 24 )116.2886111111110.336526333042174345.555755057473
Winsorized Mean ( 15 / 24 )116.2365277777780.327258204933792355.182929030897
Winsorized Mean ( 16 / 24 )116.2276388888890.315457568967801368.441433404796
Winsorized Mean ( 17 / 24 )116.2913888888890.304036183701589382.491937219646
Winsorized Mean ( 18 / 24 )116.0638888888890.254421430508243456.187549362626
Winsorized Mean ( 19 / 24 )116.2063888888890.222270287740023522.815667673985
Winsorized Mean ( 20 / 24 )116.2119444444440.211455167604036549.581955178599
Winsorized Mean ( 21 / 24 )116.2265277777780.208762671194543556.739991458855
Winsorized Mean ( 22 / 24 )116.2020833333330.204336011736767568.681371167355
Winsorized Mean ( 23 / 24 )116.2020833333330.202580181531016573.610322861431
Winsorized Mean ( 24 / 24 )115.968750.160703161642737721.633282223859
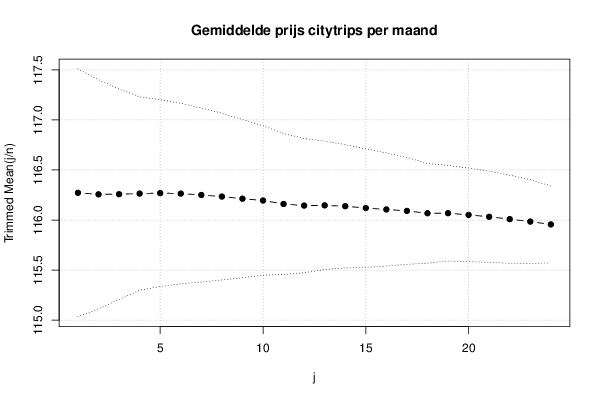
Trimmed Mean ( 1 / 24 )116.2721428571430.618457738943826188.003376036182
Trimmed Mean ( 2 / 24 )116.2569117647060.571855115331087203.29784354101
Trimmed Mean ( 3 / 24 )116.2578787878790.525481487064156221.24067479029
Trimmed Mean ( 4 / 24 )116.2643750.482919305171723240.753214367061
Trimmed Mean ( 5 / 24 )116.2691935483870.466504395533066249.234936823111
Trimmed Mean ( 6 / 24 )116.2643333333330.450554483663773258.047223030402
Trimmed Mean ( 7 / 24 )116.2501724137930.434550862372944267.517988064707
Trimmed Mean ( 8 / 24 )116.2346428571430.416273118720393279.226876850572
Trimmed Mean ( 9 / 24 )116.2133333333330.394951190714524294.247329962689
Trimmed Mean ( 10 / 24 )116.1955769230770.373133607167734311.404748033977
Trimmed Mean ( 11 / 24 )116.16060.35200468572948329.997311709852
Trimmed Mean ( 12 / 24 )116.1443750.335183328984685346.509999025957
Trimmed Mean ( 13 / 24 )116.1467391304350.320469018353456362.427356401525
Trimmed Mean ( 14 / 24 )116.1381818181820.307986757479944377.088231872257
Trimmed Mean ( 15 / 24 )116.1197619047620.295929898802494392.389421868661
Trimmed Mean ( 16 / 24 )116.105750.282258039675646411.346121915329
Trimmed Mean ( 17 / 24 )116.0913157894740.266934329261626434.905904049871
Trimmed Mean ( 18 / 24 )116.0677777777780.248950212116549466.22887681429
Trimmed Mean ( 19 / 24 )116.0682352941180.238916325938689485.811234699395
Trimmed Mean ( 20 / 24 )116.0518750.233405899694281497.210546742849
Trimmed Mean ( 21 / 24 )116.0326666666670.22796598522906508.991139840785
Trimmed Mean ( 22 / 24 )116.0089285714290.220064528346647527.158690421432
Trimmed Mean ( 23 / 24 )115.9846153846150.209161866482714554.520847107668
Trimmed Mean ( 24 / 24 )115.956250.192167096389529603.413654983644
Median116.065
Midrange119.485
Midmean - Weighted Average at Xnp115.990810810811
Midmean - Weighted Average at X(n+1)p116.067777777778
Midmean - Empirical Distribution Function115.990810810811
Midmean - Empirical Distribution Function - Averaging116.067777777778
Midmean - Empirical Distribution Function - Interpolation116.067777777778
Midmean - Closest Observation115.990810810811
Midmean - True Basic - Statistics Graphics Toolkit116.067777777778
Midmean - MS Excel (old versions)116.091315789474
Number of observations72

\begin{tabular}{lllllllll}
\hline
Central Tendency - Ungrouped Data \tabularnewline
Measure & Value & S.E. & Value/S.E. \tabularnewline
Arithmetic Mean & 116.361388888889 & 0.688171987864146 & 169.087656778991 \tabularnewline
Geometric Mean & 116.218202558477 &  &  \tabularnewline
Harmonic Mean & 116.076007757827 &  &  \tabularnewline
Quadratic Mean & 116.505781198951 &  &  \tabularnewline
Winsorized Mean ( 1 / 24 ) & 116.286527777778 & 0.65675245977184 & 177.062949742398 \tabularnewline
Winsorized Mean ( 2 / 24 ) & 116.255138888889 & 0.641009082997848 & 181.36270136016 \tabularnewline
Winsorized Mean ( 3 / 24 ) & 116.240555555556 & 0.612444909498746 & 189.797569957259 \tabularnewline
Winsorized Mean ( 4 / 24 ) & 116.247777777778 & 0.525048966425842 & 221.403688439022 \tabularnewline
Winsorized Mean ( 5 / 24 ) & 116.289444444444 & 0.512987082514403 & 226.69078502806 \tabularnewline
Winsorized Mean ( 6 / 24 ) & 116.332777777778 & 0.501210671294665 & 232.103553336726 \tabularnewline
Winsorized Mean ( 7 / 24 ) & 116.334722222222 & 0.496012305342265 & 234.539992192225 \tabularnewline
Winsorized Mean ( 8 / 24 ) & 116.3625 & 0.490635018163719 & 237.167131762232 \tabularnewline
Winsorized Mean ( 9 / 24 ) & 116.32875 & 0.4722575446492 & 246.324810091516 \tabularnewline
Winsorized Mean ( 10 / 24 ) & 116.438472222222 & 0.446905315149649 & 260.543941356419 \tabularnewline
Winsorized Mean ( 11 / 24 ) & 116.279583333333 & 0.408653387911427 & 284.543299463692 \tabularnewline
Winsorized Mean ( 12 / 24 ) & 116.12625 & 0.381454286067354 & 304.43031902254 \tabularnewline
Winsorized Mean ( 13 / 24 ) & 116.214722222222 & 0.354605401944904 & 327.729700632928 \tabularnewline
Winsorized Mean ( 14 / 24 ) & 116.288611111111 & 0.336526333042174 & 345.555755057473 \tabularnewline
Winsorized Mean ( 15 / 24 ) & 116.236527777778 & 0.327258204933792 & 355.182929030897 \tabularnewline
Winsorized Mean ( 16 / 24 ) & 116.227638888889 & 0.315457568967801 & 368.441433404796 \tabularnewline
Winsorized Mean ( 17 / 24 ) & 116.291388888889 & 0.304036183701589 & 382.491937219646 \tabularnewline
Winsorized Mean ( 18 / 24 ) & 116.063888888889 & 0.254421430508243 & 456.187549362626 \tabularnewline
Winsorized Mean ( 19 / 24 ) & 116.206388888889 & 0.222270287740023 & 522.815667673985 \tabularnewline
Winsorized Mean ( 20 / 24 ) & 116.211944444444 & 0.211455167604036 & 549.581955178599 \tabularnewline
Winsorized Mean ( 21 / 24 ) & 116.226527777778 & 0.208762671194543 & 556.739991458855 \tabularnewline
Winsorized Mean ( 22 / 24 ) & 116.202083333333 & 0.204336011736767 & 568.681371167355 \tabularnewline
Winsorized Mean ( 23 / 24 ) & 116.202083333333 & 0.202580181531016 & 573.610322861431 \tabularnewline
Winsorized Mean ( 24 / 24 ) & 115.96875 & 0.160703161642737 & 721.633282223859 \tabularnewline
Trimmed Mean ( 1 / 24 ) & 116.272142857143 & 0.618457738943826 & 188.003376036182 \tabularnewline
Trimmed Mean ( 2 / 24 ) & 116.256911764706 & 0.571855115331087 & 203.29784354101 \tabularnewline
Trimmed Mean ( 3 / 24 ) & 116.257878787879 & 0.525481487064156 & 221.24067479029 \tabularnewline
Trimmed Mean ( 4 / 24 ) & 116.264375 & 0.482919305171723 & 240.753214367061 \tabularnewline
Trimmed Mean ( 5 / 24 ) & 116.269193548387 & 0.466504395533066 & 249.234936823111 \tabularnewline
Trimmed Mean ( 6 / 24 ) & 116.264333333333 & 0.450554483663773 & 258.047223030402 \tabularnewline
Trimmed Mean ( 7 / 24 ) & 116.250172413793 & 0.434550862372944 & 267.517988064707 \tabularnewline
Trimmed Mean ( 8 / 24 ) & 116.234642857143 & 0.416273118720393 & 279.226876850572 \tabularnewline
Trimmed Mean ( 9 / 24 ) & 116.213333333333 & 0.394951190714524 & 294.247329962689 \tabularnewline
Trimmed Mean ( 10 / 24 ) & 116.195576923077 & 0.373133607167734 & 311.404748033977 \tabularnewline
Trimmed Mean ( 11 / 24 ) & 116.1606 & 0.35200468572948 & 329.997311709852 \tabularnewline
Trimmed Mean ( 12 / 24 ) & 116.144375 & 0.335183328984685 & 346.509999025957 \tabularnewline
Trimmed Mean ( 13 / 24 ) & 116.146739130435 & 0.320469018353456 & 362.427356401525 \tabularnewline
Trimmed Mean ( 14 / 24 ) & 116.138181818182 & 0.307986757479944 & 377.088231872257 \tabularnewline
Trimmed Mean ( 15 / 24 ) & 116.119761904762 & 0.295929898802494 & 392.389421868661 \tabularnewline
Trimmed Mean ( 16 / 24 ) & 116.10575 & 0.282258039675646 & 411.346121915329 \tabularnewline
Trimmed Mean ( 17 / 24 ) & 116.091315789474 & 0.266934329261626 & 434.905904049871 \tabularnewline
Trimmed Mean ( 18 / 24 ) & 116.067777777778 & 0.248950212116549 & 466.22887681429 \tabularnewline
Trimmed Mean ( 19 / 24 ) & 116.068235294118 & 0.238916325938689 & 485.811234699395 \tabularnewline
Trimmed Mean ( 20 / 24 ) & 116.051875 & 0.233405899694281 & 497.210546742849 \tabularnewline
Trimmed Mean ( 21 / 24 ) & 116.032666666667 & 0.22796598522906 & 508.991139840785 \tabularnewline
Trimmed Mean ( 22 / 24 ) & 116.008928571429 & 0.220064528346647 & 527.158690421432 \tabularnewline
Trimmed Mean ( 23 / 24 ) & 115.984615384615 & 0.209161866482714 & 554.520847107668 \tabularnewline
Trimmed Mean ( 24 / 24 ) & 115.95625 & 0.192167096389529 & 603.413654983644 \tabularnewline
Median & 116.065 &  &  \tabularnewline
Midrange & 119.485 &  &  \tabularnewline
Midmean - Weighted Average at Xnp & 115.990810810811 &  &  \tabularnewline
Midmean - Weighted Average at X(n+1)p & 116.067777777778 &  &  \tabularnewline
Midmean - Empirical Distribution Function & 115.990810810811 &  &  \tabularnewline
Midmean - Empirical Distribution Function - Averaging & 116.067777777778 &  &  \tabularnewline
Midmean - Empirical Distribution Function - Interpolation & 116.067777777778 &  &  \tabularnewline
Midmean - Closest Observation & 115.990810810811 &  &  \tabularnewline
Midmean - True Basic - Statistics Graphics Toolkit & 116.067777777778 &  &  \tabularnewline
Midmean - MS Excel (old versions) & 116.091315789474 &  &  \tabularnewline
Number of observations & 72 &  &  \tabularnewline
\hline
\end{tabular}
%Source: https://freestatistics.org/blog/index.php?pk=240696&T=1

[TABLE]
[ROW][C]Central Tendency - Ungrouped Data[/C][/ROW]
[ROW][C]Measure[/C][C]Value[/C][C]S.E.[/C][C]Value/S.E.[/C][/ROW]
[ROW][C]Arithmetic Mean[/C][C]116.361388888889[/C][C]0.688171987864146[/C][C]169.087656778991[/C][/ROW]
[ROW][C]Geometric Mean[/C][C]116.218202558477[/C][C][/C][C][/C][/ROW]
[ROW][C]Harmonic Mean[/C][C]116.076007757827[/C][C][/C][C][/C][/ROW]
[ROW][C]Quadratic Mean[/C][C]116.505781198951[/C][C][/C][C][/C][/ROW]
[ROW][C]Winsorized Mean ( 1 / 24 )[/C][C]116.286527777778[/C][C]0.65675245977184[/C][C]177.062949742398[/C][/ROW]
[ROW][C]Winsorized Mean ( 2 / 24 )[/C][C]116.255138888889[/C][C]0.641009082997848[/C][C]181.36270136016[/C][/ROW]
[ROW][C]Winsorized Mean ( 3 / 24 )[/C][C]116.240555555556[/C][C]0.612444909498746[/C][C]189.797569957259[/C][/ROW]
[ROW][C]Winsorized Mean ( 4 / 24 )[/C][C]116.247777777778[/C][C]0.525048966425842[/C][C]221.403688439022[/C][/ROW]
[ROW][C]Winsorized Mean ( 5 / 24 )[/C][C]116.289444444444[/C][C]0.512987082514403[/C][C]226.69078502806[/C][/ROW]
[ROW][C]Winsorized Mean ( 6 / 24 )[/C][C]116.332777777778[/C][C]0.501210671294665[/C][C]232.103553336726[/C][/ROW]
[ROW][C]Winsorized Mean ( 7 / 24 )[/C][C]116.334722222222[/C][C]0.496012305342265[/C][C]234.539992192225[/C][/ROW]
[ROW][C]Winsorized Mean ( 8 / 24 )[/C][C]116.3625[/C][C]0.490635018163719[/C][C]237.167131762232[/C][/ROW]
[ROW][C]Winsorized Mean ( 9 / 24 )[/C][C]116.32875[/C][C]0.4722575446492[/C][C]246.324810091516[/C][/ROW]
[ROW][C]Winsorized Mean ( 10 / 24 )[/C][C]116.438472222222[/C][C]0.446905315149649[/C][C]260.543941356419[/C][/ROW]
[ROW][C]Winsorized Mean ( 11 / 24 )[/C][C]116.279583333333[/C][C]0.408653387911427[/C][C]284.543299463692[/C][/ROW]
[ROW][C]Winsorized Mean ( 12 / 24 )[/C][C]116.12625[/C][C]0.381454286067354[/C][C]304.43031902254[/C][/ROW]
[ROW][C]Winsorized Mean ( 13 / 24 )[/C][C]116.214722222222[/C][C]0.354605401944904[/C][C]327.729700632928[/C][/ROW]
[ROW][C]Winsorized Mean ( 14 / 24 )[/C][C]116.288611111111[/C][C]0.336526333042174[/C][C]345.555755057473[/C][/ROW]
[ROW][C]Winsorized Mean ( 15 / 24 )[/C][C]116.236527777778[/C][C]0.327258204933792[/C][C]355.182929030897[/C][/ROW]
[ROW][C]Winsorized Mean ( 16 / 24 )[/C][C]116.227638888889[/C][C]0.315457568967801[/C][C]368.441433404796[/C][/ROW]
[ROW][C]Winsorized Mean ( 17 / 24 )[/C][C]116.291388888889[/C][C]0.304036183701589[/C][C]382.491937219646[/C][/ROW]
[ROW][C]Winsorized Mean ( 18 / 24 )[/C][C]116.063888888889[/C][C]0.254421430508243[/C][C]456.187549362626[/C][/ROW]
[ROW][C]Winsorized Mean ( 19 / 24 )[/C][C]116.206388888889[/C][C]0.222270287740023[/C][C]522.815667673985[/C][/ROW]
[ROW][C]Winsorized Mean ( 20 / 24 )[/C][C]116.211944444444[/C][C]0.211455167604036[/C][C]549.581955178599[/C][/ROW]
[ROW][C]Winsorized Mean ( 21 / 24 )[/C][C]116.226527777778[/C][C]0.208762671194543[/C][C]556.739991458855[/C][/ROW]
[ROW][C]Winsorized Mean ( 22 / 24 )[/C][C]116.202083333333[/C][C]0.204336011736767[/C][C]568.681371167355[/C][/ROW]
[ROW][C]Winsorized Mean ( 23 / 24 )[/C][C]116.202083333333[/C][C]0.202580181531016[/C][C]573.610322861431[/C][/ROW]
[ROW][C]Winsorized Mean ( 24 / 24 )[/C][C]115.96875[/C][C]0.160703161642737[/C][C]721.633282223859[/C][/ROW]
[ROW][C]Trimmed Mean ( 1 / 24 )[/C][C]116.272142857143[/C][C]0.618457738943826[/C][C]188.003376036182[/C][/ROW]
[ROW][C]Trimmed Mean ( 2 / 24 )[/C][C]116.256911764706[/C][C]0.571855115331087[/C][C]203.29784354101[/C][/ROW]
[ROW][C]Trimmed Mean ( 3 / 24 )[/C][C]116.257878787879[/C][C]0.525481487064156[/C][C]221.24067479029[/C][/ROW]
[ROW][C]Trimmed Mean ( 4 / 24 )[/C][C]116.264375[/C][C]0.482919305171723[/C][C]240.753214367061[/C][/ROW]
[ROW][C]Trimmed Mean ( 5 / 24 )[/C][C]116.269193548387[/C][C]0.466504395533066[/C][C]249.234936823111[/C][/ROW]
[ROW][C]Trimmed Mean ( 6 / 24 )[/C][C]116.264333333333[/C][C]0.450554483663773[/C][C]258.047223030402[/C][/ROW]
[ROW][C]Trimmed Mean ( 7 / 24 )[/C][C]116.250172413793[/C][C]0.434550862372944[/C][C]267.517988064707[/C][/ROW]
[ROW][C]Trimmed Mean ( 8 / 24 )[/C][C]116.234642857143[/C][C]0.416273118720393[/C][C]279.226876850572[/C][/ROW]
[ROW][C]Trimmed Mean ( 9 / 24 )[/C][C]116.213333333333[/C][C]0.394951190714524[/C][C]294.247329962689[/C][/ROW]
[ROW][C]Trimmed Mean ( 10 / 24 )[/C][C]116.195576923077[/C][C]0.373133607167734[/C][C]311.404748033977[/C][/ROW]
[ROW][C]Trimmed Mean ( 11 / 24 )[/C][C]116.1606[/C][C]0.35200468572948[/C][C]329.997311709852[/C][/ROW]
[ROW][C]Trimmed Mean ( 12 / 24 )[/C][C]116.144375[/C][C]0.335183328984685[/C][C]346.509999025957[/C][/ROW]
[ROW][C]Trimmed Mean ( 13 / 24 )[/C][C]116.146739130435[/C][C]0.320469018353456[/C][C]362.427356401525[/C][/ROW]
[ROW][C]Trimmed Mean ( 14 / 24 )[/C][C]116.138181818182[/C][C]0.307986757479944[/C][C]377.088231872257[/C][/ROW]
[ROW][C]Trimmed Mean ( 15 / 24 )[/C][C]116.119761904762[/C][C]0.295929898802494[/C][C]392.389421868661[/C][/ROW]
[ROW][C]Trimmed Mean ( 16 / 24 )[/C][C]116.10575[/C][C]0.282258039675646[/C][C]411.346121915329[/C][/ROW]
[ROW][C]Trimmed Mean ( 17 / 24 )[/C][C]116.091315789474[/C][C]0.266934329261626[/C][C]434.905904049871[/C][/ROW]
[ROW][C]Trimmed Mean ( 18 / 24 )[/C][C]116.067777777778[/C][C]0.248950212116549[/C][C]466.22887681429[/C][/ROW]
[ROW][C]Trimmed Mean ( 19 / 24 )[/C][C]116.068235294118[/C][C]0.238916325938689[/C][C]485.811234699395[/C][/ROW]
[ROW][C]Trimmed Mean ( 20 / 24 )[/C][C]116.051875[/C][C]0.233405899694281[/C][C]497.210546742849[/C][/ROW]
[ROW][C]Trimmed Mean ( 21 / 24 )[/C][C]116.032666666667[/C][C]0.22796598522906[/C][C]508.991139840785[/C][/ROW]
[ROW][C]Trimmed Mean ( 22 / 24 )[/C][C]116.008928571429[/C][C]0.220064528346647[/C][C]527.158690421432[/C][/ROW]
[ROW][C]Trimmed Mean ( 23 / 24 )[/C][C]115.984615384615[/C][C]0.209161866482714[/C][C]554.520847107668[/C][/ROW]
[ROW][C]Trimmed Mean ( 24 / 24 )[/C][C]115.95625[/C][C]0.192167096389529[/C][C]603.413654983644[/C][/ROW]
[ROW][C]Median[/C][C]116.065[/C][C][/C][C][/C][/ROW]
[ROW][C]Midrange[/C][C]119.485[/C][C][/C][C][/C][/ROW]
[ROW][C]Midmean - Weighted Average at Xnp[/C][C]115.990810810811[/C][C][/C][C][/C][/ROW]
[ROW][C]Midmean - Weighted Average at X(n+1)p[/C][C]116.067777777778[/C][C][/C][C][/C][/ROW]
[ROW][C]Midmean - Empirical Distribution Function[/C][C]115.990810810811[/C][C][/C][C][/C][/ROW]
[ROW][C]Midmean - Empirical Distribution Function - Averaging[/C][C]116.067777777778[/C][C][/C][C][/C][/ROW]
[ROW][C]Midmean - Empirical Distribution Function - Interpolation[/C][C]116.067777777778[/C][C][/C][C][/C][/ROW]
[ROW][C]Midmean - Closest Observation[/C][C]115.990810810811[/C][C][/C][C][/C][/ROW]
[ROW][C]Midmean - True Basic - Statistics Graphics Toolkit[/C][C]116.067777777778[/C][C][/C][C][/C][/ROW]
[ROW][C]Midmean - MS Excel (old versions)[/C][C]116.091315789474[/C][C][/C][C][/C][/ROW]
[ROW][C]Number of observations[/C][C]72[/C][C][/C][C][/C][/ROW]
[/TABLE]
Source: https://freestatistics.org/blog/index.php?pk=240696&T=1

Globally Unique Identifier (entire table): ba.freestatistics.org/blog/index.php?pk=240696&T=1

As an alternative you can also use a QR Code:  

The GUIDs for individual cells are displayed in the table below:

Central Tendency - Ungrouped Data
MeasureValueS.E.Value/S.E.
Arithmetic Mean116.3613888888890.688171987864146169.087656778991
Geometric Mean116.218202558477
Harmonic Mean116.076007757827
Quadratic Mean116.505781198951
Winsorized Mean ( 1 / 24 )116.2865277777780.65675245977184177.062949742398
Winsorized Mean ( 2 / 24 )116.2551388888890.641009082997848181.36270136016
Winsorized Mean ( 3 / 24 )116.2405555555560.612444909498746189.797569957259
Winsorized Mean ( 4 / 24 )116.2477777777780.525048966425842221.403688439022
Winsorized Mean ( 5 / 24 )116.2894444444440.512987082514403226.69078502806
Winsorized Mean ( 6 / 24 )116.3327777777780.501210671294665232.103553336726
Winsorized Mean ( 7 / 24 )116.3347222222220.496012305342265234.539992192225
Winsorized Mean ( 8 / 24 )116.36250.490635018163719237.167131762232
Winsorized Mean ( 9 / 24 )116.328750.4722575446492246.324810091516
Winsorized Mean ( 10 / 24 )116.4384722222220.446905315149649260.543941356419
Winsorized Mean ( 11 / 24 )116.2795833333330.408653387911427284.543299463692
Winsorized Mean ( 12 / 24 )116.126250.381454286067354304.43031902254
Winsorized Mean ( 13 / 24 )116.2147222222220.354605401944904327.729700632928
Winsorized Mean ( 14 / 24 )116.2886111111110.336526333042174345.555755057473
Winsorized Mean ( 15 / 24 )116.2365277777780.327258204933792355.182929030897
Winsorized Mean ( 16 / 24 )116.2276388888890.315457568967801368.441433404796
Winsorized Mean ( 17 / 24 )116.2913888888890.304036183701589382.491937219646
Winsorized Mean ( 18 / 24 )116.0638888888890.254421430508243456.187549362626
Winsorized Mean ( 19 / 24 )116.2063888888890.222270287740023522.815667673985
Winsorized Mean ( 20 / 24 )116.2119444444440.211455167604036549.581955178599
Winsorized Mean ( 21 / 24 )116.2265277777780.208762671194543556.739991458855
Winsorized Mean ( 22 / 24 )116.2020833333330.204336011736767568.681371167355
Winsorized Mean ( 23 / 24 )116.2020833333330.202580181531016573.610322861431
Winsorized Mean ( 24 / 24 )115.968750.160703161642737721.633282223859
Trimmed Mean ( 1 / 24 )116.2721428571430.618457738943826188.003376036182
Trimmed Mean ( 2 / 24 )116.2569117647060.571855115331087203.29784354101
Trimmed Mean ( 3 / 24 )116.2578787878790.525481487064156221.24067479029
Trimmed Mean ( 4 / 24 )116.2643750.482919305171723240.753214367061
Trimmed Mean ( 5 / 24 )116.2691935483870.466504395533066249.234936823111
Trimmed Mean ( 6 / 24 )116.2643333333330.450554483663773258.047223030402
Trimmed Mean ( 7 / 24 )116.2501724137930.434550862372944267.517988064707
Trimmed Mean ( 8 / 24 )116.2346428571430.416273118720393279.226876850572
Trimmed Mean ( 9 / 24 )116.2133333333330.394951190714524294.247329962689
Trimmed Mean ( 10 / 24 )116.1955769230770.373133607167734311.404748033977
Trimmed Mean ( 11 / 24 )116.16060.35200468572948329.997311709852
Trimmed Mean ( 12 / 24 )116.1443750.335183328984685346.509999025957
Trimmed Mean ( 13 / 24 )116.1467391304350.320469018353456362.427356401525
Trimmed Mean ( 14 / 24 )116.1381818181820.307986757479944377.088231872257
Trimmed Mean ( 15 / 24 )116.1197619047620.295929898802494392.389421868661
Trimmed Mean ( 16 / 24 )116.105750.282258039675646411.346121915329
Trimmed Mean ( 17 / 24 )116.0913157894740.266934329261626434.905904049871
Trimmed Mean ( 18 / 24 )116.0677777777780.248950212116549466.22887681429
Trimmed Mean ( 19 / 24 )116.0682352941180.238916325938689485.811234699395
Trimmed Mean ( 20 / 24 )116.0518750.233405899694281497.210546742849
Trimmed Mean ( 21 / 24 )116.0326666666670.22796598522906508.991139840785
Trimmed Mean ( 22 / 24 )116.0089285714290.220064528346647527.158690421432
Trimmed Mean ( 23 / 24 )115.9846153846150.209161866482714554.520847107668
Trimmed Mean ( 24 / 24 )115.956250.192167096389529603.413654983644
Median116.065
Midrange119.485
Midmean - Weighted Average at Xnp115.990810810811
Midmean - Weighted Average at X(n+1)p116.067777777778
Midmean - Empirical Distribution Function115.990810810811
Midmean - Empirical Distribution Function - Averaging116.067777777778
Midmean - Empirical Distribution Function - Interpolation116.067777777778
Midmean - Closest Observation115.990810810811
Midmean - True Basic - Statistics Graphics Toolkit116.067777777778
Midmean - MS Excel (old versions)116.091315789474
Number of observations72


Parameters (Session):
Parameters (R input):
R code (references can be found in the software module):
geomean <- function(x) {
return(exp(mean(log(x))))
}
harmean <- function(x) {
return(1/mean(1/x))
}
quamean <- function(x) {
return(sqrt(mean(x*x)))
}
winmean <- function(x) {
x <-sort(x[!is.na(x)])
n<-length(x)
denom <- 3
nodenom <- n/denom
if (nodenom>40) denom <- n/40
sqrtn = sqrt(n)
roundnodenom = floor(nodenom)
win <- array(NA,dim=c(roundnodenom,2))
for (j in 1:roundnodenom) {
win[j,1] <- (j*x[j+1]+sum(x[(j+1):(n-j)])+j*x[n-j])/n
win[j,2] <- sd(c(rep(x[j+1],j),x[(j+1):(n-j)],rep(x[n-j],j)))/sqrtn
}
return(win)
}
trimean <- function(x) {
x <-sort(x[!is.na(x)])
n<-length(x)
denom <- 3
nodenom <- n/denom
if (nodenom>40) denom <- n/40
sqrtn = sqrt(n)
roundnodenom = floor(nodenom)
tri <- array(NA,dim=c(roundnodenom,2))
for (j in 1:roundnodenom) {
tri[j,1] <- mean(x,trim=j/n)
tri[j,2] <- sd(x[(j+1):(n-j)]) / sqrt(n-j*2)
}
return(tri)
}
midrange <- function(x) {
return((max(x)+min(x))/2)
}
q1 <- function(data,n,p,i,f) {
np <- n*p;
i <<- floor(np)
f <<- np - i
qvalue <- (1-f)*data[i] + f*data[i+1]
}
q2 <- function(data,n,p,i,f) {
np <- (n+1)*p
i <<- floor(np)
f <<- np - i
qvalue <- (1-f)*data[i] + f*data[i+1]
}
q3 <- function(data,n,p,i,f) {
np <- n*p
i <<- floor(np)
f <<- np - i
if (f==0) {
qvalue <- data[i]
} else {
qvalue <- data[i+1]
}
}
q4 <- function(data,n,p,i,f) {
np <- n*p
i <<- floor(np)
f <<- np - i
if (f==0) {
qvalue <- (data[i]+data[i+1])/2
} else {
qvalue <- data[i+1]
}
}
q5 <- function(data,n,p,i,f) {
np <- (n-1)*p
i <<- floor(np)
f <<- np - i
if (f==0) {
qvalue <- data[i+1]
} else {
qvalue <- data[i+1] + f*(data[i+2]-data[i+1])
}
}
q6 <- function(data,n,p,i,f) {
np <- n*p+0.5
i <<- floor(np)
f <<- np - i
qvalue <- data[i]
}
q7 <- function(data,n,p,i,f) {
np <- (n+1)*p
i <<- floor(np)
f <<- np - i
if (f==0) {
qvalue <- data[i]
} else {
qvalue <- f*data[i] + (1-f)*data[i+1]
}
}
q8 <- function(data,n,p,i,f) {
np <- (n+1)*p
i <<- floor(np)
f <<- np - i
if (f==0) {
qvalue <- data[i]
} else {
if (f == 0.5) {
qvalue <- (data[i]+data[i+1])/2
} else {
if (f < 0.5) {
qvalue <- data[i]
} else {
qvalue <- data[i+1]
}
}
}
}
midmean <- function(x,def) {
x <-sort(x[!is.na(x)])
n<-length(x)
if (def==1) {
qvalue1 <- q1(x,n,0.25,i,f)
qvalue3 <- q1(x,n,0.75,i,f)
}
if (def==2) {
qvalue1 <- q2(x,n,0.25,i,f)
qvalue3 <- q2(x,n,0.75,i,f)
}
if (def==3) {
qvalue1 <- q3(x,n,0.25,i,f)
qvalue3 <- q3(x,n,0.75,i,f)
}
if (def==4) {
qvalue1 <- q4(x,n,0.25,i,f)
qvalue3 <- q4(x,n,0.75,i,f)
}
if (def==5) {
qvalue1 <- q5(x,n,0.25,i,f)
qvalue3 <- q5(x,n,0.75,i,f)
}
if (def==6) {
qvalue1 <- q6(x,n,0.25,i,f)
qvalue3 <- q6(x,n,0.75,i,f)
}
if (def==7) {
qvalue1 <- q7(x,n,0.25,i,f)
qvalue3 <- q7(x,n,0.75,i,f)
}
if (def==8) {
qvalue1 <- q8(x,n,0.25,i,f)
qvalue3 <- q8(x,n,0.75,i,f)
}
midm <- 0
myn <- 0
roundno4 <- round(n/4)
round3no4 <- round(3*n/4)
for (i in 1:n) {
if ((x[i]>=qvalue1) & (x[i]<=qvalue3)){
midm = midm + x[i]
myn = myn + 1
}
}
midm = midm / myn
return(midm)
}
(arm <- mean(x))
sqrtn <- sqrt(length(x))
(armse <- sd(x) / sqrtn)
(armose <- arm / armse)
(geo <- geomean(x))
(har <- harmean(x))
(qua <- quamean(x))
(win <- winmean(x))
(tri <- trimean(x))
(midr <- midrange(x))
midm <- array(NA,dim=8)
for (j in 1:8) midm[j] <- midmean(x,j)
midm
bitmap(file='test1.png')
lb <- win[,1] - 2*win[,2]
ub <- win[,1] + 2*win[,2]
if ((ylimmin == '') | (ylimmax == '')) plot(win[,1],type='b',main=main, xlab='j', pch=19, ylab='Winsorized Mean(j/n)', ylim=c(min(lb),max(ub))) else plot(win[,1],type='l',main=main, xlab='j', pch=19, ylab='Winsorized Mean(j/n)', ylim=c(ylimmin,ylimmax))
lines(ub,lty=3)
lines(lb,lty=3)
grid()
dev.off()
bitmap(file='test2.png')
lb <- tri[,1] - 2*tri[,2]
ub <- tri[,1] + 2*tri[,2]
if ((ylimmin == '') | (ylimmax == '')) plot(tri[,1],type='b',main=main, xlab='j', pch=19, ylab='Trimmed Mean(j/n)', ylim=c(min(lb),max(ub))) else plot(tri[,1],type='l',main=main, xlab='j', pch=19, ylab='Trimmed Mean(j/n)', ylim=c(ylimmin,ylimmax))
lines(ub,lty=3)
lines(lb,lty=3)
grid()
dev.off()
load(file='createtable')
a<-table.start()
a<-table.row.start(a)
a<-table.element(a,'Central Tendency - Ungrouped Data',4,TRUE)
a<-table.row.end(a)
a<-table.row.start(a)
a<-table.element(a,'Measure',header=TRUE)
a<-table.element(a,'Value',header=TRUE)
a<-table.element(a,'S.E.',header=TRUE)
a<-table.element(a,'Value/S.E.',header=TRUE)
a<-table.row.end(a)
a<-table.row.start(a)
a<-table.element(a,hyperlink('arithmetic_mean.htm', 'Arithmetic Mean', 'click to view the definition of the Arithmetic Mean'),header=TRUE)
a<-table.element(a,arm)
a<-table.element(a,hyperlink('arithmetic_mean_standard_error.htm', armse, 'click to view the definition of the Standard Error of the Arithmetic Mean'))
a<-table.element(a,armose)
a<-table.row.end(a)
a<-table.row.start(a)
a<-table.element(a,hyperlink('geometric_mean.htm', 'Geometric Mean', 'click to view the definition of the Geometric Mean'),header=TRUE)
a<-table.element(a,geo)
a<-table.element(a,'')
a<-table.row.end(a)
a<-table.row.start(a)
a<-table.element(a,hyperlink('harmonic_mean.htm', 'Harmonic Mean', 'click to view the definition of the Harmonic Mean'),header=TRUE)
a<-table.element(a,har)
a<-table.element(a,'')
a<-table.row.end(a)
a<-table.row.start(a)
a<-table.element(a,hyperlink('quadratic_mean.htm', 'Quadratic Mean', 'click to view the definition of the Quadratic Mean'),header=TRUE)
a<-table.element(a,qua)
a<-table.element(a,'')
a<-table.row.end(a)
for (j in 1:length(win[,1])) {
a<-table.row.start(a)
mylabel <- paste('Winsorized Mean (',j)
mylabel <- paste(mylabel,'/')
mylabel <- paste(mylabel,length(win[,1]))
mylabel <- paste(mylabel,')')
a<-table.element(a,hyperlink('winsorized_mean.htm', mylabel, 'click to view the definition of the Winsorized Mean'),header=TRUE)
a<-table.element(a,win[j,1])
a<-table.element(a,win[j,2])
a<-table.element(a,win[j,1]/win[j,2])
a<-table.row.end(a)
}
for (j in 1:length(tri[,1])) {
a<-table.row.start(a)
mylabel <- paste('Trimmed Mean (',j)
mylabel <- paste(mylabel,'/')
mylabel <- paste(mylabel,length(tri[,1]))
mylabel <- paste(mylabel,')')
a<-table.element(a,hyperlink('arithmetic_mean.htm', mylabel, 'click to view the definition of the Trimmed Mean'),header=TRUE)
a<-table.element(a,tri[j,1])
a<-table.element(a,tri[j,2])
a<-table.element(a,tri[j,1]/tri[j,2])
a<-table.row.end(a)
}
a<-table.row.start(a)
a<-table.element(a,hyperlink('median_1.htm', 'Median', 'click to view the definition of the Median'),header=TRUE)
a<-table.element(a,median(x))
a<-table.element(a,'')
a<-table.row.end(a)
a<-table.row.start(a)
a<-table.element(a,hyperlink('midrange.htm', 'Midrange', 'click to view the definition of the Midrange'),header=TRUE)
a<-table.element(a,midr)
a<-table.element(a,'')
a<-table.row.end(a)
a<-table.row.start(a)
mymid <- hyperlink('midmean.htm', 'Midmean', 'click to view the definition of the Midmean')
mylabel <- paste(mymid,hyperlink('method_1.htm','Weighted Average at Xnp',''),sep=' - ')
a<-table.element(a,mylabel,header=TRUE)
a<-table.element(a,midm[1])
a<-table.element(a,'')
a<-table.row.end(a)
a<-table.row.start(a)
mymid <- hyperlink('midmean.htm', 'Midmean', 'click to view the definition of the Midmean')
mylabel <- paste(mymid,hyperlink('method_2.htm','Weighted Average at X(n+1)p',''),sep=' - ')
a<-table.element(a,mylabel,header=TRUE)
a<-table.element(a,midm[2])
a<-table.element(a,'')
a<-table.row.end(a)
a<-table.row.start(a)
mymid <- hyperlink('midmean.htm', 'Midmean', 'click to view the definition of the Midmean')
mylabel <- paste(mymid,hyperlink('method_3.htm','Empirical Distribution Function',''),sep=' - ')
a<-table.element(a,mylabel,header=TRUE)
a<-table.element(a,midm[3])
a<-table.element(a,'')
a<-table.row.end(a)
a<-table.row.start(a)
mymid <- hyperlink('midmean.htm', 'Midmean', 'click to view the definition of the Midmean')
mylabel <- paste(mymid,hyperlink('method_4.htm','Empirical Distribution Function - Averaging',''),sep=' - ')
a<-table.element(a,mylabel,header=TRUE)
a<-table.element(a,midm[4])
a<-table.element(a,'')
a<-table.row.end(a)
a<-table.row.start(a)
mymid <- hyperlink('midmean.htm', 'Midmean', 'click to view the definition of the Midmean')
mylabel <- paste(mymid,hyperlink('method_5.htm','Empirical Distribution Function - Interpolation',''),sep=' - ')
a<-table.element(a,mylabel,header=TRUE)
a<-table.element(a,midm[5])
a<-table.element(a,'')
a<-table.row.end(a)
a<-table.row.start(a)
mymid <- hyperlink('midmean.htm', 'Midmean', 'click to view the definition of the Midmean')
mylabel <- paste(mymid,hyperlink('method_6.htm','Closest Observation',''),sep=' - ')
a<-table.element(a,mylabel,header=TRUE)
a<-table.element(a,midm[6])
a<-table.element(a,'')
a<-table.row.end(a)
a<-table.row.start(a)
mymid <- hyperlink('midmean.htm', 'Midmean', 'click to view the definition of the Midmean')
mylabel <- paste(mymid,hyperlink('method_7.htm','True Basic - Statistics Graphics Toolkit',''),sep=' - ')
a<-table.element(a,mylabel,header=TRUE)
a<-table.element(a,midm[7])
a<-table.element(a,'')
a<-table.row.end(a)
a<-table.row.start(a)
mymid <- hyperlink('midmean.htm', 'Midmean', 'click to view the definition of the Midmean')
mylabel <- paste(mymid,hyperlink('method_8.htm','MS Excel (old versions)',''),sep=' - ')
a<-table.element(a,mylabel,header=TRUE)
a<-table.element(a,midm[8])
a<-table.element(a,'')
a<-table.row.end(a)
a<-table.row.start(a)
a<-table.element(a,'Number of observations',header=TRUE)
a<-table.element(a,length(x))
a<-table.element(a,'')
a<-table.row.end(a)
a<-table.end(a)
table.save(a,file='mytable.tab')