Free Statistics

of Irreproducible Research!

Author's title

Author*Unverified author*
R Software Modulerwasp_centraltendency.wasp
Title produced by softwareCentral Tendency
Date of computationSun, 12 Oct 2014 19:18:21 +0100
Cite this page as followsStatistical Computations at FreeStatistics.org, Office for Research Development and Education, URL https://freestatistics.org/blog/index.php?v=date/2014/Oct/12/t1413137929gljad3zbxhdopco.htm/, Retrieved Thu, 16 May 2024 01:32:15 +0000
Statistical Computations at FreeStatistics.org, Office for Research Development and Education, URL https://freestatistics.org/blog/index.php?pk=240651, Retrieved Thu, 16 May 2024 01:32:15 +0000
QR Codes:

Original text written by user:
IsPrivate?No (this computation is public)
User-defined keywords
Estimated Impact82
Family? (F = Feedback message, R = changed R code, M = changed R Module, P = changed Parameters, D = changed Data)
-       [Central Tendency] [] [2014-10-12 18:18:21] [517bf63cbd197750110a40d4d2cd39d6] [Current]
Feedback Forum

Post a new message
Dataseries X:
2745
1395
1550
1378
1318
1395
1483
1049
783
1208
857
48
2681
1249
1705
1472
1413
1651
1525
1095
900
1255
984
101
2655
1309
1844
1825
1629
1718
1595
1539
1513
1475
1184
211
3387
1546
1955
1899
2415
3439
1148
1127
1186
1009
817
236
2762
1035
1500
1519
1539
1452
1409
1288
987
1542
1248
1400
4190
2185
1097
1215
1236
1374
1548
1178
902


Summary of computational transaction
Raw Inputview raw input (R code)
Raw Outputview raw output of R engine
Computing time2 seconds
R Server'Sir Ronald Aylmer Fisher' @ fisher.wessa.net

\begin{tabular}{lllllllll}
\hline
Summary of computational transaction \tabularnewline
Raw Input & view raw input (R code)  \tabularnewline
Raw Output & view raw output of R engine  \tabularnewline
Computing time & 2 seconds \tabularnewline
R Server & 'Sir Ronald Aylmer Fisher' @ fisher.wessa.net \tabularnewline
\hline
\end{tabular}
%Source: https://freestatistics.org/blog/index.php?pk=240651&T=0

[TABLE]
[ROW][C]Summary of computational transaction[/C][/ROW]
[ROW][C]Raw Input[/C][C]view raw input (R code) [/C][/ROW]
[ROW][C]Raw Output[/C][C]view raw output of R engine [/C][/ROW]
[ROW][C]Computing time[/C][C]2 seconds[/C][/ROW]
[ROW][C]R Server[/C][C]'Sir Ronald Aylmer Fisher' @ fisher.wessa.net[/C][/ROW]
[/TABLE]
Source: https://freestatistics.org/blog/index.php?pk=240651&T=0

Globally Unique Identifier (entire table): ba.freestatistics.org/blog/index.php?pk=240651&T=0

As an alternative you can also use a QR Code:  

The GUIDs for individual cells are displayed in the table below:

Summary of computational transaction
Raw Inputview raw input (R code)
Raw Outputview raw output of R engine
Computing time2 seconds
R Server'Sir Ronald Aylmer Fisher' @ fisher.wessa.net


Central Tendency - Ungrouped Data
MeasureValueS.E.Value/S.E.
Arithmetic Mean1485.6086956521785.872611339455417.3001457912995
Geometric Mean1273.19906870469
Harmonic Mean798.619337066661
Quadratic Mean1645.74371100692
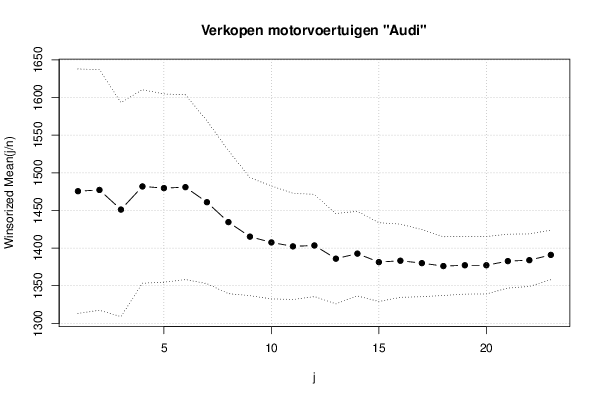
Winsorized Mean ( 1 / 23 )1475.4927536231981.21082470397618.168670974609
Winsorized Mean ( 2 / 23 )1477.1739130434879.909496858645918.4855864585969
Winsorized Mean ( 3 / 23 )1451.0869565217471.125280424057820.4018451367809
Winsorized Mean ( 4 / 23 )1481.811594202964.257292902189623.0605979068939
Winsorized Mean ( 5 / 23 )1479.6376811594262.542677572270523.6580482095548
Winsorized Mean ( 6 / 23 )1480.8550724637761.374263357100524.128274482865
Winsorized Mean ( 7 / 23 )1460.8695652173954.117979613154826.99416304267
Winsorized Mean ( 8 / 23 )1434.434782608747.502835551658830.1968243779629
Winsorized Mean ( 9 / 23 )1415.1304347826139.18739224023136.1118807321348
Winsorized Mean ( 10 / 23 )1407.4492753623237.511393757769437.5205806654627
Winsorized Mean ( 11 / 23 )1402.188405797135.281569125150739.7428017110935
Winsorized Mean ( 12 / 23 )1403.4057971014533.943927980348941.3448260293835
Winsorized Mean ( 13 / 23 )1385.8840579710130.02309097301146.1606054891831
Winsorized Mean ( 14 / 23 )1392.5797101449328.094510798337749.5676796133188
Winsorized Mean ( 15 / 23 )1381.2753623188426.174091594235952.7726189596979
Winsorized Mean ( 16 / 23 )1383.1304347826124.3129191223656.8887029904434
Winsorized Mean ( 17 / 23 )1379.9275362318822.297992665577461.8857292191217
Winsorized Mean ( 18 / 23 )1376.0144927536219.507791225041570.536662858442
Winsorized Mean ( 19 / 23 )1377.1159420289919.190041377714271.7620100407007
Winsorized Mean ( 20 / 23 )1377.1159420289919.02854382407572.3710629021783
Winsorized Mean ( 21 / 23 )1382.5942028985517.894086889999377.2654235668911
Winsorized Mean ( 22 / 23 )1383.8695652173917.449951731997879.3050655079924
Winsorized Mean ( 23 / 23 )1390.8695652173916.46738377801884.4620848075476
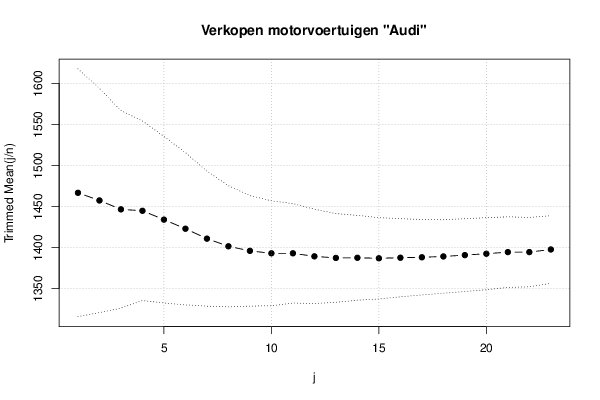
Trimmed Mean ( 1 / 23 )1466.7014925373175.482617307364519.4309835145875
Trimmed Mean ( 2 / 23 )1457.3692307692368.349598253105721.322279399104
Trimmed Mean ( 3 / 23 )1446.5238095238160.187911313451624.0334608388466
Trimmed Mean ( 4 / 23 )1444.8032786885254.706843258173726.4099186251741
Trimmed Mean ( 5 / 23 )1433.9830508474650.763852560486728.2481131458418
Trimmed Mean ( 6 / 23 )1422.929824561446.411663604929630.6588842984346
Trimmed Mean ( 7 / 23 )1410.8181818181841.15079513212534.2841050164011
Trimmed Mean ( 8 / 23 )1401.5094339622636.914039543441237.9668400233721
Trimmed Mean ( 9 / 23 )1395.9411764705933.667956625623541.4620106587694
Trimmed Mean ( 10 / 23 )1392.938775510231.995833170506543.5350055767325
Trimmed Mean ( 11 / 23 )1392.938775510230.313832404665745.9505996112788
Trimmed Mean ( 12 / 23 )1389.2222222222228.739950178304148.3376698151325
Trimmed Mean ( 13 / 23 )1387.3255813953527.034282016190751.3172711805139
Trimmed Mean ( 14 / 23 )1387.5121951219525.852634010993353.6700513584783
Trimmed Mean ( 15 / 23 )1386.8717948717924.776059890696855.9762852120225
Trimmed Mean ( 16 / 23 )1387.5675675675723.822464621265458.2461802180173
Trimmed Mean ( 17 / 23 )1388.1142857142923.003973768104760.3423695274302
Trimmed Mean ( 18 / 23 )1389.1212121212122.386868681171762.0507151716811
Trimmed Mean ( 19 / 23 )1390.7419354838722.20873448931962.6213950260305
Trimmed Mean ( 20 / 23 )1392.4482758620721.947798918271763.4436410251074
Trimmed Mean ( 21 / 23 )1394.4074074074121.51136049552164.8219069034591
Trimmed Mean ( 22 / 23 )1394.4074074074121.144383020871865.9469423170671
Trimmed Mean ( 23 / 23 )1397.6086956521720.612243486414167.8047829472499
Median1400
Midrange2119
Midmean - Weighted Average at Xnp1382.02941176471
Midmean - Weighted Average at X(n+1)p1388.11428571429
Midmean - Empirical Distribution Function1388.11428571429
Midmean - Empirical Distribution Function - Averaging1388.11428571429
Midmean - Empirical Distribution Function - Interpolation1388.11428571429
Midmean - Closest Observation1380.86111111111
Midmean - True Basic - Statistics Graphics Toolkit1388.11428571429
Midmean - MS Excel (old versions)1388.11428571429
Number of observations69

\begin{tabular}{lllllllll}
\hline
Central Tendency - Ungrouped Data \tabularnewline
Measure & Value & S.E. & Value/S.E. \tabularnewline
Arithmetic Mean & 1485.60869565217 & 85.8726113394554 & 17.3001457912995 \tabularnewline
Geometric Mean & 1273.19906870469 &  &  \tabularnewline
Harmonic Mean & 798.619337066661 &  &  \tabularnewline
Quadratic Mean & 1645.74371100692 &  &  \tabularnewline
Winsorized Mean ( 1 / 23 ) & 1475.49275362319 & 81.210824703976 & 18.168670974609 \tabularnewline
Winsorized Mean ( 2 / 23 ) & 1477.17391304348 & 79.9094968586459 & 18.4855864585969 \tabularnewline
Winsorized Mean ( 3 / 23 ) & 1451.08695652174 & 71.1252804240578 & 20.4018451367809 \tabularnewline
Winsorized Mean ( 4 / 23 ) & 1481.8115942029 & 64.2572929021896 & 23.0605979068939 \tabularnewline
Winsorized Mean ( 5 / 23 ) & 1479.63768115942 & 62.5426775722705 & 23.6580482095548 \tabularnewline
Winsorized Mean ( 6 / 23 ) & 1480.85507246377 & 61.3742633571005 & 24.128274482865 \tabularnewline
Winsorized Mean ( 7 / 23 ) & 1460.86956521739 & 54.1179796131548 & 26.99416304267 \tabularnewline
Winsorized Mean ( 8 / 23 ) & 1434.4347826087 & 47.5028355516588 & 30.1968243779629 \tabularnewline
Winsorized Mean ( 9 / 23 ) & 1415.13043478261 & 39.187392240231 & 36.1118807321348 \tabularnewline
Winsorized Mean ( 10 / 23 ) & 1407.44927536232 & 37.5113937577694 & 37.5205806654627 \tabularnewline
Winsorized Mean ( 11 / 23 ) & 1402.1884057971 & 35.2815691251507 & 39.7428017110935 \tabularnewline
Winsorized Mean ( 12 / 23 ) & 1403.40579710145 & 33.9439279803489 & 41.3448260293835 \tabularnewline
Winsorized Mean ( 13 / 23 ) & 1385.88405797101 & 30.023090973011 & 46.1606054891831 \tabularnewline
Winsorized Mean ( 14 / 23 ) & 1392.57971014493 & 28.0945107983377 & 49.5676796133188 \tabularnewline
Winsorized Mean ( 15 / 23 ) & 1381.27536231884 & 26.1740915942359 & 52.7726189596979 \tabularnewline
Winsorized Mean ( 16 / 23 ) & 1383.13043478261 & 24.31291912236 & 56.8887029904434 \tabularnewline
Winsorized Mean ( 17 / 23 ) & 1379.92753623188 & 22.2979926655774 & 61.8857292191217 \tabularnewline
Winsorized Mean ( 18 / 23 ) & 1376.01449275362 & 19.5077912250415 & 70.536662858442 \tabularnewline
Winsorized Mean ( 19 / 23 ) & 1377.11594202899 & 19.1900413777142 & 71.7620100407007 \tabularnewline
Winsorized Mean ( 20 / 23 ) & 1377.11594202899 & 19.028543824075 & 72.3710629021783 \tabularnewline
Winsorized Mean ( 21 / 23 ) & 1382.59420289855 & 17.8940868899993 & 77.2654235668911 \tabularnewline
Winsorized Mean ( 22 / 23 ) & 1383.86956521739 & 17.4499517319978 & 79.3050655079924 \tabularnewline
Winsorized Mean ( 23 / 23 ) & 1390.86956521739 & 16.467383778018 & 84.4620848075476 \tabularnewline
Trimmed Mean ( 1 / 23 ) & 1466.70149253731 & 75.4826173073645 & 19.4309835145875 \tabularnewline
Trimmed Mean ( 2 / 23 ) & 1457.36923076923 & 68.3495982531057 & 21.322279399104 \tabularnewline
Trimmed Mean ( 3 / 23 ) & 1446.52380952381 & 60.1879113134516 & 24.0334608388466 \tabularnewline
Trimmed Mean ( 4 / 23 ) & 1444.80327868852 & 54.7068432581737 & 26.4099186251741 \tabularnewline
Trimmed Mean ( 5 / 23 ) & 1433.98305084746 & 50.7638525604867 & 28.2481131458418 \tabularnewline
Trimmed Mean ( 6 / 23 ) & 1422.9298245614 & 46.4116636049296 & 30.6588842984346 \tabularnewline
Trimmed Mean ( 7 / 23 ) & 1410.81818181818 & 41.150795132125 & 34.2841050164011 \tabularnewline
Trimmed Mean ( 8 / 23 ) & 1401.50943396226 & 36.9140395434412 & 37.9668400233721 \tabularnewline
Trimmed Mean ( 9 / 23 ) & 1395.94117647059 & 33.6679566256235 & 41.4620106587694 \tabularnewline
Trimmed Mean ( 10 / 23 ) & 1392.9387755102 & 31.9958331705065 & 43.5350055767325 \tabularnewline
Trimmed Mean ( 11 / 23 ) & 1392.9387755102 & 30.3138324046657 & 45.9505996112788 \tabularnewline
Trimmed Mean ( 12 / 23 ) & 1389.22222222222 & 28.7399501783041 & 48.3376698151325 \tabularnewline
Trimmed Mean ( 13 / 23 ) & 1387.32558139535 & 27.0342820161907 & 51.3172711805139 \tabularnewline
Trimmed Mean ( 14 / 23 ) & 1387.51219512195 & 25.8526340109933 & 53.6700513584783 \tabularnewline
Trimmed Mean ( 15 / 23 ) & 1386.87179487179 & 24.7760598906968 & 55.9762852120225 \tabularnewline
Trimmed Mean ( 16 / 23 ) & 1387.56756756757 & 23.8224646212654 & 58.2461802180173 \tabularnewline
Trimmed Mean ( 17 / 23 ) & 1388.11428571429 & 23.0039737681047 & 60.3423695274302 \tabularnewline
Trimmed Mean ( 18 / 23 ) & 1389.12121212121 & 22.3868686811717 & 62.0507151716811 \tabularnewline
Trimmed Mean ( 19 / 23 ) & 1390.74193548387 & 22.208734489319 & 62.6213950260305 \tabularnewline
Trimmed Mean ( 20 / 23 ) & 1392.44827586207 & 21.9477989182717 & 63.4436410251074 \tabularnewline
Trimmed Mean ( 21 / 23 ) & 1394.40740740741 & 21.511360495521 & 64.8219069034591 \tabularnewline
Trimmed Mean ( 22 / 23 ) & 1394.40740740741 & 21.1443830208718 & 65.9469423170671 \tabularnewline
Trimmed Mean ( 23 / 23 ) & 1397.60869565217 & 20.6122434864141 & 67.8047829472499 \tabularnewline
Median & 1400 &  &  \tabularnewline
Midrange & 2119 &  &  \tabularnewline
Midmean - Weighted Average at Xnp & 1382.02941176471 &  &  \tabularnewline
Midmean - Weighted Average at X(n+1)p & 1388.11428571429 &  &  \tabularnewline
Midmean - Empirical Distribution Function & 1388.11428571429 &  &  \tabularnewline
Midmean - Empirical Distribution Function - Averaging & 1388.11428571429 &  &  \tabularnewline
Midmean - Empirical Distribution Function - Interpolation & 1388.11428571429 &  &  \tabularnewline
Midmean - Closest Observation & 1380.86111111111 &  &  \tabularnewline
Midmean - True Basic - Statistics Graphics Toolkit & 1388.11428571429 &  &  \tabularnewline
Midmean - MS Excel (old versions) & 1388.11428571429 &  &  \tabularnewline
Number of observations & 69 &  &  \tabularnewline
\hline
\end{tabular}
%Source: https://freestatistics.org/blog/index.php?pk=240651&T=1

[TABLE]
[ROW][C]Central Tendency - Ungrouped Data[/C][/ROW]
[ROW][C]Measure[/C][C]Value[/C][C]S.E.[/C][C]Value/S.E.[/C][/ROW]
[ROW][C]Arithmetic Mean[/C][C]1485.60869565217[/C][C]85.8726113394554[/C][C]17.3001457912995[/C][/ROW]
[ROW][C]Geometric Mean[/C][C]1273.19906870469[/C][C][/C][C][/C][/ROW]
[ROW][C]Harmonic Mean[/C][C]798.619337066661[/C][C][/C][C][/C][/ROW]
[ROW][C]Quadratic Mean[/C][C]1645.74371100692[/C][C][/C][C][/C][/ROW]
[ROW][C]Winsorized Mean ( 1 / 23 )[/C][C]1475.49275362319[/C][C]81.210824703976[/C][C]18.168670974609[/C][/ROW]
[ROW][C]Winsorized Mean ( 2 / 23 )[/C][C]1477.17391304348[/C][C]79.9094968586459[/C][C]18.4855864585969[/C][/ROW]
[ROW][C]Winsorized Mean ( 3 / 23 )[/C][C]1451.08695652174[/C][C]71.1252804240578[/C][C]20.4018451367809[/C][/ROW]
[ROW][C]Winsorized Mean ( 4 / 23 )[/C][C]1481.8115942029[/C][C]64.2572929021896[/C][C]23.0605979068939[/C][/ROW]
[ROW][C]Winsorized Mean ( 5 / 23 )[/C][C]1479.63768115942[/C][C]62.5426775722705[/C][C]23.6580482095548[/C][/ROW]
[ROW][C]Winsorized Mean ( 6 / 23 )[/C][C]1480.85507246377[/C][C]61.3742633571005[/C][C]24.128274482865[/C][/ROW]
[ROW][C]Winsorized Mean ( 7 / 23 )[/C][C]1460.86956521739[/C][C]54.1179796131548[/C][C]26.99416304267[/C][/ROW]
[ROW][C]Winsorized Mean ( 8 / 23 )[/C][C]1434.4347826087[/C][C]47.5028355516588[/C][C]30.1968243779629[/C][/ROW]
[ROW][C]Winsorized Mean ( 9 / 23 )[/C][C]1415.13043478261[/C][C]39.187392240231[/C][C]36.1118807321348[/C][/ROW]
[ROW][C]Winsorized Mean ( 10 / 23 )[/C][C]1407.44927536232[/C][C]37.5113937577694[/C][C]37.5205806654627[/C][/ROW]
[ROW][C]Winsorized Mean ( 11 / 23 )[/C][C]1402.1884057971[/C][C]35.2815691251507[/C][C]39.7428017110935[/C][/ROW]
[ROW][C]Winsorized Mean ( 12 / 23 )[/C][C]1403.40579710145[/C][C]33.9439279803489[/C][C]41.3448260293835[/C][/ROW]
[ROW][C]Winsorized Mean ( 13 / 23 )[/C][C]1385.88405797101[/C][C]30.023090973011[/C][C]46.1606054891831[/C][/ROW]
[ROW][C]Winsorized Mean ( 14 / 23 )[/C][C]1392.57971014493[/C][C]28.0945107983377[/C][C]49.5676796133188[/C][/ROW]
[ROW][C]Winsorized Mean ( 15 / 23 )[/C][C]1381.27536231884[/C][C]26.1740915942359[/C][C]52.7726189596979[/C][/ROW]
[ROW][C]Winsorized Mean ( 16 / 23 )[/C][C]1383.13043478261[/C][C]24.31291912236[/C][C]56.8887029904434[/C][/ROW]
[ROW][C]Winsorized Mean ( 17 / 23 )[/C][C]1379.92753623188[/C][C]22.2979926655774[/C][C]61.8857292191217[/C][/ROW]
[ROW][C]Winsorized Mean ( 18 / 23 )[/C][C]1376.01449275362[/C][C]19.5077912250415[/C][C]70.536662858442[/C][/ROW]
[ROW][C]Winsorized Mean ( 19 / 23 )[/C][C]1377.11594202899[/C][C]19.1900413777142[/C][C]71.7620100407007[/C][/ROW]
[ROW][C]Winsorized Mean ( 20 / 23 )[/C][C]1377.11594202899[/C][C]19.028543824075[/C][C]72.3710629021783[/C][/ROW]
[ROW][C]Winsorized Mean ( 21 / 23 )[/C][C]1382.59420289855[/C][C]17.8940868899993[/C][C]77.2654235668911[/C][/ROW]
[ROW][C]Winsorized Mean ( 22 / 23 )[/C][C]1383.86956521739[/C][C]17.4499517319978[/C][C]79.3050655079924[/C][/ROW]
[ROW][C]Winsorized Mean ( 23 / 23 )[/C][C]1390.86956521739[/C][C]16.467383778018[/C][C]84.4620848075476[/C][/ROW]
[ROW][C]Trimmed Mean ( 1 / 23 )[/C][C]1466.70149253731[/C][C]75.4826173073645[/C][C]19.4309835145875[/C][/ROW]
[ROW][C]Trimmed Mean ( 2 / 23 )[/C][C]1457.36923076923[/C][C]68.3495982531057[/C][C]21.322279399104[/C][/ROW]
[ROW][C]Trimmed Mean ( 3 / 23 )[/C][C]1446.52380952381[/C][C]60.1879113134516[/C][C]24.0334608388466[/C][/ROW]
[ROW][C]Trimmed Mean ( 4 / 23 )[/C][C]1444.80327868852[/C][C]54.7068432581737[/C][C]26.4099186251741[/C][/ROW]
[ROW][C]Trimmed Mean ( 5 / 23 )[/C][C]1433.98305084746[/C][C]50.7638525604867[/C][C]28.2481131458418[/C][/ROW]
[ROW][C]Trimmed Mean ( 6 / 23 )[/C][C]1422.9298245614[/C][C]46.4116636049296[/C][C]30.6588842984346[/C][/ROW]
[ROW][C]Trimmed Mean ( 7 / 23 )[/C][C]1410.81818181818[/C][C]41.150795132125[/C][C]34.2841050164011[/C][/ROW]
[ROW][C]Trimmed Mean ( 8 / 23 )[/C][C]1401.50943396226[/C][C]36.9140395434412[/C][C]37.9668400233721[/C][/ROW]
[ROW][C]Trimmed Mean ( 9 / 23 )[/C][C]1395.94117647059[/C][C]33.6679566256235[/C][C]41.4620106587694[/C][/ROW]
[ROW][C]Trimmed Mean ( 10 / 23 )[/C][C]1392.9387755102[/C][C]31.9958331705065[/C][C]43.5350055767325[/C][/ROW]
[ROW][C]Trimmed Mean ( 11 / 23 )[/C][C]1392.9387755102[/C][C]30.3138324046657[/C][C]45.9505996112788[/C][/ROW]
[ROW][C]Trimmed Mean ( 12 / 23 )[/C][C]1389.22222222222[/C][C]28.7399501783041[/C][C]48.3376698151325[/C][/ROW]
[ROW][C]Trimmed Mean ( 13 / 23 )[/C][C]1387.32558139535[/C][C]27.0342820161907[/C][C]51.3172711805139[/C][/ROW]
[ROW][C]Trimmed Mean ( 14 / 23 )[/C][C]1387.51219512195[/C][C]25.8526340109933[/C][C]53.6700513584783[/C][/ROW]
[ROW][C]Trimmed Mean ( 15 / 23 )[/C][C]1386.87179487179[/C][C]24.7760598906968[/C][C]55.9762852120225[/C][/ROW]
[ROW][C]Trimmed Mean ( 16 / 23 )[/C][C]1387.56756756757[/C][C]23.8224646212654[/C][C]58.2461802180173[/C][/ROW]
[ROW][C]Trimmed Mean ( 17 / 23 )[/C][C]1388.11428571429[/C][C]23.0039737681047[/C][C]60.3423695274302[/C][/ROW]
[ROW][C]Trimmed Mean ( 18 / 23 )[/C][C]1389.12121212121[/C][C]22.3868686811717[/C][C]62.0507151716811[/C][/ROW]
[ROW][C]Trimmed Mean ( 19 / 23 )[/C][C]1390.74193548387[/C][C]22.208734489319[/C][C]62.6213950260305[/C][/ROW]
[ROW][C]Trimmed Mean ( 20 / 23 )[/C][C]1392.44827586207[/C][C]21.9477989182717[/C][C]63.4436410251074[/C][/ROW]
[ROW][C]Trimmed Mean ( 21 / 23 )[/C][C]1394.40740740741[/C][C]21.511360495521[/C][C]64.8219069034591[/C][/ROW]
[ROW][C]Trimmed Mean ( 22 / 23 )[/C][C]1394.40740740741[/C][C]21.1443830208718[/C][C]65.9469423170671[/C][/ROW]
[ROW][C]Trimmed Mean ( 23 / 23 )[/C][C]1397.60869565217[/C][C]20.6122434864141[/C][C]67.8047829472499[/C][/ROW]
[ROW][C]Median[/C][C]1400[/C][C][/C][C][/C][/ROW]
[ROW][C]Midrange[/C][C]2119[/C][C][/C][C][/C][/ROW]
[ROW][C]Midmean - Weighted Average at Xnp[/C][C]1382.02941176471[/C][C][/C][C][/C][/ROW]
[ROW][C]Midmean - Weighted Average at X(n+1)p[/C][C]1388.11428571429[/C][C][/C][C][/C][/ROW]
[ROW][C]Midmean - Empirical Distribution Function[/C][C]1388.11428571429[/C][C][/C][C][/C][/ROW]
[ROW][C]Midmean - Empirical Distribution Function - Averaging[/C][C]1388.11428571429[/C][C][/C][C][/C][/ROW]
[ROW][C]Midmean - Empirical Distribution Function - Interpolation[/C][C]1388.11428571429[/C][C][/C][C][/C][/ROW]
[ROW][C]Midmean - Closest Observation[/C][C]1380.86111111111[/C][C][/C][C][/C][/ROW]
[ROW][C]Midmean - True Basic - Statistics Graphics Toolkit[/C][C]1388.11428571429[/C][C][/C][C][/C][/ROW]
[ROW][C]Midmean - MS Excel (old versions)[/C][C]1388.11428571429[/C][C][/C][C][/C][/ROW]
[ROW][C]Number of observations[/C][C]69[/C][C][/C][C][/C][/ROW]
[/TABLE]
Source: https://freestatistics.org/blog/index.php?pk=240651&T=1

Globally Unique Identifier (entire table): ba.freestatistics.org/blog/index.php?pk=240651&T=1

As an alternative you can also use a QR Code:  

The GUIDs for individual cells are displayed in the table below:

Central Tendency - Ungrouped Data
MeasureValueS.E.Value/S.E.
Arithmetic Mean1485.6086956521785.872611339455417.3001457912995
Geometric Mean1273.19906870469
Harmonic Mean798.619337066661
Quadratic Mean1645.74371100692
Winsorized Mean ( 1 / 23 )1475.4927536231981.21082470397618.168670974609
Winsorized Mean ( 2 / 23 )1477.1739130434879.909496858645918.4855864585969
Winsorized Mean ( 3 / 23 )1451.0869565217471.125280424057820.4018451367809
Winsorized Mean ( 4 / 23 )1481.811594202964.257292902189623.0605979068939
Winsorized Mean ( 5 / 23 )1479.6376811594262.542677572270523.6580482095548
Winsorized Mean ( 6 / 23 )1480.8550724637761.374263357100524.128274482865
Winsorized Mean ( 7 / 23 )1460.8695652173954.117979613154826.99416304267
Winsorized Mean ( 8 / 23 )1434.434782608747.502835551658830.1968243779629
Winsorized Mean ( 9 / 23 )1415.1304347826139.18739224023136.1118807321348
Winsorized Mean ( 10 / 23 )1407.4492753623237.511393757769437.5205806654627
Winsorized Mean ( 11 / 23 )1402.188405797135.281569125150739.7428017110935
Winsorized Mean ( 12 / 23 )1403.4057971014533.943927980348941.3448260293835
Winsorized Mean ( 13 / 23 )1385.8840579710130.02309097301146.1606054891831
Winsorized Mean ( 14 / 23 )1392.5797101449328.094510798337749.5676796133188
Winsorized Mean ( 15 / 23 )1381.2753623188426.174091594235952.7726189596979
Winsorized Mean ( 16 / 23 )1383.1304347826124.3129191223656.8887029904434
Winsorized Mean ( 17 / 23 )1379.9275362318822.297992665577461.8857292191217
Winsorized Mean ( 18 / 23 )1376.0144927536219.507791225041570.536662858442
Winsorized Mean ( 19 / 23 )1377.1159420289919.190041377714271.7620100407007
Winsorized Mean ( 20 / 23 )1377.1159420289919.02854382407572.3710629021783
Winsorized Mean ( 21 / 23 )1382.5942028985517.894086889999377.2654235668911
Winsorized Mean ( 22 / 23 )1383.8695652173917.449951731997879.3050655079924
Winsorized Mean ( 23 / 23 )1390.8695652173916.46738377801884.4620848075476
Trimmed Mean ( 1 / 23 )1466.7014925373175.482617307364519.4309835145875
Trimmed Mean ( 2 / 23 )1457.3692307692368.349598253105721.322279399104
Trimmed Mean ( 3 / 23 )1446.5238095238160.187911313451624.0334608388466
Trimmed Mean ( 4 / 23 )1444.8032786885254.706843258173726.4099186251741
Trimmed Mean ( 5 / 23 )1433.9830508474650.763852560486728.2481131458418
Trimmed Mean ( 6 / 23 )1422.929824561446.411663604929630.6588842984346
Trimmed Mean ( 7 / 23 )1410.8181818181841.15079513212534.2841050164011
Trimmed Mean ( 8 / 23 )1401.5094339622636.914039543441237.9668400233721
Trimmed Mean ( 9 / 23 )1395.9411764705933.667956625623541.4620106587694
Trimmed Mean ( 10 / 23 )1392.938775510231.995833170506543.5350055767325
Trimmed Mean ( 11 / 23 )1392.938775510230.313832404665745.9505996112788
Trimmed Mean ( 12 / 23 )1389.2222222222228.739950178304148.3376698151325
Trimmed Mean ( 13 / 23 )1387.3255813953527.034282016190751.3172711805139
Trimmed Mean ( 14 / 23 )1387.5121951219525.852634010993353.6700513584783
Trimmed Mean ( 15 / 23 )1386.8717948717924.776059890696855.9762852120225
Trimmed Mean ( 16 / 23 )1387.5675675675723.822464621265458.2461802180173
Trimmed Mean ( 17 / 23 )1388.1142857142923.003973768104760.3423695274302
Trimmed Mean ( 18 / 23 )1389.1212121212122.386868681171762.0507151716811
Trimmed Mean ( 19 / 23 )1390.7419354838722.20873448931962.6213950260305
Trimmed Mean ( 20 / 23 )1392.4482758620721.947798918271763.4436410251074
Trimmed Mean ( 21 / 23 )1394.4074074074121.51136049552164.8219069034591
Trimmed Mean ( 22 / 23 )1394.4074074074121.144383020871865.9469423170671
Trimmed Mean ( 23 / 23 )1397.6086956521720.612243486414167.8047829472499
Median1400
Midrange2119
Midmean - Weighted Average at Xnp1382.02941176471
Midmean - Weighted Average at X(n+1)p1388.11428571429
Midmean - Empirical Distribution Function1388.11428571429
Midmean - Empirical Distribution Function - Averaging1388.11428571429
Midmean - Empirical Distribution Function - Interpolation1388.11428571429
Midmean - Closest Observation1380.86111111111
Midmean - True Basic - Statistics Graphics Toolkit1388.11428571429
Midmean - MS Excel (old versions)1388.11428571429
Number of observations69


Parameters (Session):
Parameters (R input):
R code (references can be found in the software module):
geomean <- function(x) {
return(exp(mean(log(x))))
}
harmean <- function(x) {
return(1/mean(1/x))
}
quamean <- function(x) {
return(sqrt(mean(x*x)))
}
winmean <- function(x) {
x <-sort(x[!is.na(x)])
n<-length(x)
denom <- 3
nodenom <- n/denom
if (nodenom>40) denom <- n/40
sqrtn = sqrt(n)
roundnodenom = floor(nodenom)
win <- array(NA,dim=c(roundnodenom,2))
for (j in 1:roundnodenom) {
win[j,1] <- (j*x[j+1]+sum(x[(j+1):(n-j)])+j*x[n-j])/n
win[j,2] <- sd(c(rep(x[j+1],j),x[(j+1):(n-j)],rep(x[n-j],j)))/sqrtn
}
return(win)
}
trimean <- function(x) {
x <-sort(x[!is.na(x)])
n<-length(x)
denom <- 3
nodenom <- n/denom
if (nodenom>40) denom <- n/40
sqrtn = sqrt(n)
roundnodenom = floor(nodenom)
tri <- array(NA,dim=c(roundnodenom,2))
for (j in 1:roundnodenom) {
tri[j,1] <- mean(x,trim=j/n)
tri[j,2] <- sd(x[(j+1):(n-j)]) / sqrt(n-j*2)
}
return(tri)
}
midrange <- function(x) {
return((max(x)+min(x))/2)
}
q1 <- function(data,n,p,i,f) {
np <- n*p;
i <<- floor(np)
f <<- np - i
qvalue <- (1-f)*data[i] + f*data[i+1]
}
q2 <- function(data,n,p,i,f) {
np <- (n+1)*p
i <<- floor(np)
f <<- np - i
qvalue <- (1-f)*data[i] + f*data[i+1]
}
q3 <- function(data,n,p,i,f) {
np <- n*p
i <<- floor(np)
f <<- np - i
if (f==0) {
qvalue <- data[i]
} else {
qvalue <- data[i+1]
}
}
q4 <- function(data,n,p,i,f) {
np <- n*p
i <<- floor(np)
f <<- np - i
if (f==0) {
qvalue <- (data[i]+data[i+1])/2
} else {
qvalue <- data[i+1]
}
}
q5 <- function(data,n,p,i,f) {
np <- (n-1)*p
i <<- floor(np)
f <<- np - i
if (f==0) {
qvalue <- data[i+1]
} else {
qvalue <- data[i+1] + f*(data[i+2]-data[i+1])
}
}
q6 <- function(data,n,p,i,f) {
np <- n*p+0.5
i <<- floor(np)
f <<- np - i
qvalue <- data[i]
}
q7 <- function(data,n,p,i,f) {
np <- (n+1)*p
i <<- floor(np)
f <<- np - i
if (f==0) {
qvalue <- data[i]
} else {
qvalue <- f*data[i] + (1-f)*data[i+1]
}
}
q8 <- function(data,n,p,i,f) {
np <- (n+1)*p
i <<- floor(np)
f <<- np - i
if (f==0) {
qvalue <- data[i]
} else {
if (f == 0.5) {
qvalue <- (data[i]+data[i+1])/2
} else {
if (f < 0.5) {
qvalue <- data[i]
} else {
qvalue <- data[i+1]
}
}
}
}
midmean <- function(x,def) {
x <-sort(x[!is.na(x)])
n<-length(x)
if (def==1) {
qvalue1 <- q1(x,n,0.25,i,f)
qvalue3 <- q1(x,n,0.75,i,f)
}
if (def==2) {
qvalue1 <- q2(x,n,0.25,i,f)
qvalue3 <- q2(x,n,0.75,i,f)
}
if (def==3) {
qvalue1 <- q3(x,n,0.25,i,f)
qvalue3 <- q3(x,n,0.75,i,f)
}
if (def==4) {
qvalue1 <- q4(x,n,0.25,i,f)
qvalue3 <- q4(x,n,0.75,i,f)
}
if (def==5) {
qvalue1 <- q5(x,n,0.25,i,f)
qvalue3 <- q5(x,n,0.75,i,f)
}
if (def==6) {
qvalue1 <- q6(x,n,0.25,i,f)
qvalue3 <- q6(x,n,0.75,i,f)
}
if (def==7) {
qvalue1 <- q7(x,n,0.25,i,f)
qvalue3 <- q7(x,n,0.75,i,f)
}
if (def==8) {
qvalue1 <- q8(x,n,0.25,i,f)
qvalue3 <- q8(x,n,0.75,i,f)
}
midm <- 0
myn <- 0
roundno4 <- round(n/4)
round3no4 <- round(3*n/4)
for (i in 1:n) {
if ((x[i]>=qvalue1) & (x[i]<=qvalue3)){
midm = midm + x[i]
myn = myn + 1
}
}
midm = midm / myn
return(midm)
}
(arm <- mean(x))
sqrtn <- sqrt(length(x))
(armse <- sd(x) / sqrtn)
(armose <- arm / armse)
(geo <- geomean(x))
(har <- harmean(x))
(qua <- quamean(x))
(win <- winmean(x))
(tri <- trimean(x))
(midr <- midrange(x))
midm <- array(NA,dim=8)
for (j in 1:8) midm[j] <- midmean(x,j)
midm
bitmap(file='test1.png')
lb <- win[,1] - 2*win[,2]
ub <- win[,1] + 2*win[,2]
if ((ylimmin == '') | (ylimmax == '')) plot(win[,1],type='b',main=main, xlab='j', pch=19, ylab='Winsorized Mean(j/n)', ylim=c(min(lb),max(ub))) else plot(win[,1],type='l',main=main, xlab='j', pch=19, ylab='Winsorized Mean(j/n)', ylim=c(ylimmin,ylimmax))
lines(ub,lty=3)
lines(lb,lty=3)
grid()
dev.off()
bitmap(file='test2.png')
lb <- tri[,1] - 2*tri[,2]
ub <- tri[,1] + 2*tri[,2]
if ((ylimmin == '') | (ylimmax == '')) plot(tri[,1],type='b',main=main, xlab='j', pch=19, ylab='Trimmed Mean(j/n)', ylim=c(min(lb),max(ub))) else plot(tri[,1],type='l',main=main, xlab='j', pch=19, ylab='Trimmed Mean(j/n)', ylim=c(ylimmin,ylimmax))
lines(ub,lty=3)
lines(lb,lty=3)
grid()
dev.off()
load(file='createtable')
a<-table.start()
a<-table.row.start(a)
a<-table.element(a,'Central Tendency - Ungrouped Data',4,TRUE)
a<-table.row.end(a)
a<-table.row.start(a)
a<-table.element(a,'Measure',header=TRUE)
a<-table.element(a,'Value',header=TRUE)
a<-table.element(a,'S.E.',header=TRUE)
a<-table.element(a,'Value/S.E.',header=TRUE)
a<-table.row.end(a)
a<-table.row.start(a)
a<-table.element(a,hyperlink('arithmetic_mean.htm', 'Arithmetic Mean', 'click to view the definition of the Arithmetic Mean'),header=TRUE)
a<-table.element(a,arm)
a<-table.element(a,hyperlink('arithmetic_mean_standard_error.htm', armse, 'click to view the definition of the Standard Error of the Arithmetic Mean'))
a<-table.element(a,armose)
a<-table.row.end(a)
a<-table.row.start(a)
a<-table.element(a,hyperlink('geometric_mean.htm', 'Geometric Mean', 'click to view the definition of the Geometric Mean'),header=TRUE)
a<-table.element(a,geo)
a<-table.element(a,'')
a<-table.row.end(a)
a<-table.row.start(a)
a<-table.element(a,hyperlink('harmonic_mean.htm', 'Harmonic Mean', 'click to view the definition of the Harmonic Mean'),header=TRUE)
a<-table.element(a,har)
a<-table.element(a,'')
a<-table.row.end(a)
a<-table.row.start(a)
a<-table.element(a,hyperlink('quadratic_mean.htm', 'Quadratic Mean', 'click to view the definition of the Quadratic Mean'),header=TRUE)
a<-table.element(a,qua)
a<-table.element(a,'')
a<-table.row.end(a)
for (j in 1:length(win[,1])) {
a<-table.row.start(a)
mylabel <- paste('Winsorized Mean (',j)
mylabel <- paste(mylabel,'/')
mylabel <- paste(mylabel,length(win[,1]))
mylabel <- paste(mylabel,')')
a<-table.element(a,hyperlink('winsorized_mean.htm', mylabel, 'click to view the definition of the Winsorized Mean'),header=TRUE)
a<-table.element(a,win[j,1])
a<-table.element(a,win[j,2])
a<-table.element(a,win[j,1]/win[j,2])
a<-table.row.end(a)
}
for (j in 1:length(tri[,1])) {
a<-table.row.start(a)
mylabel <- paste('Trimmed Mean (',j)
mylabel <- paste(mylabel,'/')
mylabel <- paste(mylabel,length(tri[,1]))
mylabel <- paste(mylabel,')')
a<-table.element(a,hyperlink('arithmetic_mean.htm', mylabel, 'click to view the definition of the Trimmed Mean'),header=TRUE)
a<-table.element(a,tri[j,1])
a<-table.element(a,tri[j,2])
a<-table.element(a,tri[j,1]/tri[j,2])
a<-table.row.end(a)
}
a<-table.row.start(a)
a<-table.element(a,hyperlink('median_1.htm', 'Median', 'click to view the definition of the Median'),header=TRUE)
a<-table.element(a,median(x))
a<-table.element(a,'')
a<-table.row.end(a)
a<-table.row.start(a)
a<-table.element(a,hyperlink('midrange.htm', 'Midrange', 'click to view the definition of the Midrange'),header=TRUE)
a<-table.element(a,midr)
a<-table.element(a,'')
a<-table.row.end(a)
a<-table.row.start(a)
mymid <- hyperlink('midmean.htm', 'Midmean', 'click to view the definition of the Midmean')
mylabel <- paste(mymid,hyperlink('method_1.htm','Weighted Average at Xnp',''),sep=' - ')
a<-table.element(a,mylabel,header=TRUE)
a<-table.element(a,midm[1])
a<-table.element(a,'')
a<-table.row.end(a)
a<-table.row.start(a)
mymid <- hyperlink('midmean.htm', 'Midmean', 'click to view the definition of the Midmean')
mylabel <- paste(mymid,hyperlink('method_2.htm','Weighted Average at X(n+1)p',''),sep=' - ')
a<-table.element(a,mylabel,header=TRUE)
a<-table.element(a,midm[2])
a<-table.element(a,'')
a<-table.row.end(a)
a<-table.row.start(a)
mymid <- hyperlink('midmean.htm', 'Midmean', 'click to view the definition of the Midmean')
mylabel <- paste(mymid,hyperlink('method_3.htm','Empirical Distribution Function',''),sep=' - ')
a<-table.element(a,mylabel,header=TRUE)
a<-table.element(a,midm[3])
a<-table.element(a,'')
a<-table.row.end(a)
a<-table.row.start(a)
mymid <- hyperlink('midmean.htm', 'Midmean', 'click to view the definition of the Midmean')
mylabel <- paste(mymid,hyperlink('method_4.htm','Empirical Distribution Function - Averaging',''),sep=' - ')
a<-table.element(a,mylabel,header=TRUE)
a<-table.element(a,midm[4])
a<-table.element(a,'')
a<-table.row.end(a)
a<-table.row.start(a)
mymid <- hyperlink('midmean.htm', 'Midmean', 'click to view the definition of the Midmean')
mylabel <- paste(mymid,hyperlink('method_5.htm','Empirical Distribution Function - Interpolation',''),sep=' - ')
a<-table.element(a,mylabel,header=TRUE)
a<-table.element(a,midm[5])
a<-table.element(a,'')
a<-table.row.end(a)
a<-table.row.start(a)
mymid <- hyperlink('midmean.htm', 'Midmean', 'click to view the definition of the Midmean')
mylabel <- paste(mymid,hyperlink('method_6.htm','Closest Observation',''),sep=' - ')
a<-table.element(a,mylabel,header=TRUE)
a<-table.element(a,midm[6])
a<-table.element(a,'')
a<-table.row.end(a)
a<-table.row.start(a)
mymid <- hyperlink('midmean.htm', 'Midmean', 'click to view the definition of the Midmean')
mylabel <- paste(mymid,hyperlink('method_7.htm','True Basic - Statistics Graphics Toolkit',''),sep=' - ')
a<-table.element(a,mylabel,header=TRUE)
a<-table.element(a,midm[7])
a<-table.element(a,'')
a<-table.row.end(a)
a<-table.row.start(a)
mymid <- hyperlink('midmean.htm', 'Midmean', 'click to view the definition of the Midmean')
mylabel <- paste(mymid,hyperlink('method_8.htm','MS Excel (old versions)',''),sep=' - ')
a<-table.element(a,mylabel,header=TRUE)
a<-table.element(a,midm[8])
a<-table.element(a,'')
a<-table.row.end(a)
a<-table.row.start(a)
a<-table.element(a,'Number of observations',header=TRUE)
a<-table.element(a,length(x))
a<-table.element(a,'')
a<-table.row.end(a)
a<-table.end(a)
table.save(a,file='mytable.tab')