Free Statistics

of Irreproducible Research!

Author's title

Author*Unverified author*
R Software Modulerwasp_centraltendency.wasp
Title produced by softwareCentral Tendency
Date of computationSun, 12 Oct 2014 17:20:28 +0100
Cite this page as followsStatistical Computations at FreeStatistics.org, Office for Research Development and Education, URL https://freestatistics.org/blog/index.php?v=date/2014/Oct/12/t1413131136xwj3p14xi2vsdj9.htm/, Retrieved Wed, 15 May 2024 08:41:58 +0000
Statistical Computations at FreeStatistics.org, Office for Research Development and Education, URL https://freestatistics.org/blog/index.php?pk=240614, Retrieved Wed, 15 May 2024 08:41:58 +0000
QR Codes:

Original text written by user:
IsPrivate?No (this computation is public)
User-defined keywords
Estimated Impact69
Family? (F = Feedback message, R = changed R code, M = changed R Module, P = changed Parameters, D = changed Data)
-       [Central Tendency] [Robuustheid getri...] [2014-10-12 16:20:28] [015379400109ebf5da8fbe55ddfc9b6f] [Current]
Feedback Forum

Post a new message
Dataseries X:
561
549
532
526
511
499
555
565
542
527
510
514
517
508
493
490
469
478
528
534
518
506
502
516
528
533
536
537
524
536
587
597
581
564
558
575
580
575
563
552
537
545
601
604
586
564
549
551
556
548
540
531
521
519
572
581
563
548
539
541
562
559
546
536
528
530
582
599
584
571
563
565
578
572
565
561
551
553
611
622
613
599
591
596


Summary of computational transaction
Raw Inputview raw input (R code)
Raw Outputview raw output of R engine
Computing time2 seconds
R Server'Sir Ronald Aylmer Fisher' @ fisher.wessa.net

\begin{tabular}{lllllllll}
\hline
Summary of computational transaction \tabularnewline
Raw Input & view raw input (R code)  \tabularnewline
Raw Output & view raw output of R engine  \tabularnewline
Computing time & 2 seconds \tabularnewline
R Server & 'Sir Ronald Aylmer Fisher' @ fisher.wessa.net \tabularnewline
\hline
\end{tabular}
%Source: https://freestatistics.org/blog/index.php?pk=240614&T=0

[TABLE]
[ROW][C]Summary of computational transaction[/C][/ROW]
[ROW][C]Raw Input[/C][C]view raw input (R code) [/C][/ROW]
[ROW][C]Raw Output[/C][C]view raw output of R engine [/C][/ROW]
[ROW][C]Computing time[/C][C]2 seconds[/C][/ROW]
[ROW][C]R Server[/C][C]'Sir Ronald Aylmer Fisher' @ fisher.wessa.net[/C][/ROW]
[/TABLE]
Source: https://freestatistics.org/blog/index.php?pk=240614&T=0

Globally Unique Identifier (entire table): ba.freestatistics.org/blog/index.php?pk=240614&T=0

As an alternative you can also use a QR Code:  

The GUIDs for individual cells are displayed in the table below:

Summary of computational transaction
Raw Inputview raw input (R code)
Raw Outputview raw output of R engine
Computing time2 seconds
R Server'Sir Ronald Aylmer Fisher' @ fisher.wessa.net


Central Tendency - Ungrouped Data
MeasureValueS.E.Value/S.E.
Arithmetic Mean550.1071428571433.49948844131151157.196445161276
Geometric Mean549.177488576047
Harmonic Mean548.241634029394
Quadratic Mean551.03023640139
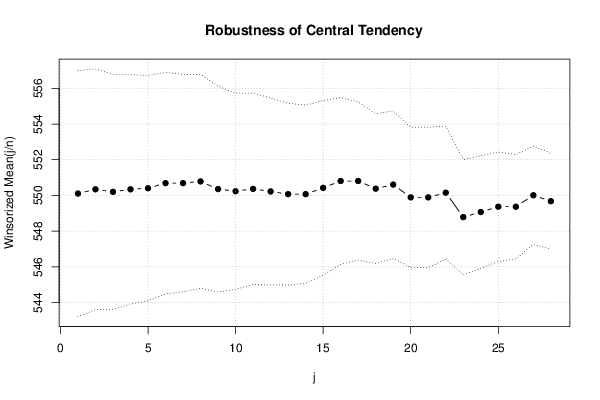
Winsorized Mean ( 1 / 28 )550.1071428571433.44596090305232159.638242665457
Winsorized Mean ( 2 / 28 )550.3452380952383.36865227402912163.372528039823
Winsorized Mean ( 3 / 28 )550.2023809523813.29413758738283167.024711736316
Winsorized Mean ( 4 / 28 )550.3452380952383.20903477728762171.498683027801
Winsorized Mean ( 5 / 28 )550.4047619047623.15292572593796174.569529937475
Winsorized Mean ( 6 / 28 )550.6904761904763.10168907172682177.545351405545
Winsorized Mean ( 7 / 28 )550.6904761904763.04220532677859181.016866725957
Winsorized Mean ( 8 / 28 )550.7857142857142.99306290259497184.020761410722
Winsorized Mean ( 9 / 28 )550.3571428571432.88111358799435191.022368972362
Winsorized Mean ( 10 / 28 )550.2380952380952.74434792071466200.498665305821
Winsorized Mean ( 11 / 28 )550.3690476190482.68224329188305205.189830946567
Winsorized Mean ( 12 / 28 )550.226190476192.61518093276445210.396987674027
Winsorized Mean ( 13 / 28 )550.0714285714292.54409115467485216.215298559823
Winsorized Mean ( 14 / 28 )550.0714285714292.49387003572801220.569404456095
Winsorized Mean ( 15 / 28 )550.4285714285712.441118746134225.48209598582
Winsorized Mean ( 16 / 28 )550.8095238095242.33125119319691236.272060864528
Winsorized Mean ( 17 / 28 )550.8095238095242.21541282488074248.626133072591
Winsorized Mean ( 18 / 28 )550.3809523809522.09340855292286262.911389949419
Winsorized Mean ( 19 / 28 )550.6071428571432.06325791770703266.86297342266
Winsorized Mean ( 20 / 28 )549.8928571428571.96388928352419280.001964344995
Winsorized Mean ( 21 / 28 )549.8928571428571.96388928352419280.001964344995
Winsorized Mean ( 22 / 28 )550.1547619047621.85902259710007295.937640974865
Winsorized Mean ( 23 / 28 )548.7857142857141.61160374084028340.521494446012
Winsorized Mean ( 24 / 28 )549.0714285714291.57393661014342348.852314021334
Winsorized Mean ( 25 / 28 )549.3690476190481.53537179243137357.808480217735
Winsorized Mean ( 26 / 28 )549.3690476190481.45813441920906376.761593706184
Winsorized Mean ( 27 / 28 )550.0119047619051.37789428839796399.168433596882
Winsorized Mean ( 28 / 28 )549.6785714285711.33750359534165410.973528103423
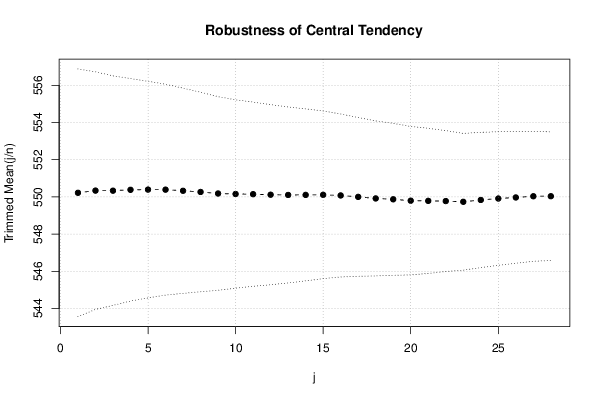
Trimmed Mean ( 1 / 28 )550.2195121951223.3295834549101165.251755856643
Trimmed Mean ( 2 / 28 )550.33753.19403834252883172.301469482135
Trimmed Mean ( 3 / 28 )550.3333333333333.08486183100192178.398049404564
Trimmed Mean ( 4 / 28 )550.3815789473682.99086135016015184.021094430839
Trimmed Mean ( 5 / 28 )550.3918918918922.91130248853898189.053488621893
Trimmed Mean ( 6 / 28 )550.3888888888892.83482117491083194.152948256498
Trimmed Mean ( 7 / 28 )550.3285714285712.75829045298187199.517991600063
Trimmed Mean ( 8 / 28 )550.2647058823532.68221941429432205.152756314354
Trimmed Mean ( 9 / 28 )550.1818181818182.60284129231204211.37739738757
Trimmed Mean ( 10 / 28 )550.156252.53264585263731217.225890239296
Trimmed Mean ( 11 / 28 )550.1451612903232.47663291903537222.134316741861
Trimmed Mean ( 12 / 28 )550.1166666666672.42084773715291227.241332952912
Trimmed Mean ( 13 / 28 )550.1034482758622.36565075225677232.537895862725
Trimmed Mean ( 14 / 28 )550.1071428571432.31127650279152238.010096235882
Trimmed Mean ( 15 / 28 )550.1111111111112.25329429876172244.136379084357
Trimmed Mean ( 16 / 28 )550.0769230769232.19089817354028251.073705624599
Trimmed Mean ( 17 / 28 )5502.13369469728555257.76883670363
Trimmed Mean ( 18 / 28 )549.9166666666672.08354608842725263.933046511953
Trimmed Mean ( 19 / 28 )549.8695652173912.04292314384184269.158224025662
Trimmed Mean ( 20 / 28 )549.7954545454551.99486114260661275.605876921868
Trimmed Mean ( 21 / 28 )549.7857142857141.95195953073402281.658356963462
Trimmed Mean ( 22 / 28 )549.7751.8934731011069290.352685590626
Trimmed Mean ( 23 / 28 )549.7368421052631.83830129489695299.046105027131
Trimmed Mean ( 24 / 28 )549.8333333333331.81855515647529302.346250745024
Trimmed Mean ( 25 / 28 )549.9117647058821.79589929362204306.204121054472
Trimmed Mean ( 26 / 28 )549.968751.76918309413258310.860278862006
Trimmed Mean ( 27 / 28 )550.0333333333331.74624940176943314.979826350119
Trimmed Mean ( 28 / 28 )550.0357142857141.72936216554603318.056983808273
Median550
Midrange545.5
Midmean - Weighted Average at Xnp549.311111111111
Midmean - Weighted Average at X(n+1)p549.311111111111
Midmean - Empirical Distribution Function549.311111111111
Midmean - Empirical Distribution Function - Averaging549.311111111111
Midmean - Empirical Distribution Function - Interpolation549.311111111111
Midmean - Closest Observation549.311111111111
Midmean - True Basic - Statistics Graphics Toolkit549.311111111111
Midmean - MS Excel (old versions)549.311111111111
Number of observations84

\begin{tabular}{lllllllll}
\hline
Central Tendency - Ungrouped Data \tabularnewline
Measure & Value & S.E. & Value/S.E. \tabularnewline
Arithmetic Mean & 550.107142857143 & 3.49948844131151 & 157.196445161276 \tabularnewline
Geometric Mean & 549.177488576047 &  &  \tabularnewline
Harmonic Mean & 548.241634029394 &  &  \tabularnewline
Quadratic Mean & 551.03023640139 &  &  \tabularnewline
Winsorized Mean ( 1 / 28 ) & 550.107142857143 & 3.44596090305232 & 159.638242665457 \tabularnewline
Winsorized Mean ( 2 / 28 ) & 550.345238095238 & 3.36865227402912 & 163.372528039823 \tabularnewline
Winsorized Mean ( 3 / 28 ) & 550.202380952381 & 3.29413758738283 & 167.024711736316 \tabularnewline
Winsorized Mean ( 4 / 28 ) & 550.345238095238 & 3.20903477728762 & 171.498683027801 \tabularnewline
Winsorized Mean ( 5 / 28 ) & 550.404761904762 & 3.15292572593796 & 174.569529937475 \tabularnewline
Winsorized Mean ( 6 / 28 ) & 550.690476190476 & 3.10168907172682 & 177.545351405545 \tabularnewline
Winsorized Mean ( 7 / 28 ) & 550.690476190476 & 3.04220532677859 & 181.016866725957 \tabularnewline
Winsorized Mean ( 8 / 28 ) & 550.785714285714 & 2.99306290259497 & 184.020761410722 \tabularnewline
Winsorized Mean ( 9 / 28 ) & 550.357142857143 & 2.88111358799435 & 191.022368972362 \tabularnewline
Winsorized Mean ( 10 / 28 ) & 550.238095238095 & 2.74434792071466 & 200.498665305821 \tabularnewline
Winsorized Mean ( 11 / 28 ) & 550.369047619048 & 2.68224329188305 & 205.189830946567 \tabularnewline
Winsorized Mean ( 12 / 28 ) & 550.22619047619 & 2.61518093276445 & 210.396987674027 \tabularnewline
Winsorized Mean ( 13 / 28 ) & 550.071428571429 & 2.54409115467485 & 216.215298559823 \tabularnewline
Winsorized Mean ( 14 / 28 ) & 550.071428571429 & 2.49387003572801 & 220.569404456095 \tabularnewline
Winsorized Mean ( 15 / 28 ) & 550.428571428571 & 2.441118746134 & 225.48209598582 \tabularnewline
Winsorized Mean ( 16 / 28 ) & 550.809523809524 & 2.33125119319691 & 236.272060864528 \tabularnewline
Winsorized Mean ( 17 / 28 ) & 550.809523809524 & 2.21541282488074 & 248.626133072591 \tabularnewline
Winsorized Mean ( 18 / 28 ) & 550.380952380952 & 2.09340855292286 & 262.911389949419 \tabularnewline
Winsorized Mean ( 19 / 28 ) & 550.607142857143 & 2.06325791770703 & 266.86297342266 \tabularnewline
Winsorized Mean ( 20 / 28 ) & 549.892857142857 & 1.96388928352419 & 280.001964344995 \tabularnewline
Winsorized Mean ( 21 / 28 ) & 549.892857142857 & 1.96388928352419 & 280.001964344995 \tabularnewline
Winsorized Mean ( 22 / 28 ) & 550.154761904762 & 1.85902259710007 & 295.937640974865 \tabularnewline
Winsorized Mean ( 23 / 28 ) & 548.785714285714 & 1.61160374084028 & 340.521494446012 \tabularnewline
Winsorized Mean ( 24 / 28 ) & 549.071428571429 & 1.57393661014342 & 348.852314021334 \tabularnewline
Winsorized Mean ( 25 / 28 ) & 549.369047619048 & 1.53537179243137 & 357.808480217735 \tabularnewline
Winsorized Mean ( 26 / 28 ) & 549.369047619048 & 1.45813441920906 & 376.761593706184 \tabularnewline
Winsorized Mean ( 27 / 28 ) & 550.011904761905 & 1.37789428839796 & 399.168433596882 \tabularnewline
Winsorized Mean ( 28 / 28 ) & 549.678571428571 & 1.33750359534165 & 410.973528103423 \tabularnewline
Trimmed Mean ( 1 / 28 ) & 550.219512195122 & 3.3295834549101 & 165.251755856643 \tabularnewline
Trimmed Mean ( 2 / 28 ) & 550.3375 & 3.19403834252883 & 172.301469482135 \tabularnewline
Trimmed Mean ( 3 / 28 ) & 550.333333333333 & 3.08486183100192 & 178.398049404564 \tabularnewline
Trimmed Mean ( 4 / 28 ) & 550.381578947368 & 2.99086135016015 & 184.021094430839 \tabularnewline
Trimmed Mean ( 5 / 28 ) & 550.391891891892 & 2.91130248853898 & 189.053488621893 \tabularnewline
Trimmed Mean ( 6 / 28 ) & 550.388888888889 & 2.83482117491083 & 194.152948256498 \tabularnewline
Trimmed Mean ( 7 / 28 ) & 550.328571428571 & 2.75829045298187 & 199.517991600063 \tabularnewline
Trimmed Mean ( 8 / 28 ) & 550.264705882353 & 2.68221941429432 & 205.152756314354 \tabularnewline
Trimmed Mean ( 9 / 28 ) & 550.181818181818 & 2.60284129231204 & 211.37739738757 \tabularnewline
Trimmed Mean ( 10 / 28 ) & 550.15625 & 2.53264585263731 & 217.225890239296 \tabularnewline
Trimmed Mean ( 11 / 28 ) & 550.145161290323 & 2.47663291903537 & 222.134316741861 \tabularnewline
Trimmed Mean ( 12 / 28 ) & 550.116666666667 & 2.42084773715291 & 227.241332952912 \tabularnewline
Trimmed Mean ( 13 / 28 ) & 550.103448275862 & 2.36565075225677 & 232.537895862725 \tabularnewline
Trimmed Mean ( 14 / 28 ) & 550.107142857143 & 2.31127650279152 & 238.010096235882 \tabularnewline
Trimmed Mean ( 15 / 28 ) & 550.111111111111 & 2.25329429876172 & 244.136379084357 \tabularnewline
Trimmed Mean ( 16 / 28 ) & 550.076923076923 & 2.19089817354028 & 251.073705624599 \tabularnewline
Trimmed Mean ( 17 / 28 ) & 550 & 2.13369469728555 & 257.76883670363 \tabularnewline
Trimmed Mean ( 18 / 28 ) & 549.916666666667 & 2.08354608842725 & 263.933046511953 \tabularnewline
Trimmed Mean ( 19 / 28 ) & 549.869565217391 & 2.04292314384184 & 269.158224025662 \tabularnewline
Trimmed Mean ( 20 / 28 ) & 549.795454545455 & 1.99486114260661 & 275.605876921868 \tabularnewline
Trimmed Mean ( 21 / 28 ) & 549.785714285714 & 1.95195953073402 & 281.658356963462 \tabularnewline
Trimmed Mean ( 22 / 28 ) & 549.775 & 1.8934731011069 & 290.352685590626 \tabularnewline
Trimmed Mean ( 23 / 28 ) & 549.736842105263 & 1.83830129489695 & 299.046105027131 \tabularnewline
Trimmed Mean ( 24 / 28 ) & 549.833333333333 & 1.81855515647529 & 302.346250745024 \tabularnewline
Trimmed Mean ( 25 / 28 ) & 549.911764705882 & 1.79589929362204 & 306.204121054472 \tabularnewline
Trimmed Mean ( 26 / 28 ) & 549.96875 & 1.76918309413258 & 310.860278862006 \tabularnewline
Trimmed Mean ( 27 / 28 ) & 550.033333333333 & 1.74624940176943 & 314.979826350119 \tabularnewline
Trimmed Mean ( 28 / 28 ) & 550.035714285714 & 1.72936216554603 & 318.056983808273 \tabularnewline
Median & 550 &  &  \tabularnewline
Midrange & 545.5 &  &  \tabularnewline
Midmean - Weighted Average at Xnp & 549.311111111111 &  &  \tabularnewline
Midmean - Weighted Average at X(n+1)p & 549.311111111111 &  &  \tabularnewline
Midmean - Empirical Distribution Function & 549.311111111111 &  &  \tabularnewline
Midmean - Empirical Distribution Function - Averaging & 549.311111111111 &  &  \tabularnewline
Midmean - Empirical Distribution Function - Interpolation & 549.311111111111 &  &  \tabularnewline
Midmean - Closest Observation & 549.311111111111 &  &  \tabularnewline
Midmean - True Basic - Statistics Graphics Toolkit & 549.311111111111 &  &  \tabularnewline
Midmean - MS Excel (old versions) & 549.311111111111 &  &  \tabularnewline
Number of observations & 84 &  &  \tabularnewline
\hline
\end{tabular}
%Source: https://freestatistics.org/blog/index.php?pk=240614&T=1

[TABLE]
[ROW][C]Central Tendency - Ungrouped Data[/C][/ROW]
[ROW][C]Measure[/C][C]Value[/C][C]S.E.[/C][C]Value/S.E.[/C][/ROW]
[ROW][C]Arithmetic Mean[/C][C]550.107142857143[/C][C]3.49948844131151[/C][C]157.196445161276[/C][/ROW]
[ROW][C]Geometric Mean[/C][C]549.177488576047[/C][C][/C][C][/C][/ROW]
[ROW][C]Harmonic Mean[/C][C]548.241634029394[/C][C][/C][C][/C][/ROW]
[ROW][C]Quadratic Mean[/C][C]551.03023640139[/C][C][/C][C][/C][/ROW]
[ROW][C]Winsorized Mean ( 1 / 28 )[/C][C]550.107142857143[/C][C]3.44596090305232[/C][C]159.638242665457[/C][/ROW]
[ROW][C]Winsorized Mean ( 2 / 28 )[/C][C]550.345238095238[/C][C]3.36865227402912[/C][C]163.372528039823[/C][/ROW]
[ROW][C]Winsorized Mean ( 3 / 28 )[/C][C]550.202380952381[/C][C]3.29413758738283[/C][C]167.024711736316[/C][/ROW]
[ROW][C]Winsorized Mean ( 4 / 28 )[/C][C]550.345238095238[/C][C]3.20903477728762[/C][C]171.498683027801[/C][/ROW]
[ROW][C]Winsorized Mean ( 5 / 28 )[/C][C]550.404761904762[/C][C]3.15292572593796[/C][C]174.569529937475[/C][/ROW]
[ROW][C]Winsorized Mean ( 6 / 28 )[/C][C]550.690476190476[/C][C]3.10168907172682[/C][C]177.545351405545[/C][/ROW]
[ROW][C]Winsorized Mean ( 7 / 28 )[/C][C]550.690476190476[/C][C]3.04220532677859[/C][C]181.016866725957[/C][/ROW]
[ROW][C]Winsorized Mean ( 8 / 28 )[/C][C]550.785714285714[/C][C]2.99306290259497[/C][C]184.020761410722[/C][/ROW]
[ROW][C]Winsorized Mean ( 9 / 28 )[/C][C]550.357142857143[/C][C]2.88111358799435[/C][C]191.022368972362[/C][/ROW]
[ROW][C]Winsorized Mean ( 10 / 28 )[/C][C]550.238095238095[/C][C]2.74434792071466[/C][C]200.498665305821[/C][/ROW]
[ROW][C]Winsorized Mean ( 11 / 28 )[/C][C]550.369047619048[/C][C]2.68224329188305[/C][C]205.189830946567[/C][/ROW]
[ROW][C]Winsorized Mean ( 12 / 28 )[/C][C]550.22619047619[/C][C]2.61518093276445[/C][C]210.396987674027[/C][/ROW]
[ROW][C]Winsorized Mean ( 13 / 28 )[/C][C]550.071428571429[/C][C]2.54409115467485[/C][C]216.215298559823[/C][/ROW]
[ROW][C]Winsorized Mean ( 14 / 28 )[/C][C]550.071428571429[/C][C]2.49387003572801[/C][C]220.569404456095[/C][/ROW]
[ROW][C]Winsorized Mean ( 15 / 28 )[/C][C]550.428571428571[/C][C]2.441118746134[/C][C]225.48209598582[/C][/ROW]
[ROW][C]Winsorized Mean ( 16 / 28 )[/C][C]550.809523809524[/C][C]2.33125119319691[/C][C]236.272060864528[/C][/ROW]
[ROW][C]Winsorized Mean ( 17 / 28 )[/C][C]550.809523809524[/C][C]2.21541282488074[/C][C]248.626133072591[/C][/ROW]
[ROW][C]Winsorized Mean ( 18 / 28 )[/C][C]550.380952380952[/C][C]2.09340855292286[/C][C]262.911389949419[/C][/ROW]
[ROW][C]Winsorized Mean ( 19 / 28 )[/C][C]550.607142857143[/C][C]2.06325791770703[/C][C]266.86297342266[/C][/ROW]
[ROW][C]Winsorized Mean ( 20 / 28 )[/C][C]549.892857142857[/C][C]1.96388928352419[/C][C]280.001964344995[/C][/ROW]
[ROW][C]Winsorized Mean ( 21 / 28 )[/C][C]549.892857142857[/C][C]1.96388928352419[/C][C]280.001964344995[/C][/ROW]
[ROW][C]Winsorized Mean ( 22 / 28 )[/C][C]550.154761904762[/C][C]1.85902259710007[/C][C]295.937640974865[/C][/ROW]
[ROW][C]Winsorized Mean ( 23 / 28 )[/C][C]548.785714285714[/C][C]1.61160374084028[/C][C]340.521494446012[/C][/ROW]
[ROW][C]Winsorized Mean ( 24 / 28 )[/C][C]549.071428571429[/C][C]1.57393661014342[/C][C]348.852314021334[/C][/ROW]
[ROW][C]Winsorized Mean ( 25 / 28 )[/C][C]549.369047619048[/C][C]1.53537179243137[/C][C]357.808480217735[/C][/ROW]
[ROW][C]Winsorized Mean ( 26 / 28 )[/C][C]549.369047619048[/C][C]1.45813441920906[/C][C]376.761593706184[/C][/ROW]
[ROW][C]Winsorized Mean ( 27 / 28 )[/C][C]550.011904761905[/C][C]1.37789428839796[/C][C]399.168433596882[/C][/ROW]
[ROW][C]Winsorized Mean ( 28 / 28 )[/C][C]549.678571428571[/C][C]1.33750359534165[/C][C]410.973528103423[/C][/ROW]
[ROW][C]Trimmed Mean ( 1 / 28 )[/C][C]550.219512195122[/C][C]3.3295834549101[/C][C]165.251755856643[/C][/ROW]
[ROW][C]Trimmed Mean ( 2 / 28 )[/C][C]550.3375[/C][C]3.19403834252883[/C][C]172.301469482135[/C][/ROW]
[ROW][C]Trimmed Mean ( 3 / 28 )[/C][C]550.333333333333[/C][C]3.08486183100192[/C][C]178.398049404564[/C][/ROW]
[ROW][C]Trimmed Mean ( 4 / 28 )[/C][C]550.381578947368[/C][C]2.99086135016015[/C][C]184.021094430839[/C][/ROW]
[ROW][C]Trimmed Mean ( 5 / 28 )[/C][C]550.391891891892[/C][C]2.91130248853898[/C][C]189.053488621893[/C][/ROW]
[ROW][C]Trimmed Mean ( 6 / 28 )[/C][C]550.388888888889[/C][C]2.83482117491083[/C][C]194.152948256498[/C][/ROW]
[ROW][C]Trimmed Mean ( 7 / 28 )[/C][C]550.328571428571[/C][C]2.75829045298187[/C][C]199.517991600063[/C][/ROW]
[ROW][C]Trimmed Mean ( 8 / 28 )[/C][C]550.264705882353[/C][C]2.68221941429432[/C][C]205.152756314354[/C][/ROW]
[ROW][C]Trimmed Mean ( 9 / 28 )[/C][C]550.181818181818[/C][C]2.60284129231204[/C][C]211.37739738757[/C][/ROW]
[ROW][C]Trimmed Mean ( 10 / 28 )[/C][C]550.15625[/C][C]2.53264585263731[/C][C]217.225890239296[/C][/ROW]
[ROW][C]Trimmed Mean ( 11 / 28 )[/C][C]550.145161290323[/C][C]2.47663291903537[/C][C]222.134316741861[/C][/ROW]
[ROW][C]Trimmed Mean ( 12 / 28 )[/C][C]550.116666666667[/C][C]2.42084773715291[/C][C]227.241332952912[/C][/ROW]
[ROW][C]Trimmed Mean ( 13 / 28 )[/C][C]550.103448275862[/C][C]2.36565075225677[/C][C]232.537895862725[/C][/ROW]
[ROW][C]Trimmed Mean ( 14 / 28 )[/C][C]550.107142857143[/C][C]2.31127650279152[/C][C]238.010096235882[/C][/ROW]
[ROW][C]Trimmed Mean ( 15 / 28 )[/C][C]550.111111111111[/C][C]2.25329429876172[/C][C]244.136379084357[/C][/ROW]
[ROW][C]Trimmed Mean ( 16 / 28 )[/C][C]550.076923076923[/C][C]2.19089817354028[/C][C]251.073705624599[/C][/ROW]
[ROW][C]Trimmed Mean ( 17 / 28 )[/C][C]550[/C][C]2.13369469728555[/C][C]257.76883670363[/C][/ROW]
[ROW][C]Trimmed Mean ( 18 / 28 )[/C][C]549.916666666667[/C][C]2.08354608842725[/C][C]263.933046511953[/C][/ROW]
[ROW][C]Trimmed Mean ( 19 / 28 )[/C][C]549.869565217391[/C][C]2.04292314384184[/C][C]269.158224025662[/C][/ROW]
[ROW][C]Trimmed Mean ( 20 / 28 )[/C][C]549.795454545455[/C][C]1.99486114260661[/C][C]275.605876921868[/C][/ROW]
[ROW][C]Trimmed Mean ( 21 / 28 )[/C][C]549.785714285714[/C][C]1.95195953073402[/C][C]281.658356963462[/C][/ROW]
[ROW][C]Trimmed Mean ( 22 / 28 )[/C][C]549.775[/C][C]1.8934731011069[/C][C]290.352685590626[/C][/ROW]
[ROW][C]Trimmed Mean ( 23 / 28 )[/C][C]549.736842105263[/C][C]1.83830129489695[/C][C]299.046105027131[/C][/ROW]
[ROW][C]Trimmed Mean ( 24 / 28 )[/C][C]549.833333333333[/C][C]1.81855515647529[/C][C]302.346250745024[/C][/ROW]
[ROW][C]Trimmed Mean ( 25 / 28 )[/C][C]549.911764705882[/C][C]1.79589929362204[/C][C]306.204121054472[/C][/ROW]
[ROW][C]Trimmed Mean ( 26 / 28 )[/C][C]549.96875[/C][C]1.76918309413258[/C][C]310.860278862006[/C][/ROW]
[ROW][C]Trimmed Mean ( 27 / 28 )[/C][C]550.033333333333[/C][C]1.74624940176943[/C][C]314.979826350119[/C][/ROW]
[ROW][C]Trimmed Mean ( 28 / 28 )[/C][C]550.035714285714[/C][C]1.72936216554603[/C][C]318.056983808273[/C][/ROW]
[ROW][C]Median[/C][C]550[/C][C][/C][C][/C][/ROW]
[ROW][C]Midrange[/C][C]545.5[/C][C][/C][C][/C][/ROW]
[ROW][C]Midmean - Weighted Average at Xnp[/C][C]549.311111111111[/C][C][/C][C][/C][/ROW]
[ROW][C]Midmean - Weighted Average at X(n+1)p[/C][C]549.311111111111[/C][C][/C][C][/C][/ROW]
[ROW][C]Midmean - Empirical Distribution Function[/C][C]549.311111111111[/C][C][/C][C][/C][/ROW]
[ROW][C]Midmean - Empirical Distribution Function - Averaging[/C][C]549.311111111111[/C][C][/C][C][/C][/ROW]
[ROW][C]Midmean - Empirical Distribution Function - Interpolation[/C][C]549.311111111111[/C][C][/C][C][/C][/ROW]
[ROW][C]Midmean - Closest Observation[/C][C]549.311111111111[/C][C][/C][C][/C][/ROW]
[ROW][C]Midmean - True Basic - Statistics Graphics Toolkit[/C][C]549.311111111111[/C][C][/C][C][/C][/ROW]
[ROW][C]Midmean - MS Excel (old versions)[/C][C]549.311111111111[/C][C][/C][C][/C][/ROW]
[ROW][C]Number of observations[/C][C]84[/C][C][/C][C][/C][/ROW]
[/TABLE]
Source: https://freestatistics.org/blog/index.php?pk=240614&T=1

Globally Unique Identifier (entire table): ba.freestatistics.org/blog/index.php?pk=240614&T=1

As an alternative you can also use a QR Code:  

The GUIDs for individual cells are displayed in the table below:

Central Tendency - Ungrouped Data
MeasureValueS.E.Value/S.E.
Arithmetic Mean550.1071428571433.49948844131151157.196445161276
Geometric Mean549.177488576047
Harmonic Mean548.241634029394
Quadratic Mean551.03023640139
Winsorized Mean ( 1 / 28 )550.1071428571433.44596090305232159.638242665457
Winsorized Mean ( 2 / 28 )550.3452380952383.36865227402912163.372528039823
Winsorized Mean ( 3 / 28 )550.2023809523813.29413758738283167.024711736316
Winsorized Mean ( 4 / 28 )550.3452380952383.20903477728762171.498683027801
Winsorized Mean ( 5 / 28 )550.4047619047623.15292572593796174.569529937475
Winsorized Mean ( 6 / 28 )550.6904761904763.10168907172682177.545351405545
Winsorized Mean ( 7 / 28 )550.6904761904763.04220532677859181.016866725957
Winsorized Mean ( 8 / 28 )550.7857142857142.99306290259497184.020761410722
Winsorized Mean ( 9 / 28 )550.3571428571432.88111358799435191.022368972362
Winsorized Mean ( 10 / 28 )550.2380952380952.74434792071466200.498665305821
Winsorized Mean ( 11 / 28 )550.3690476190482.68224329188305205.189830946567
Winsorized Mean ( 12 / 28 )550.226190476192.61518093276445210.396987674027
Winsorized Mean ( 13 / 28 )550.0714285714292.54409115467485216.215298559823
Winsorized Mean ( 14 / 28 )550.0714285714292.49387003572801220.569404456095
Winsorized Mean ( 15 / 28 )550.4285714285712.441118746134225.48209598582
Winsorized Mean ( 16 / 28 )550.8095238095242.33125119319691236.272060864528
Winsorized Mean ( 17 / 28 )550.8095238095242.21541282488074248.626133072591
Winsorized Mean ( 18 / 28 )550.3809523809522.09340855292286262.911389949419
Winsorized Mean ( 19 / 28 )550.6071428571432.06325791770703266.86297342266
Winsorized Mean ( 20 / 28 )549.8928571428571.96388928352419280.001964344995
Winsorized Mean ( 21 / 28 )549.8928571428571.96388928352419280.001964344995
Winsorized Mean ( 22 / 28 )550.1547619047621.85902259710007295.937640974865
Winsorized Mean ( 23 / 28 )548.7857142857141.61160374084028340.521494446012
Winsorized Mean ( 24 / 28 )549.0714285714291.57393661014342348.852314021334
Winsorized Mean ( 25 / 28 )549.3690476190481.53537179243137357.808480217735
Winsorized Mean ( 26 / 28 )549.3690476190481.45813441920906376.761593706184
Winsorized Mean ( 27 / 28 )550.0119047619051.37789428839796399.168433596882
Winsorized Mean ( 28 / 28 )549.6785714285711.33750359534165410.973528103423
Trimmed Mean ( 1 / 28 )550.2195121951223.3295834549101165.251755856643
Trimmed Mean ( 2 / 28 )550.33753.19403834252883172.301469482135
Trimmed Mean ( 3 / 28 )550.3333333333333.08486183100192178.398049404564
Trimmed Mean ( 4 / 28 )550.3815789473682.99086135016015184.021094430839
Trimmed Mean ( 5 / 28 )550.3918918918922.91130248853898189.053488621893
Trimmed Mean ( 6 / 28 )550.3888888888892.83482117491083194.152948256498
Trimmed Mean ( 7 / 28 )550.3285714285712.75829045298187199.517991600063
Trimmed Mean ( 8 / 28 )550.2647058823532.68221941429432205.152756314354
Trimmed Mean ( 9 / 28 )550.1818181818182.60284129231204211.37739738757
Trimmed Mean ( 10 / 28 )550.156252.53264585263731217.225890239296
Trimmed Mean ( 11 / 28 )550.1451612903232.47663291903537222.134316741861
Trimmed Mean ( 12 / 28 )550.1166666666672.42084773715291227.241332952912
Trimmed Mean ( 13 / 28 )550.1034482758622.36565075225677232.537895862725
Trimmed Mean ( 14 / 28 )550.1071428571432.31127650279152238.010096235882
Trimmed Mean ( 15 / 28 )550.1111111111112.25329429876172244.136379084357
Trimmed Mean ( 16 / 28 )550.0769230769232.19089817354028251.073705624599
Trimmed Mean ( 17 / 28 )5502.13369469728555257.76883670363
Trimmed Mean ( 18 / 28 )549.9166666666672.08354608842725263.933046511953
Trimmed Mean ( 19 / 28 )549.8695652173912.04292314384184269.158224025662
Trimmed Mean ( 20 / 28 )549.7954545454551.99486114260661275.605876921868
Trimmed Mean ( 21 / 28 )549.7857142857141.95195953073402281.658356963462
Trimmed Mean ( 22 / 28 )549.7751.8934731011069290.352685590626
Trimmed Mean ( 23 / 28 )549.7368421052631.83830129489695299.046105027131
Trimmed Mean ( 24 / 28 )549.8333333333331.81855515647529302.346250745024
Trimmed Mean ( 25 / 28 )549.9117647058821.79589929362204306.204121054472
Trimmed Mean ( 26 / 28 )549.968751.76918309413258310.860278862006
Trimmed Mean ( 27 / 28 )550.0333333333331.74624940176943314.979826350119
Trimmed Mean ( 28 / 28 )550.0357142857141.72936216554603318.056983808273
Median550
Midrange545.5
Midmean - Weighted Average at Xnp549.311111111111
Midmean - Weighted Average at X(n+1)p549.311111111111
Midmean - Empirical Distribution Function549.311111111111
Midmean - Empirical Distribution Function - Averaging549.311111111111
Midmean - Empirical Distribution Function - Interpolation549.311111111111
Midmean - Closest Observation549.311111111111
Midmean - True Basic - Statistics Graphics Toolkit549.311111111111
Midmean - MS Excel (old versions)549.311111111111
Number of observations84


Parameters (Session):
Parameters (R input):
R code (references can be found in the software module):
geomean <- function(x) {
return(exp(mean(log(x))))
}
harmean <- function(x) {
return(1/mean(1/x))
}
quamean <- function(x) {
return(sqrt(mean(x*x)))
}
winmean <- function(x) {
x <-sort(x[!is.na(x)])
n<-length(x)
denom <- 3
nodenom <- n/denom
if (nodenom>40) denom <- n/40
sqrtn = sqrt(n)
roundnodenom = floor(nodenom)
win <- array(NA,dim=c(roundnodenom,2))
for (j in 1:roundnodenom) {
win[j,1] <- (j*x[j+1]+sum(x[(j+1):(n-j)])+j*x[n-j])/n
win[j,2] <- sd(c(rep(x[j+1],j),x[(j+1):(n-j)],rep(x[n-j],j)))/sqrtn
}
return(win)
}
trimean <- function(x) {
x <-sort(x[!is.na(x)])
n<-length(x)
denom <- 3
nodenom <- n/denom
if (nodenom>40) denom <- n/40
sqrtn = sqrt(n)
roundnodenom = floor(nodenom)
tri <- array(NA,dim=c(roundnodenom,2))
for (j in 1:roundnodenom) {
tri[j,1] <- mean(x,trim=j/n)
tri[j,2] <- sd(x[(j+1):(n-j)]) / sqrt(n-j*2)
}
return(tri)
}
midrange <- function(x) {
return((max(x)+min(x))/2)
}
q1 <- function(data,n,p,i,f) {
np <- n*p;
i <<- floor(np)
f <<- np - i
qvalue <- (1-f)*data[i] + f*data[i+1]
}
q2 <- function(data,n,p,i,f) {
np <- (n+1)*p
i <<- floor(np)
f <<- np - i
qvalue <- (1-f)*data[i] + f*data[i+1]
}
q3 <- function(data,n,p,i,f) {
np <- n*p
i <<- floor(np)
f <<- np - i
if (f==0) {
qvalue <- data[i]
} else {
qvalue <- data[i+1]
}
}
q4 <- function(data,n,p,i,f) {
np <- n*p
i <<- floor(np)
f <<- np - i
if (f==0) {
qvalue <- (data[i]+data[i+1])/2
} else {
qvalue <- data[i+1]
}
}
q5 <- function(data,n,p,i,f) {
np <- (n-1)*p
i <<- floor(np)
f <<- np - i
if (f==0) {
qvalue <- data[i+1]
} else {
qvalue <- data[i+1] + f*(data[i+2]-data[i+1])
}
}
q6 <- function(data,n,p,i,f) {
np <- n*p+0.5
i <<- floor(np)
f <<- np - i
qvalue <- data[i]
}
q7 <- function(data,n,p,i,f) {
np <- (n+1)*p
i <<- floor(np)
f <<- np - i
if (f==0) {
qvalue <- data[i]
} else {
qvalue <- f*data[i] + (1-f)*data[i+1]
}
}
q8 <- function(data,n,p,i,f) {
np <- (n+1)*p
i <<- floor(np)
f <<- np - i
if (f==0) {
qvalue <- data[i]
} else {
if (f == 0.5) {
qvalue <- (data[i]+data[i+1])/2
} else {
if (f < 0.5) {
qvalue <- data[i]
} else {
qvalue <- data[i+1]
}
}
}
}
midmean <- function(x,def) {
x <-sort(x[!is.na(x)])
n<-length(x)
if (def==1) {
qvalue1 <- q1(x,n,0.25,i,f)
qvalue3 <- q1(x,n,0.75,i,f)
}
if (def==2) {
qvalue1 <- q2(x,n,0.25,i,f)
qvalue3 <- q2(x,n,0.75,i,f)
}
if (def==3) {
qvalue1 <- q3(x,n,0.25,i,f)
qvalue3 <- q3(x,n,0.75,i,f)
}
if (def==4) {
qvalue1 <- q4(x,n,0.25,i,f)
qvalue3 <- q4(x,n,0.75,i,f)
}
if (def==5) {
qvalue1 <- q5(x,n,0.25,i,f)
qvalue3 <- q5(x,n,0.75,i,f)
}
if (def==6) {
qvalue1 <- q6(x,n,0.25,i,f)
qvalue3 <- q6(x,n,0.75,i,f)
}
if (def==7) {
qvalue1 <- q7(x,n,0.25,i,f)
qvalue3 <- q7(x,n,0.75,i,f)
}
if (def==8) {
qvalue1 <- q8(x,n,0.25,i,f)
qvalue3 <- q8(x,n,0.75,i,f)
}
midm <- 0
myn <- 0
roundno4 <- round(n/4)
round3no4 <- round(3*n/4)
for (i in 1:n) {
if ((x[i]>=qvalue1) & (x[i]<=qvalue3)){
midm = midm + x[i]
myn = myn + 1
}
}
midm = midm / myn
return(midm)
}
(arm <- mean(x))
sqrtn <- sqrt(length(x))
(armse <- sd(x) / sqrtn)
(armose <- arm / armse)
(geo <- geomean(x))
(har <- harmean(x))
(qua <- quamean(x))
(win <- winmean(x))
(tri <- trimean(x))
(midr <- midrange(x))
midm <- array(NA,dim=8)
for (j in 1:8) midm[j] <- midmean(x,j)
midm
bitmap(file='test1.png')
lb <- win[,1] - 2*win[,2]
ub <- win[,1] + 2*win[,2]
if ((ylimmin == '') | (ylimmax == '')) plot(win[,1],type='b',main=main, xlab='j', pch=19, ylab='Winsorized Mean(j/n)', ylim=c(min(lb),max(ub))) else plot(win[,1],type='l',main=main, xlab='j', pch=19, ylab='Winsorized Mean(j/n)', ylim=c(ylimmin,ylimmax))
lines(ub,lty=3)
lines(lb,lty=3)
grid()
dev.off()
bitmap(file='test2.png')
lb <- tri[,1] - 2*tri[,2]
ub <- tri[,1] + 2*tri[,2]
if ((ylimmin == '') | (ylimmax == '')) plot(tri[,1],type='b',main=main, xlab='j', pch=19, ylab='Trimmed Mean(j/n)', ylim=c(min(lb),max(ub))) else plot(tri[,1],type='l',main=main, xlab='j', pch=19, ylab='Trimmed Mean(j/n)', ylim=c(ylimmin,ylimmax))
lines(ub,lty=3)
lines(lb,lty=3)
grid()
dev.off()
load(file='createtable')
a<-table.start()
a<-table.row.start(a)
a<-table.element(a,'Central Tendency - Ungrouped Data',4,TRUE)
a<-table.row.end(a)
a<-table.row.start(a)
a<-table.element(a,'Measure',header=TRUE)
a<-table.element(a,'Value',header=TRUE)
a<-table.element(a,'S.E.',header=TRUE)
a<-table.element(a,'Value/S.E.',header=TRUE)
a<-table.row.end(a)
a<-table.row.start(a)
a<-table.element(a,hyperlink('arithmetic_mean.htm', 'Arithmetic Mean', 'click to view the definition of the Arithmetic Mean'),header=TRUE)
a<-table.element(a,arm)
a<-table.element(a,hyperlink('arithmetic_mean_standard_error.htm', armse, 'click to view the definition of the Standard Error of the Arithmetic Mean'))
a<-table.element(a,armose)
a<-table.row.end(a)
a<-table.row.start(a)
a<-table.element(a,hyperlink('geometric_mean.htm', 'Geometric Mean', 'click to view the definition of the Geometric Mean'),header=TRUE)
a<-table.element(a,geo)
a<-table.element(a,'')
a<-table.row.end(a)
a<-table.row.start(a)
a<-table.element(a,hyperlink('harmonic_mean.htm', 'Harmonic Mean', 'click to view the definition of the Harmonic Mean'),header=TRUE)
a<-table.element(a,har)
a<-table.element(a,'')
a<-table.row.end(a)
a<-table.row.start(a)
a<-table.element(a,hyperlink('quadratic_mean.htm', 'Quadratic Mean', 'click to view the definition of the Quadratic Mean'),header=TRUE)
a<-table.element(a,qua)
a<-table.element(a,'')
a<-table.row.end(a)
for (j in 1:length(win[,1])) {
a<-table.row.start(a)
mylabel <- paste('Winsorized Mean (',j)
mylabel <- paste(mylabel,'/')
mylabel <- paste(mylabel,length(win[,1]))
mylabel <- paste(mylabel,')')
a<-table.element(a,hyperlink('winsorized_mean.htm', mylabel, 'click to view the definition of the Winsorized Mean'),header=TRUE)
a<-table.element(a,win[j,1])
a<-table.element(a,win[j,2])
a<-table.element(a,win[j,1]/win[j,2])
a<-table.row.end(a)
}
for (j in 1:length(tri[,1])) {
a<-table.row.start(a)
mylabel <- paste('Trimmed Mean (',j)
mylabel <- paste(mylabel,'/')
mylabel <- paste(mylabel,length(tri[,1]))
mylabel <- paste(mylabel,')')
a<-table.element(a,hyperlink('arithmetic_mean.htm', mylabel, 'click to view the definition of the Trimmed Mean'),header=TRUE)
a<-table.element(a,tri[j,1])
a<-table.element(a,tri[j,2])
a<-table.element(a,tri[j,1]/tri[j,2])
a<-table.row.end(a)
}
a<-table.row.start(a)
a<-table.element(a,hyperlink('median_1.htm', 'Median', 'click to view the definition of the Median'),header=TRUE)
a<-table.element(a,median(x))
a<-table.element(a,'')
a<-table.row.end(a)
a<-table.row.start(a)
a<-table.element(a,hyperlink('midrange.htm', 'Midrange', 'click to view the definition of the Midrange'),header=TRUE)
a<-table.element(a,midr)
a<-table.element(a,'')
a<-table.row.end(a)
a<-table.row.start(a)
mymid <- hyperlink('midmean.htm', 'Midmean', 'click to view the definition of the Midmean')
mylabel <- paste(mymid,hyperlink('method_1.htm','Weighted Average at Xnp',''),sep=' - ')
a<-table.element(a,mylabel,header=TRUE)
a<-table.element(a,midm[1])
a<-table.element(a,'')
a<-table.row.end(a)
a<-table.row.start(a)
mymid <- hyperlink('midmean.htm', 'Midmean', 'click to view the definition of the Midmean')
mylabel <- paste(mymid,hyperlink('method_2.htm','Weighted Average at X(n+1)p',''),sep=' - ')
a<-table.element(a,mylabel,header=TRUE)
a<-table.element(a,midm[2])
a<-table.element(a,'')
a<-table.row.end(a)
a<-table.row.start(a)
mymid <- hyperlink('midmean.htm', 'Midmean', 'click to view the definition of the Midmean')
mylabel <- paste(mymid,hyperlink('method_3.htm','Empirical Distribution Function',''),sep=' - ')
a<-table.element(a,mylabel,header=TRUE)
a<-table.element(a,midm[3])
a<-table.element(a,'')
a<-table.row.end(a)
a<-table.row.start(a)
mymid <- hyperlink('midmean.htm', 'Midmean', 'click to view the definition of the Midmean')
mylabel <- paste(mymid,hyperlink('method_4.htm','Empirical Distribution Function - Averaging',''),sep=' - ')
a<-table.element(a,mylabel,header=TRUE)
a<-table.element(a,midm[4])
a<-table.element(a,'')
a<-table.row.end(a)
a<-table.row.start(a)
mymid <- hyperlink('midmean.htm', 'Midmean', 'click to view the definition of the Midmean')
mylabel <- paste(mymid,hyperlink('method_5.htm','Empirical Distribution Function - Interpolation',''),sep=' - ')
a<-table.element(a,mylabel,header=TRUE)
a<-table.element(a,midm[5])
a<-table.element(a,'')
a<-table.row.end(a)
a<-table.row.start(a)
mymid <- hyperlink('midmean.htm', 'Midmean', 'click to view the definition of the Midmean')
mylabel <- paste(mymid,hyperlink('method_6.htm','Closest Observation',''),sep=' - ')
a<-table.element(a,mylabel,header=TRUE)
a<-table.element(a,midm[6])
a<-table.element(a,'')
a<-table.row.end(a)
a<-table.row.start(a)
mymid <- hyperlink('midmean.htm', 'Midmean', 'click to view the definition of the Midmean')
mylabel <- paste(mymid,hyperlink('method_7.htm','True Basic - Statistics Graphics Toolkit',''),sep=' - ')
a<-table.element(a,mylabel,header=TRUE)
a<-table.element(a,midm[7])
a<-table.element(a,'')
a<-table.row.end(a)
a<-table.row.start(a)
mymid <- hyperlink('midmean.htm', 'Midmean', 'click to view the definition of the Midmean')
mylabel <- paste(mymid,hyperlink('method_8.htm','MS Excel (old versions)',''),sep=' - ')
a<-table.element(a,mylabel,header=TRUE)
a<-table.element(a,midm[8])
a<-table.element(a,'')
a<-table.row.end(a)
a<-table.row.start(a)
a<-table.element(a,'Number of observations',header=TRUE)
a<-table.element(a,length(x))
a<-table.element(a,'')
a<-table.row.end(a)
a<-table.end(a)
table.save(a,file='mytable.tab')