Free Statistics

of Irreproducible Research!

Author's title

Author*Unverified author*
R Software Modulerwasp_centraltendency.wasp
Title produced by softwareCentral Tendency
Date of computationSun, 12 Oct 2014 17:19:47 +0100
Cite this page as followsStatistical Computations at FreeStatistics.org, Office for Research Development and Education, URL https://freestatistics.org/blog/index.php?v=date/2014/Oct/12/t1413130892fqgshvh5ccz4eu7.htm/, Retrieved Wed, 15 May 2024 07:56:13 +0000
Statistical Computations at FreeStatistics.org, Office for Research Development and Education, URL https://freestatistics.org/blog/index.php?pk=240612, Retrieved Wed, 15 May 2024 07:56:13 +0000
QR Codes:

Original text written by user:
IsPrivate?No (this computation is public)
User-defined keywords
Estimated Impact75
Family? (F = Feedback message, R = changed R code, M = changed R Module, P = changed Parameters, D = changed Data)
-       [Central Tendency] [] [2014-10-12 16:19:47] [7a6c09eb8232161d54860d64a56e9131] [Current]
Feedback Forum

Post a new message
Dataseries X:
324
336
327
302
299
311
315
264
278
278
287
279
324
354
354
360
363
385
412
370
389
395
417
404
456
478
468
437
432
441
449
386
396
394
403
373
409
430
415
392
401
400
447
392
427
444
448
427
480
490
482
490
485
498
544
483
508
529
547
543
608
638
661
650
654
678
725
644
670
662
641
642


Summary of computational transaction
Raw Inputview raw input (R code)
Raw Outputview raw output of R engine
Computing time1 seconds
R Server'George Udny Yule' @ yule.wessa.net

\begin{tabular}{lllllllll}
\hline
Summary of computational transaction \tabularnewline
Raw Input & view raw input (R code)  \tabularnewline
Raw Output & view raw output of R engine  \tabularnewline
Computing time & 1 seconds \tabularnewline
R Server & 'George Udny Yule' @ yule.wessa.net \tabularnewline
\hline
\end{tabular}
%Source: https://freestatistics.org/blog/index.php?pk=240612&T=0

[TABLE]
[ROW][C]Summary of computational transaction[/C][/ROW]
[ROW][C]Raw Input[/C][C]view raw input (R code) [/C][/ROW]
[ROW][C]Raw Output[/C][C]view raw output of R engine [/C][/ROW]
[ROW][C]Computing time[/C][C]1 seconds[/C][/ROW]
[ROW][C]R Server[/C][C]'George Udny Yule' @ yule.wessa.net[/C][/ROW]
[/TABLE]
Source: https://freestatistics.org/blog/index.php?pk=240612&T=0

Globally Unique Identifier (entire table): ba.freestatistics.org/blog/index.php?pk=240612&T=0

As an alternative you can also use a QR Code:  

The GUIDs for individual cells are displayed in the table below:

Summary of computational transaction
Raw Inputview raw input (R code)
Raw Outputview raw output of R engine
Computing time1 seconds
R Server'George Udny Yule' @ yule.wessa.net


Central Tendency - Ungrouped Data
MeasureValueS.E.Value/S.E.
Arithmetic Mean447.55555555555613.618285611932732.8643096722392
Geometric Mean433.582524534948
Harmonic Mean420.380450810409
Quadratic Mean462.031895243415
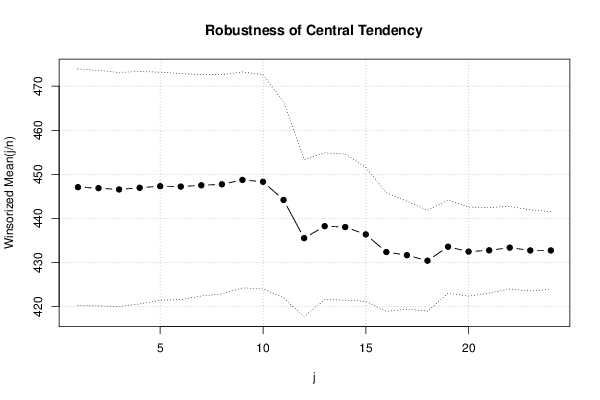
Winsorized Mean ( 1 / 24 )447.09722222222213.40962854095933.3415068774341
Winsorized Mean ( 2 / 24 )446.87513.356536991266233.4573999452262
Winsorized Mean ( 3 / 24 )446.58333333333313.271802713322233.6490334417837
Winsorized Mean ( 4 / 24 )446.97222222222213.181589158052933.9088266871947
Winsorized Mean ( 5 / 24 )447.31944444444412.932726293605934.5881784156838
Winsorized Mean ( 6 / 24 )447.23611111111112.817936209697834.8914289940638
Winsorized Mean ( 7 / 24 )447.52777777777812.551770293035735.6545544835288
Winsorized Mean ( 8 / 24 )447.7512.435368906610936.0061694480142
Winsorized Mean ( 9 / 24 )448.7512.242460392552836.655213544573
Winsorized Mean ( 10 / 24 )448.33333333333312.150577824574836.8981080411312
Winsorized Mean ( 11 / 24 )444.20833333333311.102258675229440.0106272360976
Winsorized Mean ( 12 / 24 )435.5416666666678.9032123385453948.9196090248282
Winsorized Mean ( 13 / 24 )438.258.3184785441518652.6839130105232
Winsorized Mean ( 14 / 24 )438.0555555555568.2837229598451252.8814830818227
Winsorized Mean ( 15 / 24 )436.3888888888897.5947215102525357.4594984555765
Winsorized Mean ( 16 / 24 )432.3888888888896.7271189759488564.2754930356946
Winsorized Mean ( 17 / 24 )431.6805555555566.1223450503741470.5090209721478
Winsorized Mean ( 18 / 24 )430.4305555555565.716531034570375.2957611797362
Winsorized Mean ( 19 / 24 )433.5972222222225.2867559640783182.0157437128489
Winsorized Mean ( 20 / 24 )432.4861111111115.0445198365823485.7338508166359
Winsorized Mean ( 21 / 24 )432.7777777777784.8467202591071889.2929145156605
Winsorized Mean ( 22 / 24 )433.3888888888894.6867673889912292.4707485818219
Winsorized Mean ( 23 / 24 )432.754.5938206947920694.202631916087
Winsorized Mean ( 24 / 24 )432.754.4145401914266798.0283293921367
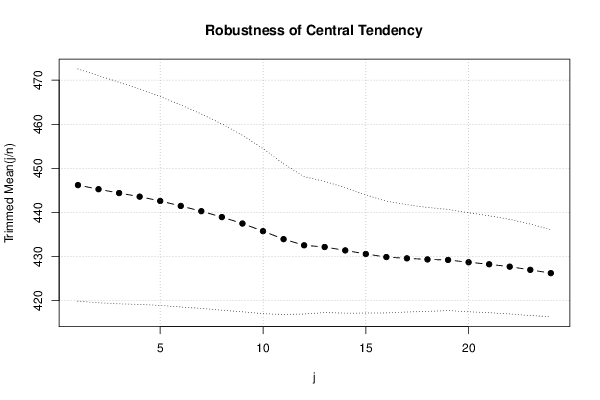
Trimmed Mean ( 1 / 24 )446.21428571428613.166129027319833.8910764726965
Trimmed Mean ( 2 / 24 )445.27941176470612.874637759903934.5857817570186
Trimmed Mean ( 3 / 24 )444.40909090909112.558988595135435.385738870822
Trimmed Mean ( 4 / 24 )443.5937512.218105522320736.3062627990582
Trimmed Mean ( 5 / 24 )442.61290322580611.83862394186837.387191737756
Trimmed Mean ( 6 / 24 )441.48333333333311.457030793968238.5338349239457
Trimmed Mean ( 7 / 24 )440.29310344827611.022388496482339.9453442952759
Trimmed Mean ( 8 / 24 )438.96428571428610.558186467581941.5757277125282
Trimmed Mean ( 9 / 24 )437.510.00764033772643.7165990419088
Trimmed Mean ( 10 / 24 )435.7692307692319.3569090057691546.5719214005982
Trimmed Mean ( 11 / 24 )433.968.5388409097273150.8218860835831
Trimmed Mean ( 12 / 24 )432.56257.7873389154930155.5468953764696
Trimmed Mean ( 13 / 24 )432.1739130434787.4335253337019458.1384866052852
Trimmed Mean ( 14 / 24 )431.4090909090917.1135696624340860.6459360603877
Trimmed Mean ( 15 / 24 )430.5952380952386.6985930815893964.2814443048793
Trimmed Mean ( 16 / 24 )429.96.3337516730931567.8744640125833
Trimmed Mean ( 17 / 24 )429.6052631578956.0816562412569570.6395176109303
Trimmed Mean ( 18 / 24 )429.3611111111115.8939237984982872.8480933568412
Trimmed Mean ( 19 / 24 )429.2352941176475.7360322208901474.8313952202724
Trimmed Mean ( 20 / 24 )428.718755.6134261530194976.3738113432542
Trimmed Mean ( 21 / 24 )428.2666666666675.4939744074096377.9520680127433
Trimmed Mean ( 22 / 24 )427.7142857142865.3592764710614579.8082144154756
Trimmed Mean ( 23 / 24 )4275.1854826939476782.3452753006737
Trimmed Mean ( 24 / 24 )426.254.9326074181946686.4147425209055
Median427
Midrange494.5
Midmean - Weighted Average at Xnp427.756756756757
Midmean - Weighted Average at X(n+1)p429.361111111111
Midmean - Empirical Distribution Function427.756756756757
Midmean - Empirical Distribution Function - Averaging429.361111111111
Midmean - Empirical Distribution Function - Interpolation429.361111111111
Midmean - Closest Observation427.756756756757
Midmean - True Basic - Statistics Graphics Toolkit429.361111111111
Midmean - MS Excel (old versions)429.605263157895
Number of observations72

\begin{tabular}{lllllllll}
\hline
Central Tendency - Ungrouped Data \tabularnewline
Measure & Value & S.E. & Value/S.E. \tabularnewline
Arithmetic Mean & 447.555555555556 & 13.6182856119327 & 32.8643096722392 \tabularnewline
Geometric Mean & 433.582524534948 &  &  \tabularnewline
Harmonic Mean & 420.380450810409 &  &  \tabularnewline
Quadratic Mean & 462.031895243415 &  &  \tabularnewline
Winsorized Mean ( 1 / 24 ) & 447.097222222222 & 13.409628540959 & 33.3415068774341 \tabularnewline
Winsorized Mean ( 2 / 24 ) & 446.875 & 13.3565369912662 & 33.4573999452262 \tabularnewline
Winsorized Mean ( 3 / 24 ) & 446.583333333333 & 13.2718027133222 & 33.6490334417837 \tabularnewline
Winsorized Mean ( 4 / 24 ) & 446.972222222222 & 13.1815891580529 & 33.9088266871947 \tabularnewline
Winsorized Mean ( 5 / 24 ) & 447.319444444444 & 12.9327262936059 & 34.5881784156838 \tabularnewline
Winsorized Mean ( 6 / 24 ) & 447.236111111111 & 12.8179362096978 & 34.8914289940638 \tabularnewline
Winsorized Mean ( 7 / 24 ) & 447.527777777778 & 12.5517702930357 & 35.6545544835288 \tabularnewline
Winsorized Mean ( 8 / 24 ) & 447.75 & 12.4353689066109 & 36.0061694480142 \tabularnewline
Winsorized Mean ( 9 / 24 ) & 448.75 & 12.2424603925528 & 36.655213544573 \tabularnewline
Winsorized Mean ( 10 / 24 ) & 448.333333333333 & 12.1505778245748 & 36.8981080411312 \tabularnewline
Winsorized Mean ( 11 / 24 ) & 444.208333333333 & 11.1022586752294 & 40.0106272360976 \tabularnewline
Winsorized Mean ( 12 / 24 ) & 435.541666666667 & 8.90321233854539 & 48.9196090248282 \tabularnewline
Winsorized Mean ( 13 / 24 ) & 438.25 & 8.31847854415186 & 52.6839130105232 \tabularnewline
Winsorized Mean ( 14 / 24 ) & 438.055555555556 & 8.28372295984512 & 52.8814830818227 \tabularnewline
Winsorized Mean ( 15 / 24 ) & 436.388888888889 & 7.59472151025253 & 57.4594984555765 \tabularnewline
Winsorized Mean ( 16 / 24 ) & 432.388888888889 & 6.72711897594885 & 64.2754930356946 \tabularnewline
Winsorized Mean ( 17 / 24 ) & 431.680555555556 & 6.12234505037414 & 70.5090209721478 \tabularnewline
Winsorized Mean ( 18 / 24 ) & 430.430555555556 & 5.7165310345703 & 75.2957611797362 \tabularnewline
Winsorized Mean ( 19 / 24 ) & 433.597222222222 & 5.28675596407831 & 82.0157437128489 \tabularnewline
Winsorized Mean ( 20 / 24 ) & 432.486111111111 & 5.04451983658234 & 85.7338508166359 \tabularnewline
Winsorized Mean ( 21 / 24 ) & 432.777777777778 & 4.84672025910718 & 89.2929145156605 \tabularnewline
Winsorized Mean ( 22 / 24 ) & 433.388888888889 & 4.68676738899122 & 92.4707485818219 \tabularnewline
Winsorized Mean ( 23 / 24 ) & 432.75 & 4.59382069479206 & 94.202631916087 \tabularnewline
Winsorized Mean ( 24 / 24 ) & 432.75 & 4.41454019142667 & 98.0283293921367 \tabularnewline
Trimmed Mean ( 1 / 24 ) & 446.214285714286 & 13.1661290273198 & 33.8910764726965 \tabularnewline
Trimmed Mean ( 2 / 24 ) & 445.279411764706 & 12.8746377599039 & 34.5857817570186 \tabularnewline
Trimmed Mean ( 3 / 24 ) & 444.409090909091 & 12.5589885951354 & 35.385738870822 \tabularnewline
Trimmed Mean ( 4 / 24 ) & 443.59375 & 12.2181055223207 & 36.3062627990582 \tabularnewline
Trimmed Mean ( 5 / 24 ) & 442.612903225806 & 11.838623941868 & 37.387191737756 \tabularnewline
Trimmed Mean ( 6 / 24 ) & 441.483333333333 & 11.4570307939682 & 38.5338349239457 \tabularnewline
Trimmed Mean ( 7 / 24 ) & 440.293103448276 & 11.0223884964823 & 39.9453442952759 \tabularnewline
Trimmed Mean ( 8 / 24 ) & 438.964285714286 & 10.5581864675819 & 41.5757277125282 \tabularnewline
Trimmed Mean ( 9 / 24 ) & 437.5 & 10.007640337726 & 43.7165990419088 \tabularnewline
Trimmed Mean ( 10 / 24 ) & 435.769230769231 & 9.35690900576915 & 46.5719214005982 \tabularnewline
Trimmed Mean ( 11 / 24 ) & 433.96 & 8.53884090972731 & 50.8218860835831 \tabularnewline
Trimmed Mean ( 12 / 24 ) & 432.5625 & 7.78733891549301 & 55.5468953764696 \tabularnewline
Trimmed Mean ( 13 / 24 ) & 432.173913043478 & 7.43352533370194 & 58.1384866052852 \tabularnewline
Trimmed Mean ( 14 / 24 ) & 431.409090909091 & 7.11356966243408 & 60.6459360603877 \tabularnewline
Trimmed Mean ( 15 / 24 ) & 430.595238095238 & 6.69859308158939 & 64.2814443048793 \tabularnewline
Trimmed Mean ( 16 / 24 ) & 429.9 & 6.33375167309315 & 67.8744640125833 \tabularnewline
Trimmed Mean ( 17 / 24 ) & 429.605263157895 & 6.08165624125695 & 70.6395176109303 \tabularnewline
Trimmed Mean ( 18 / 24 ) & 429.361111111111 & 5.89392379849828 & 72.8480933568412 \tabularnewline
Trimmed Mean ( 19 / 24 ) & 429.235294117647 & 5.73603222089014 & 74.8313952202724 \tabularnewline
Trimmed Mean ( 20 / 24 ) & 428.71875 & 5.61342615301949 & 76.3738113432542 \tabularnewline
Trimmed Mean ( 21 / 24 ) & 428.266666666667 & 5.49397440740963 & 77.9520680127433 \tabularnewline
Trimmed Mean ( 22 / 24 ) & 427.714285714286 & 5.35927647106145 & 79.8082144154756 \tabularnewline
Trimmed Mean ( 23 / 24 ) & 427 & 5.18548269394767 & 82.3452753006737 \tabularnewline
Trimmed Mean ( 24 / 24 ) & 426.25 & 4.93260741819466 & 86.4147425209055 \tabularnewline
Median & 427 &  &  \tabularnewline
Midrange & 494.5 &  &  \tabularnewline
Midmean - Weighted Average at Xnp & 427.756756756757 &  &  \tabularnewline
Midmean - Weighted Average at X(n+1)p & 429.361111111111 &  &  \tabularnewline
Midmean - Empirical Distribution Function & 427.756756756757 &  &  \tabularnewline
Midmean - Empirical Distribution Function - Averaging & 429.361111111111 &  &  \tabularnewline
Midmean - Empirical Distribution Function - Interpolation & 429.361111111111 &  &  \tabularnewline
Midmean - Closest Observation & 427.756756756757 &  &  \tabularnewline
Midmean - True Basic - Statistics Graphics Toolkit & 429.361111111111 &  &  \tabularnewline
Midmean - MS Excel (old versions) & 429.605263157895 &  &  \tabularnewline
Number of observations & 72 &  &  \tabularnewline
\hline
\end{tabular}
%Source: https://freestatistics.org/blog/index.php?pk=240612&T=1

[TABLE]
[ROW][C]Central Tendency - Ungrouped Data[/C][/ROW]
[ROW][C]Measure[/C][C]Value[/C][C]S.E.[/C][C]Value/S.E.[/C][/ROW]
[ROW][C]Arithmetic Mean[/C][C]447.555555555556[/C][C]13.6182856119327[/C][C]32.8643096722392[/C][/ROW]
[ROW][C]Geometric Mean[/C][C]433.582524534948[/C][C][/C][C][/C][/ROW]
[ROW][C]Harmonic Mean[/C][C]420.380450810409[/C][C][/C][C][/C][/ROW]
[ROW][C]Quadratic Mean[/C][C]462.031895243415[/C][C][/C][C][/C][/ROW]
[ROW][C]Winsorized Mean ( 1 / 24 )[/C][C]447.097222222222[/C][C]13.409628540959[/C][C]33.3415068774341[/C][/ROW]
[ROW][C]Winsorized Mean ( 2 / 24 )[/C][C]446.875[/C][C]13.3565369912662[/C][C]33.4573999452262[/C][/ROW]
[ROW][C]Winsorized Mean ( 3 / 24 )[/C][C]446.583333333333[/C][C]13.2718027133222[/C][C]33.6490334417837[/C][/ROW]
[ROW][C]Winsorized Mean ( 4 / 24 )[/C][C]446.972222222222[/C][C]13.1815891580529[/C][C]33.9088266871947[/C][/ROW]
[ROW][C]Winsorized Mean ( 5 / 24 )[/C][C]447.319444444444[/C][C]12.9327262936059[/C][C]34.5881784156838[/C][/ROW]
[ROW][C]Winsorized Mean ( 6 / 24 )[/C][C]447.236111111111[/C][C]12.8179362096978[/C][C]34.8914289940638[/C][/ROW]
[ROW][C]Winsorized Mean ( 7 / 24 )[/C][C]447.527777777778[/C][C]12.5517702930357[/C][C]35.6545544835288[/C][/ROW]
[ROW][C]Winsorized Mean ( 8 / 24 )[/C][C]447.75[/C][C]12.4353689066109[/C][C]36.0061694480142[/C][/ROW]
[ROW][C]Winsorized Mean ( 9 / 24 )[/C][C]448.75[/C][C]12.2424603925528[/C][C]36.655213544573[/C][/ROW]
[ROW][C]Winsorized Mean ( 10 / 24 )[/C][C]448.333333333333[/C][C]12.1505778245748[/C][C]36.8981080411312[/C][/ROW]
[ROW][C]Winsorized Mean ( 11 / 24 )[/C][C]444.208333333333[/C][C]11.1022586752294[/C][C]40.0106272360976[/C][/ROW]
[ROW][C]Winsorized Mean ( 12 / 24 )[/C][C]435.541666666667[/C][C]8.90321233854539[/C][C]48.9196090248282[/C][/ROW]
[ROW][C]Winsorized Mean ( 13 / 24 )[/C][C]438.25[/C][C]8.31847854415186[/C][C]52.6839130105232[/C][/ROW]
[ROW][C]Winsorized Mean ( 14 / 24 )[/C][C]438.055555555556[/C][C]8.28372295984512[/C][C]52.8814830818227[/C][/ROW]
[ROW][C]Winsorized Mean ( 15 / 24 )[/C][C]436.388888888889[/C][C]7.59472151025253[/C][C]57.4594984555765[/C][/ROW]
[ROW][C]Winsorized Mean ( 16 / 24 )[/C][C]432.388888888889[/C][C]6.72711897594885[/C][C]64.2754930356946[/C][/ROW]
[ROW][C]Winsorized Mean ( 17 / 24 )[/C][C]431.680555555556[/C][C]6.12234505037414[/C][C]70.5090209721478[/C][/ROW]
[ROW][C]Winsorized Mean ( 18 / 24 )[/C][C]430.430555555556[/C][C]5.7165310345703[/C][C]75.2957611797362[/C][/ROW]
[ROW][C]Winsorized Mean ( 19 / 24 )[/C][C]433.597222222222[/C][C]5.28675596407831[/C][C]82.0157437128489[/C][/ROW]
[ROW][C]Winsorized Mean ( 20 / 24 )[/C][C]432.486111111111[/C][C]5.04451983658234[/C][C]85.7338508166359[/C][/ROW]
[ROW][C]Winsorized Mean ( 21 / 24 )[/C][C]432.777777777778[/C][C]4.84672025910718[/C][C]89.2929145156605[/C][/ROW]
[ROW][C]Winsorized Mean ( 22 / 24 )[/C][C]433.388888888889[/C][C]4.68676738899122[/C][C]92.4707485818219[/C][/ROW]
[ROW][C]Winsorized Mean ( 23 / 24 )[/C][C]432.75[/C][C]4.59382069479206[/C][C]94.202631916087[/C][/ROW]
[ROW][C]Winsorized Mean ( 24 / 24 )[/C][C]432.75[/C][C]4.41454019142667[/C][C]98.0283293921367[/C][/ROW]
[ROW][C]Trimmed Mean ( 1 / 24 )[/C][C]446.214285714286[/C][C]13.1661290273198[/C][C]33.8910764726965[/C][/ROW]
[ROW][C]Trimmed Mean ( 2 / 24 )[/C][C]445.279411764706[/C][C]12.8746377599039[/C][C]34.5857817570186[/C][/ROW]
[ROW][C]Trimmed Mean ( 3 / 24 )[/C][C]444.409090909091[/C][C]12.5589885951354[/C][C]35.385738870822[/C][/ROW]
[ROW][C]Trimmed Mean ( 4 / 24 )[/C][C]443.59375[/C][C]12.2181055223207[/C][C]36.3062627990582[/C][/ROW]
[ROW][C]Trimmed Mean ( 5 / 24 )[/C][C]442.612903225806[/C][C]11.838623941868[/C][C]37.387191737756[/C][/ROW]
[ROW][C]Trimmed Mean ( 6 / 24 )[/C][C]441.483333333333[/C][C]11.4570307939682[/C][C]38.5338349239457[/C][/ROW]
[ROW][C]Trimmed Mean ( 7 / 24 )[/C][C]440.293103448276[/C][C]11.0223884964823[/C][C]39.9453442952759[/C][/ROW]
[ROW][C]Trimmed Mean ( 8 / 24 )[/C][C]438.964285714286[/C][C]10.5581864675819[/C][C]41.5757277125282[/C][/ROW]
[ROW][C]Trimmed Mean ( 9 / 24 )[/C][C]437.5[/C][C]10.007640337726[/C][C]43.7165990419088[/C][/ROW]
[ROW][C]Trimmed Mean ( 10 / 24 )[/C][C]435.769230769231[/C][C]9.35690900576915[/C][C]46.5719214005982[/C][/ROW]
[ROW][C]Trimmed Mean ( 11 / 24 )[/C][C]433.96[/C][C]8.53884090972731[/C][C]50.8218860835831[/C][/ROW]
[ROW][C]Trimmed Mean ( 12 / 24 )[/C][C]432.5625[/C][C]7.78733891549301[/C][C]55.5468953764696[/C][/ROW]
[ROW][C]Trimmed Mean ( 13 / 24 )[/C][C]432.173913043478[/C][C]7.43352533370194[/C][C]58.1384866052852[/C][/ROW]
[ROW][C]Trimmed Mean ( 14 / 24 )[/C][C]431.409090909091[/C][C]7.11356966243408[/C][C]60.6459360603877[/C][/ROW]
[ROW][C]Trimmed Mean ( 15 / 24 )[/C][C]430.595238095238[/C][C]6.69859308158939[/C][C]64.2814443048793[/C][/ROW]
[ROW][C]Trimmed Mean ( 16 / 24 )[/C][C]429.9[/C][C]6.33375167309315[/C][C]67.8744640125833[/C][/ROW]
[ROW][C]Trimmed Mean ( 17 / 24 )[/C][C]429.605263157895[/C][C]6.08165624125695[/C][C]70.6395176109303[/C][/ROW]
[ROW][C]Trimmed Mean ( 18 / 24 )[/C][C]429.361111111111[/C][C]5.89392379849828[/C][C]72.8480933568412[/C][/ROW]
[ROW][C]Trimmed Mean ( 19 / 24 )[/C][C]429.235294117647[/C][C]5.73603222089014[/C][C]74.8313952202724[/C][/ROW]
[ROW][C]Trimmed Mean ( 20 / 24 )[/C][C]428.71875[/C][C]5.61342615301949[/C][C]76.3738113432542[/C][/ROW]
[ROW][C]Trimmed Mean ( 21 / 24 )[/C][C]428.266666666667[/C][C]5.49397440740963[/C][C]77.9520680127433[/C][/ROW]
[ROW][C]Trimmed Mean ( 22 / 24 )[/C][C]427.714285714286[/C][C]5.35927647106145[/C][C]79.8082144154756[/C][/ROW]
[ROW][C]Trimmed Mean ( 23 / 24 )[/C][C]427[/C][C]5.18548269394767[/C][C]82.3452753006737[/C][/ROW]
[ROW][C]Trimmed Mean ( 24 / 24 )[/C][C]426.25[/C][C]4.93260741819466[/C][C]86.4147425209055[/C][/ROW]
[ROW][C]Median[/C][C]427[/C][C][/C][C][/C][/ROW]
[ROW][C]Midrange[/C][C]494.5[/C][C][/C][C][/C][/ROW]
[ROW][C]Midmean - Weighted Average at Xnp[/C][C]427.756756756757[/C][C][/C][C][/C][/ROW]
[ROW][C]Midmean - Weighted Average at X(n+1)p[/C][C]429.361111111111[/C][C][/C][C][/C][/ROW]
[ROW][C]Midmean - Empirical Distribution Function[/C][C]427.756756756757[/C][C][/C][C][/C][/ROW]
[ROW][C]Midmean - Empirical Distribution Function - Averaging[/C][C]429.361111111111[/C][C][/C][C][/C][/ROW]
[ROW][C]Midmean - Empirical Distribution Function - Interpolation[/C][C]429.361111111111[/C][C][/C][C][/C][/ROW]
[ROW][C]Midmean - Closest Observation[/C][C]427.756756756757[/C][C][/C][C][/C][/ROW]
[ROW][C]Midmean - True Basic - Statistics Graphics Toolkit[/C][C]429.361111111111[/C][C][/C][C][/C][/ROW]
[ROW][C]Midmean - MS Excel (old versions)[/C][C]429.605263157895[/C][C][/C][C][/C][/ROW]
[ROW][C]Number of observations[/C][C]72[/C][C][/C][C][/C][/ROW]
[/TABLE]
Source: https://freestatistics.org/blog/index.php?pk=240612&T=1

Globally Unique Identifier (entire table): ba.freestatistics.org/blog/index.php?pk=240612&T=1

As an alternative you can also use a QR Code:  

The GUIDs for individual cells are displayed in the table below:

Central Tendency - Ungrouped Data
MeasureValueS.E.Value/S.E.
Arithmetic Mean447.55555555555613.618285611932732.8643096722392
Geometric Mean433.582524534948
Harmonic Mean420.380450810409
Quadratic Mean462.031895243415
Winsorized Mean ( 1 / 24 )447.09722222222213.40962854095933.3415068774341
Winsorized Mean ( 2 / 24 )446.87513.356536991266233.4573999452262
Winsorized Mean ( 3 / 24 )446.58333333333313.271802713322233.6490334417837
Winsorized Mean ( 4 / 24 )446.97222222222213.181589158052933.9088266871947
Winsorized Mean ( 5 / 24 )447.31944444444412.932726293605934.5881784156838
Winsorized Mean ( 6 / 24 )447.23611111111112.817936209697834.8914289940638
Winsorized Mean ( 7 / 24 )447.52777777777812.551770293035735.6545544835288
Winsorized Mean ( 8 / 24 )447.7512.435368906610936.0061694480142
Winsorized Mean ( 9 / 24 )448.7512.242460392552836.655213544573
Winsorized Mean ( 10 / 24 )448.33333333333312.150577824574836.8981080411312
Winsorized Mean ( 11 / 24 )444.20833333333311.102258675229440.0106272360976
Winsorized Mean ( 12 / 24 )435.5416666666678.9032123385453948.9196090248282
Winsorized Mean ( 13 / 24 )438.258.3184785441518652.6839130105232
Winsorized Mean ( 14 / 24 )438.0555555555568.2837229598451252.8814830818227
Winsorized Mean ( 15 / 24 )436.3888888888897.5947215102525357.4594984555765
Winsorized Mean ( 16 / 24 )432.3888888888896.7271189759488564.2754930356946
Winsorized Mean ( 17 / 24 )431.6805555555566.1223450503741470.5090209721478
Winsorized Mean ( 18 / 24 )430.4305555555565.716531034570375.2957611797362
Winsorized Mean ( 19 / 24 )433.5972222222225.2867559640783182.0157437128489
Winsorized Mean ( 20 / 24 )432.4861111111115.0445198365823485.7338508166359
Winsorized Mean ( 21 / 24 )432.7777777777784.8467202591071889.2929145156605
Winsorized Mean ( 22 / 24 )433.3888888888894.6867673889912292.4707485818219
Winsorized Mean ( 23 / 24 )432.754.5938206947920694.202631916087
Winsorized Mean ( 24 / 24 )432.754.4145401914266798.0283293921367
Trimmed Mean ( 1 / 24 )446.21428571428613.166129027319833.8910764726965
Trimmed Mean ( 2 / 24 )445.27941176470612.874637759903934.5857817570186
Trimmed Mean ( 3 / 24 )444.40909090909112.558988595135435.385738870822
Trimmed Mean ( 4 / 24 )443.5937512.218105522320736.3062627990582
Trimmed Mean ( 5 / 24 )442.61290322580611.83862394186837.387191737756
Trimmed Mean ( 6 / 24 )441.48333333333311.457030793968238.5338349239457
Trimmed Mean ( 7 / 24 )440.29310344827611.022388496482339.9453442952759
Trimmed Mean ( 8 / 24 )438.96428571428610.558186467581941.5757277125282
Trimmed Mean ( 9 / 24 )437.510.00764033772643.7165990419088
Trimmed Mean ( 10 / 24 )435.7692307692319.3569090057691546.5719214005982
Trimmed Mean ( 11 / 24 )433.968.5388409097273150.8218860835831
Trimmed Mean ( 12 / 24 )432.56257.7873389154930155.5468953764696
Trimmed Mean ( 13 / 24 )432.1739130434787.4335253337019458.1384866052852
Trimmed Mean ( 14 / 24 )431.4090909090917.1135696624340860.6459360603877
Trimmed Mean ( 15 / 24 )430.5952380952386.6985930815893964.2814443048793
Trimmed Mean ( 16 / 24 )429.96.3337516730931567.8744640125833
Trimmed Mean ( 17 / 24 )429.6052631578956.0816562412569570.6395176109303
Trimmed Mean ( 18 / 24 )429.3611111111115.8939237984982872.8480933568412
Trimmed Mean ( 19 / 24 )429.2352941176475.7360322208901474.8313952202724
Trimmed Mean ( 20 / 24 )428.718755.6134261530194976.3738113432542
Trimmed Mean ( 21 / 24 )428.2666666666675.4939744074096377.9520680127433
Trimmed Mean ( 22 / 24 )427.7142857142865.3592764710614579.8082144154756
Trimmed Mean ( 23 / 24 )4275.1854826939476782.3452753006737
Trimmed Mean ( 24 / 24 )426.254.9326074181946686.4147425209055
Median427
Midrange494.5
Midmean - Weighted Average at Xnp427.756756756757
Midmean - Weighted Average at X(n+1)p429.361111111111
Midmean - Empirical Distribution Function427.756756756757
Midmean - Empirical Distribution Function - Averaging429.361111111111
Midmean - Empirical Distribution Function - Interpolation429.361111111111
Midmean - Closest Observation427.756756756757
Midmean - True Basic - Statistics Graphics Toolkit429.361111111111
Midmean - MS Excel (old versions)429.605263157895
Number of observations72


Parameters (Session):
Parameters (R input):
R code (references can be found in the software module):
geomean <- function(x) {
return(exp(mean(log(x))))
}
harmean <- function(x) {
return(1/mean(1/x))
}
quamean <- function(x) {
return(sqrt(mean(x*x)))
}
winmean <- function(x) {
x <-sort(x[!is.na(x)])
n<-length(x)
denom <- 3
nodenom <- n/denom
if (nodenom>40) denom <- n/40
sqrtn = sqrt(n)
roundnodenom = floor(nodenom)
win <- array(NA,dim=c(roundnodenom,2))
for (j in 1:roundnodenom) {
win[j,1] <- (j*x[j+1]+sum(x[(j+1):(n-j)])+j*x[n-j])/n
win[j,2] <- sd(c(rep(x[j+1],j),x[(j+1):(n-j)],rep(x[n-j],j)))/sqrtn
}
return(win)
}
trimean <- function(x) {
x <-sort(x[!is.na(x)])
n<-length(x)
denom <- 3
nodenom <- n/denom
if (nodenom>40) denom <- n/40
sqrtn = sqrt(n)
roundnodenom = floor(nodenom)
tri <- array(NA,dim=c(roundnodenom,2))
for (j in 1:roundnodenom) {
tri[j,1] <- mean(x,trim=j/n)
tri[j,2] <- sd(x[(j+1):(n-j)]) / sqrt(n-j*2)
}
return(tri)
}
midrange <- function(x) {
return((max(x)+min(x))/2)
}
q1 <- function(data,n,p,i,f) {
np <- n*p;
i <<- floor(np)
f <<- np - i
qvalue <- (1-f)*data[i] + f*data[i+1]
}
q2 <- function(data,n,p,i,f) {
np <- (n+1)*p
i <<- floor(np)
f <<- np - i
qvalue <- (1-f)*data[i] + f*data[i+1]
}
q3 <- function(data,n,p,i,f) {
np <- n*p
i <<- floor(np)
f <<- np - i
if (f==0) {
qvalue <- data[i]
} else {
qvalue <- data[i+1]
}
}
q4 <- function(data,n,p,i,f) {
np <- n*p
i <<- floor(np)
f <<- np - i
if (f==0) {
qvalue <- (data[i]+data[i+1])/2
} else {
qvalue <- data[i+1]
}
}
q5 <- function(data,n,p,i,f) {
np <- (n-1)*p
i <<- floor(np)
f <<- np - i
if (f==0) {
qvalue <- data[i+1]
} else {
qvalue <- data[i+1] + f*(data[i+2]-data[i+1])
}
}
q6 <- function(data,n,p,i,f) {
np <- n*p+0.5
i <<- floor(np)
f <<- np - i
qvalue <- data[i]
}
q7 <- function(data,n,p,i,f) {
np <- (n+1)*p
i <<- floor(np)
f <<- np - i
if (f==0) {
qvalue <- data[i]
} else {
qvalue <- f*data[i] + (1-f)*data[i+1]
}
}
q8 <- function(data,n,p,i,f) {
np <- (n+1)*p
i <<- floor(np)
f <<- np - i
if (f==0) {
qvalue <- data[i]
} else {
if (f == 0.5) {
qvalue <- (data[i]+data[i+1])/2
} else {
if (f < 0.5) {
qvalue <- data[i]
} else {
qvalue <- data[i+1]
}
}
}
}
midmean <- function(x,def) {
x <-sort(x[!is.na(x)])
n<-length(x)
if (def==1) {
qvalue1 <- q1(x,n,0.25,i,f)
qvalue3 <- q1(x,n,0.75,i,f)
}
if (def==2) {
qvalue1 <- q2(x,n,0.25,i,f)
qvalue3 <- q2(x,n,0.75,i,f)
}
if (def==3) {
qvalue1 <- q3(x,n,0.25,i,f)
qvalue3 <- q3(x,n,0.75,i,f)
}
if (def==4) {
qvalue1 <- q4(x,n,0.25,i,f)
qvalue3 <- q4(x,n,0.75,i,f)
}
if (def==5) {
qvalue1 <- q5(x,n,0.25,i,f)
qvalue3 <- q5(x,n,0.75,i,f)
}
if (def==6) {
qvalue1 <- q6(x,n,0.25,i,f)
qvalue3 <- q6(x,n,0.75,i,f)
}
if (def==7) {
qvalue1 <- q7(x,n,0.25,i,f)
qvalue3 <- q7(x,n,0.75,i,f)
}
if (def==8) {
qvalue1 <- q8(x,n,0.25,i,f)
qvalue3 <- q8(x,n,0.75,i,f)
}
midm <- 0
myn <- 0
roundno4 <- round(n/4)
round3no4 <- round(3*n/4)
for (i in 1:n) {
if ((x[i]>=qvalue1) & (x[i]<=qvalue3)){
midm = midm + x[i]
myn = myn + 1
}
}
midm = midm / myn
return(midm)
}
(arm <- mean(x))
sqrtn <- sqrt(length(x))
(armse <- sd(x) / sqrtn)
(armose <- arm / armse)
(geo <- geomean(x))
(har <- harmean(x))
(qua <- quamean(x))
(win <- winmean(x))
(tri <- trimean(x))
(midr <- midrange(x))
midm <- array(NA,dim=8)
for (j in 1:8) midm[j] <- midmean(x,j)
midm
bitmap(file='test1.png')
lb <- win[,1] - 2*win[,2]
ub <- win[,1] + 2*win[,2]
if ((ylimmin == '') | (ylimmax == '')) plot(win[,1],type='b',main=main, xlab='j', pch=19, ylab='Winsorized Mean(j/n)', ylim=c(min(lb),max(ub))) else plot(win[,1],type='l',main=main, xlab='j', pch=19, ylab='Winsorized Mean(j/n)', ylim=c(ylimmin,ylimmax))
lines(ub,lty=3)
lines(lb,lty=3)
grid()
dev.off()
bitmap(file='test2.png')
lb <- tri[,1] - 2*tri[,2]
ub <- tri[,1] + 2*tri[,2]
if ((ylimmin == '') | (ylimmax == '')) plot(tri[,1],type='b',main=main, xlab='j', pch=19, ylab='Trimmed Mean(j/n)', ylim=c(min(lb),max(ub))) else plot(tri[,1],type='l',main=main, xlab='j', pch=19, ylab='Trimmed Mean(j/n)', ylim=c(ylimmin,ylimmax))
lines(ub,lty=3)
lines(lb,lty=3)
grid()
dev.off()
load(file='createtable')
a<-table.start()
a<-table.row.start(a)
a<-table.element(a,'Central Tendency - Ungrouped Data',4,TRUE)
a<-table.row.end(a)
a<-table.row.start(a)
a<-table.element(a,'Measure',header=TRUE)
a<-table.element(a,'Value',header=TRUE)
a<-table.element(a,'S.E.',header=TRUE)
a<-table.element(a,'Value/S.E.',header=TRUE)
a<-table.row.end(a)
a<-table.row.start(a)
a<-table.element(a,hyperlink('arithmetic_mean.htm', 'Arithmetic Mean', 'click to view the definition of the Arithmetic Mean'),header=TRUE)
a<-table.element(a,arm)
a<-table.element(a,hyperlink('arithmetic_mean_standard_error.htm', armse, 'click to view the definition of the Standard Error of the Arithmetic Mean'))
a<-table.element(a,armose)
a<-table.row.end(a)
a<-table.row.start(a)
a<-table.element(a,hyperlink('geometric_mean.htm', 'Geometric Mean', 'click to view the definition of the Geometric Mean'),header=TRUE)
a<-table.element(a,geo)
a<-table.element(a,'')
a<-table.row.end(a)
a<-table.row.start(a)
a<-table.element(a,hyperlink('harmonic_mean.htm', 'Harmonic Mean', 'click to view the definition of the Harmonic Mean'),header=TRUE)
a<-table.element(a,har)
a<-table.element(a,'')
a<-table.row.end(a)
a<-table.row.start(a)
a<-table.element(a,hyperlink('quadratic_mean.htm', 'Quadratic Mean', 'click to view the definition of the Quadratic Mean'),header=TRUE)
a<-table.element(a,qua)
a<-table.element(a,'')
a<-table.row.end(a)
for (j in 1:length(win[,1])) {
a<-table.row.start(a)
mylabel <- paste('Winsorized Mean (',j)
mylabel <- paste(mylabel,'/')
mylabel <- paste(mylabel,length(win[,1]))
mylabel <- paste(mylabel,')')
a<-table.element(a,hyperlink('winsorized_mean.htm', mylabel, 'click to view the definition of the Winsorized Mean'),header=TRUE)
a<-table.element(a,win[j,1])
a<-table.element(a,win[j,2])
a<-table.element(a,win[j,1]/win[j,2])
a<-table.row.end(a)
}
for (j in 1:length(tri[,1])) {
a<-table.row.start(a)
mylabel <- paste('Trimmed Mean (',j)
mylabel <- paste(mylabel,'/')
mylabel <- paste(mylabel,length(tri[,1]))
mylabel <- paste(mylabel,')')
a<-table.element(a,hyperlink('arithmetic_mean.htm', mylabel, 'click to view the definition of the Trimmed Mean'),header=TRUE)
a<-table.element(a,tri[j,1])
a<-table.element(a,tri[j,2])
a<-table.element(a,tri[j,1]/tri[j,2])
a<-table.row.end(a)
}
a<-table.row.start(a)
a<-table.element(a,hyperlink('median_1.htm', 'Median', 'click to view the definition of the Median'),header=TRUE)
a<-table.element(a,median(x))
a<-table.element(a,'')
a<-table.row.end(a)
a<-table.row.start(a)
a<-table.element(a,hyperlink('midrange.htm', 'Midrange', 'click to view the definition of the Midrange'),header=TRUE)
a<-table.element(a,midr)
a<-table.element(a,'')
a<-table.row.end(a)
a<-table.row.start(a)
mymid <- hyperlink('midmean.htm', 'Midmean', 'click to view the definition of the Midmean')
mylabel <- paste(mymid,hyperlink('method_1.htm','Weighted Average at Xnp',''),sep=' - ')
a<-table.element(a,mylabel,header=TRUE)
a<-table.element(a,midm[1])
a<-table.element(a,'')
a<-table.row.end(a)
a<-table.row.start(a)
mymid <- hyperlink('midmean.htm', 'Midmean', 'click to view the definition of the Midmean')
mylabel <- paste(mymid,hyperlink('method_2.htm','Weighted Average at X(n+1)p',''),sep=' - ')
a<-table.element(a,mylabel,header=TRUE)
a<-table.element(a,midm[2])
a<-table.element(a,'')
a<-table.row.end(a)
a<-table.row.start(a)
mymid <- hyperlink('midmean.htm', 'Midmean', 'click to view the definition of the Midmean')
mylabel <- paste(mymid,hyperlink('method_3.htm','Empirical Distribution Function',''),sep=' - ')
a<-table.element(a,mylabel,header=TRUE)
a<-table.element(a,midm[3])
a<-table.element(a,'')
a<-table.row.end(a)
a<-table.row.start(a)
mymid <- hyperlink('midmean.htm', 'Midmean', 'click to view the definition of the Midmean')
mylabel <- paste(mymid,hyperlink('method_4.htm','Empirical Distribution Function - Averaging',''),sep=' - ')
a<-table.element(a,mylabel,header=TRUE)
a<-table.element(a,midm[4])
a<-table.element(a,'')
a<-table.row.end(a)
a<-table.row.start(a)
mymid <- hyperlink('midmean.htm', 'Midmean', 'click to view the definition of the Midmean')
mylabel <- paste(mymid,hyperlink('method_5.htm','Empirical Distribution Function - Interpolation',''),sep=' - ')
a<-table.element(a,mylabel,header=TRUE)
a<-table.element(a,midm[5])
a<-table.element(a,'')
a<-table.row.end(a)
a<-table.row.start(a)
mymid <- hyperlink('midmean.htm', 'Midmean', 'click to view the definition of the Midmean')
mylabel <- paste(mymid,hyperlink('method_6.htm','Closest Observation',''),sep=' - ')
a<-table.element(a,mylabel,header=TRUE)
a<-table.element(a,midm[6])
a<-table.element(a,'')
a<-table.row.end(a)
a<-table.row.start(a)
mymid <- hyperlink('midmean.htm', 'Midmean', 'click to view the definition of the Midmean')
mylabel <- paste(mymid,hyperlink('method_7.htm','True Basic - Statistics Graphics Toolkit',''),sep=' - ')
a<-table.element(a,mylabel,header=TRUE)
a<-table.element(a,midm[7])
a<-table.element(a,'')
a<-table.row.end(a)
a<-table.row.start(a)
mymid <- hyperlink('midmean.htm', 'Midmean', 'click to view the definition of the Midmean')
mylabel <- paste(mymid,hyperlink('method_8.htm','MS Excel (old versions)',''),sep=' - ')
a<-table.element(a,mylabel,header=TRUE)
a<-table.element(a,midm[8])
a<-table.element(a,'')
a<-table.row.end(a)
a<-table.row.start(a)
a<-table.element(a,'Number of observations',header=TRUE)
a<-table.element(a,length(x))
a<-table.element(a,'')
a<-table.row.end(a)
a<-table.end(a)
table.save(a,file='mytable.tab')