Free Statistics

of Irreproducible Research!

Author's title

Author*Unverified author*
R Software Modulerwasp_centraltendency.wasp
Title produced by softwareCentral Tendency
Date of computationSun, 12 Oct 2014 12:20:18 +0100
Cite this page as followsStatistical Computations at FreeStatistics.org, Office for Research Development and Education, URL https://freestatistics.org/blog/index.php?v=date/2014/Oct/12/t1413113049ddub67u6gx2b2h0.htm/, Retrieved Wed, 15 May 2024 17:40:38 +0000
Statistical Computations at FreeStatistics.org, Office for Research Development and Education, URL https://freestatistics.org/blog/index.php?pk=240555, Retrieved Wed, 15 May 2024 17:40:38 +0000
QR Codes:

Original text written by user:
IsPrivate?No (this computation is public)
User-defined keywords
Estimated Impact108
Family? (F = Feedback message, R = changed R code, M = changed R Module, P = changed Parameters, D = changed Data)
-       [Central Tendency] [Invoergegevens EU] [2014-10-12 11:20:18] [c53767938e2c856c14b03e8e32322294] [Current]
Feedback Forum

Post a new message
Dataseries X:
13396
13637
15467
13722
14727
14961
14026
13895
14474
15759
15995
14119
15342
15796
15435
16195
15572
16223
15921
14143
16290
16579
14314
13318
11938
12574
13298
12124
11757
12803
12800
11293
12992
13426
13174
13648
12801
13183
15703
14859
14350
16444
14207
13329
14795
15248
16081
15670
14805
15779
17945
15280
16773
16362
15774
15505
16397
16060
16748
16137
15523
16267
18066
16105
16883
17034
16452
16234
16658
18133
17488
15853
17198
16719
17635
16726
17503
17074
17054
15451
16374
17242
16684
16489


Summary of computational transaction
Raw Inputview raw input (R code)
Raw Outputview raw output of R engine
Computing time2 seconds
R Server'George Udny Yule' @ yule.wessa.net

\begin{tabular}{lllllllll}
\hline
Summary of computational transaction \tabularnewline
Raw Input & view raw input (R code)  \tabularnewline
Raw Output & view raw output of R engine  \tabularnewline
Computing time & 2 seconds \tabularnewline
R Server & 'George Udny Yule' @ yule.wessa.net \tabularnewline
\hline
\end{tabular}
%Source: https://freestatistics.org/blog/index.php?pk=240555&T=0

[TABLE]
[ROW][C]Summary of computational transaction[/C][/ROW]
[ROW][C]Raw Input[/C][C]view raw input (R code) [/C][/ROW]
[ROW][C]Raw Output[/C][C]view raw output of R engine [/C][/ROW]
[ROW][C]Computing time[/C][C]2 seconds[/C][/ROW]
[ROW][C]R Server[/C][C]'George Udny Yule' @ yule.wessa.net[/C][/ROW]
[/TABLE]
Source: https://freestatistics.org/blog/index.php?pk=240555&T=0

Globally Unique Identifier (entire table): ba.freestatistics.org/blog/index.php?pk=240555&T=0

As an alternative you can also use a QR Code:  

The GUIDs for individual cells are displayed in the table below:

Summary of computational transaction
Raw Inputview raw input (R code)
Raw Outputview raw output of R engine
Computing time2 seconds
R Server'George Udny Yule' @ yule.wessa.net


Central Tendency - Ungrouped Data
MeasureValueS.E.Value/S.E.
Arithmetic Mean15288.25176.16069216769986.7858193100541
Geometric Mean15200.2004550434
Harmonic Mean15108.2992643026
Quadratic Mean15372.2572509081
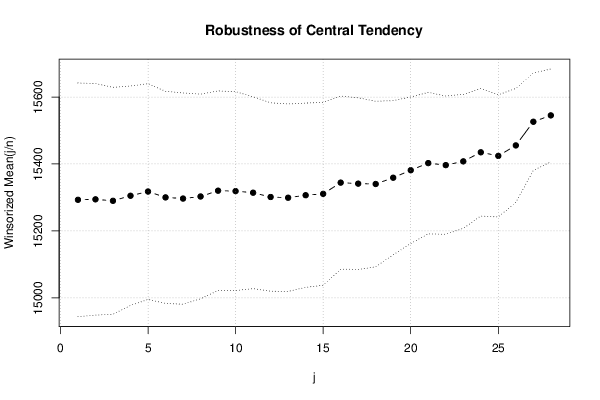
Winsorized Mean ( 1 / 28 )15292.9761904762174.57773575745787.5998083267785
Winsorized Mean ( 2 / 28 )15294.4047619048173.00654473362588.4036195593253
Winsorized Mean ( 3 / 28 )15289.9761904762169.537253640190.18652751645
Winsorized Mean ( 4 / 28 )15305.119047619163.94009128265593.3580000344816
Winsorized Mean ( 5 / 28 )15317.6785714286161.17895230015895.0352285632368
Winsorized Mean ( 6 / 28 )15300.1785714286158.44172528098696.5665991347586
Winsorized Mean ( 7 / 28 )15296.6785714286157.87329443944696.8921224184356
Winsorized Mean ( 8 / 28 )15302.869047619152.838142912003100.124672781648
Winsorized Mean ( 9 / 28 )15320.2261904762149.069986827674102.772036923747
Winsorized Mean ( 10 / 28 )15318.9166666667148.551840203559103.121689005503
Winsorized Mean ( 11 / 28 )15314.2023809524143.289710482529106.875799590785
Winsorized Mean ( 12 / 28 )15301.3452380952140.77861358138108.690836262924
Winsorized Mean ( 13 / 28 )15299.1785714286140.004966882545109.275970075144
Winsorized Mean ( 14 / 28 )15306.6785714286137.668305339678111.185203694209
Winsorized Mean ( 15 / 28 )15310.7857142857136.619928623681112.068465183138
Winsorized Mean ( 16 / 28 )15344.3095238095129.247498786949118.720359525897
Winsorized Mean ( 17 / 28 )15341.2738095238128.239227946803119.630116736884
Winsorized Mean ( 18 / 28 )15340.2023809524123.658485555362124.052969855308
Winsorized Mean ( 19 / 28 )15358.9761904762115.140402924416133.393455297865
Winsorized Mean ( 20 / 28 )15381.3571428571109.381269370825140.621490601934
Winsorized Mean ( 21 / 28 )15402.6071428571105.707812931772145.709259473551
Winsorized Mean ( 22 / 28 )15396.5833333333103.340121843621148.989405650519
Winsorized Mean ( 23 / 28 )15407.8095238095100.058823026553153.987515121187
Winsorized Mean ( 24 / 28 )15434.952380952495.2805666200286161.994758516768
Winsorized Mean ( 25 / 28 )15424.238095238191.280636003444168.976014744859
Winsorized Mean ( 26 / 28 )15455.585.0745336545238181.670111325708
Winsorized Mean ( 27 / 28 )15526.214285714372.7929578174348213.292806766475
Winsorized Mean ( 28 / 28 )15545.214285714369.3863646915901224.038459930996
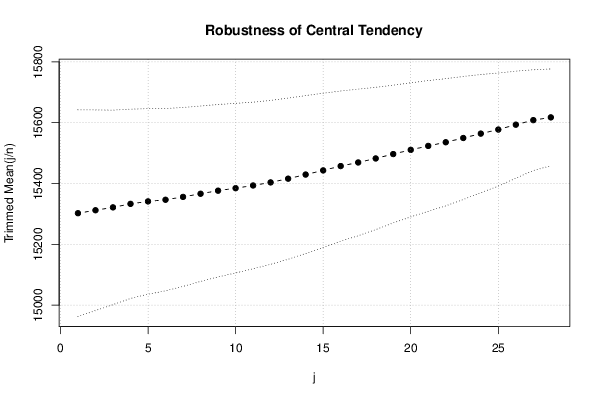
Trimmed Mean ( 1 / 28 )15302.2804878049170.14812194350189.9350537226978
Trimmed Mean ( 2 / 28 )15312.05165.00558669099892.7971610359745
Trimmed Mean ( 3 / 28 )15321.5512820513159.99811192633595.7608255346508
Trimmed Mean ( 4 / 28 )15333.1842105263155.68935975375998.4857554477551
Trimmed Mean ( 5 / 28 )15341.1486486486152.625677521466100.514860263215
Trimmed Mean ( 6 / 28 )15346.625149.836144773923102.42271664928
Trimmed Mean ( 7 / 28 )15355.9142857143147.224252186333104.302885276532
Trimmed Mean ( 8 / 28 )15366.3676470588144.22758589806106.542500530514
Trimmed Mean ( 9 / 28 )15376.4696969697141.760253009058108.468131021093
Trimmed Mean ( 10 / 28 )15384.671875139.569937265293110.229123666918
Trimmed Mean ( 11 / 28 )15393.5806451613136.98600782455112.373379512433
Trimmed Mean ( 12 / 28 )15403.6833333333134.829780721112114.245408180222
Trimmed Mean ( 13 / 28 )15416.0344827586132.590135228005116.268336677151
Trimmed Mean ( 14 / 28 )15429.5178571429129.909971301486118.770851094525
Trimmed Mean ( 15 / 28 )15443.1666666667126.989835867666121.609470247365
Trimmed Mean ( 16 / 28 )15457.4230769231123.496277586789125.165093061693
Trimmed Mean ( 17 / 28 )15469.3120.578612683737128.292237368613
Trimmed Mean ( 18 / 28 )15482.4791666667117.000344719681132.328491884027
Trimmed Mean ( 19 / 28 )15496.9130434783113.297815517556136.780333960428
Trimmed Mean ( 20 / 28 )15510.7727272727110.286297921044140.64097734405
Trimmed Mean ( 21 / 28 )15523.7142857143107.540961516295144.351641149889
Trimmed Mean ( 22 / 28 )15535.825104.663734367099148.435607557336
Trimmed Mean ( 23 / 28 )15549.8157894737101.201859147086153.651483485829
Trimmed Mean ( 24 / 28 )15564.222222222297.2237160882963160.086683048477
Trimmed Mean ( 25 / 28 )15577.529411764793.0018422688949167.496998250052
Trimmed Mean ( 26 / 28 )15593.62587.9987485019146177.202804192843
Trimmed Mean ( 27 / 28 )15608.582.8250996162201188.451327826031
Trimmed Mean ( 28 / 28 )15617.642857142979.6616889971431196.049607455636
Median15686.5
Midrange14713
Midmean - Weighted Average at Xnp15488.8837209302
Midmean - Weighted Average at X(n+1)p15523.7142857143
Midmean - Empirical Distribution Function15488.8837209302
Midmean - Empirical Distribution Function - Averaging15523.7142857143
Midmean - Empirical Distribution Function - Interpolation15523.7142857143
Midmean - Closest Observation15488.8837209302
Midmean - True Basic - Statistics Graphics Toolkit15523.7142857143
Midmean - MS Excel (old versions)15510.7727272727
Number of observations84

\begin{tabular}{lllllllll}
\hline
Central Tendency - Ungrouped Data \tabularnewline
Measure & Value & S.E. & Value/S.E. \tabularnewline
Arithmetic Mean & 15288.25 & 176.160692167699 & 86.7858193100541 \tabularnewline
Geometric Mean & 15200.2004550434 &  &  \tabularnewline
Harmonic Mean & 15108.2992643026 &  &  \tabularnewline
Quadratic Mean & 15372.2572509081 &  &  \tabularnewline
Winsorized Mean ( 1 / 28 ) & 15292.9761904762 & 174.577735757457 & 87.5998083267785 \tabularnewline
Winsorized Mean ( 2 / 28 ) & 15294.4047619048 & 173.006544733625 & 88.4036195593253 \tabularnewline
Winsorized Mean ( 3 / 28 ) & 15289.9761904762 & 169.5372536401 & 90.18652751645 \tabularnewline
Winsorized Mean ( 4 / 28 ) & 15305.119047619 & 163.940091282655 & 93.3580000344816 \tabularnewline
Winsorized Mean ( 5 / 28 ) & 15317.6785714286 & 161.178952300158 & 95.0352285632368 \tabularnewline
Winsorized Mean ( 6 / 28 ) & 15300.1785714286 & 158.441725280986 & 96.5665991347586 \tabularnewline
Winsorized Mean ( 7 / 28 ) & 15296.6785714286 & 157.873294439446 & 96.8921224184356 \tabularnewline
Winsorized Mean ( 8 / 28 ) & 15302.869047619 & 152.838142912003 & 100.124672781648 \tabularnewline
Winsorized Mean ( 9 / 28 ) & 15320.2261904762 & 149.069986827674 & 102.772036923747 \tabularnewline
Winsorized Mean ( 10 / 28 ) & 15318.9166666667 & 148.551840203559 & 103.121689005503 \tabularnewline
Winsorized Mean ( 11 / 28 ) & 15314.2023809524 & 143.289710482529 & 106.875799590785 \tabularnewline
Winsorized Mean ( 12 / 28 ) & 15301.3452380952 & 140.77861358138 & 108.690836262924 \tabularnewline
Winsorized Mean ( 13 / 28 ) & 15299.1785714286 & 140.004966882545 & 109.275970075144 \tabularnewline
Winsorized Mean ( 14 / 28 ) & 15306.6785714286 & 137.668305339678 & 111.185203694209 \tabularnewline
Winsorized Mean ( 15 / 28 ) & 15310.7857142857 & 136.619928623681 & 112.068465183138 \tabularnewline
Winsorized Mean ( 16 / 28 ) & 15344.3095238095 & 129.247498786949 & 118.720359525897 \tabularnewline
Winsorized Mean ( 17 / 28 ) & 15341.2738095238 & 128.239227946803 & 119.630116736884 \tabularnewline
Winsorized Mean ( 18 / 28 ) & 15340.2023809524 & 123.658485555362 & 124.052969855308 \tabularnewline
Winsorized Mean ( 19 / 28 ) & 15358.9761904762 & 115.140402924416 & 133.393455297865 \tabularnewline
Winsorized Mean ( 20 / 28 ) & 15381.3571428571 & 109.381269370825 & 140.621490601934 \tabularnewline
Winsorized Mean ( 21 / 28 ) & 15402.6071428571 & 105.707812931772 & 145.709259473551 \tabularnewline
Winsorized Mean ( 22 / 28 ) & 15396.5833333333 & 103.340121843621 & 148.989405650519 \tabularnewline
Winsorized Mean ( 23 / 28 ) & 15407.8095238095 & 100.058823026553 & 153.987515121187 \tabularnewline
Winsorized Mean ( 24 / 28 ) & 15434.9523809524 & 95.2805666200286 & 161.994758516768 \tabularnewline
Winsorized Mean ( 25 / 28 ) & 15424.2380952381 & 91.280636003444 & 168.976014744859 \tabularnewline
Winsorized Mean ( 26 / 28 ) & 15455.5 & 85.0745336545238 & 181.670111325708 \tabularnewline
Winsorized Mean ( 27 / 28 ) & 15526.2142857143 & 72.7929578174348 & 213.292806766475 \tabularnewline
Winsorized Mean ( 28 / 28 ) & 15545.2142857143 & 69.3863646915901 & 224.038459930996 \tabularnewline
Trimmed Mean ( 1 / 28 ) & 15302.2804878049 & 170.148121943501 & 89.9350537226978 \tabularnewline
Trimmed Mean ( 2 / 28 ) & 15312.05 & 165.005586690998 & 92.7971610359745 \tabularnewline
Trimmed Mean ( 3 / 28 ) & 15321.5512820513 & 159.998111926335 & 95.7608255346508 \tabularnewline
Trimmed Mean ( 4 / 28 ) & 15333.1842105263 & 155.689359753759 & 98.4857554477551 \tabularnewline
Trimmed Mean ( 5 / 28 ) & 15341.1486486486 & 152.625677521466 & 100.514860263215 \tabularnewline
Trimmed Mean ( 6 / 28 ) & 15346.625 & 149.836144773923 & 102.42271664928 \tabularnewline
Trimmed Mean ( 7 / 28 ) & 15355.9142857143 & 147.224252186333 & 104.302885276532 \tabularnewline
Trimmed Mean ( 8 / 28 ) & 15366.3676470588 & 144.22758589806 & 106.542500530514 \tabularnewline
Trimmed Mean ( 9 / 28 ) & 15376.4696969697 & 141.760253009058 & 108.468131021093 \tabularnewline
Trimmed Mean ( 10 / 28 ) & 15384.671875 & 139.569937265293 & 110.229123666918 \tabularnewline
Trimmed Mean ( 11 / 28 ) & 15393.5806451613 & 136.98600782455 & 112.373379512433 \tabularnewline
Trimmed Mean ( 12 / 28 ) & 15403.6833333333 & 134.829780721112 & 114.245408180222 \tabularnewline
Trimmed Mean ( 13 / 28 ) & 15416.0344827586 & 132.590135228005 & 116.268336677151 \tabularnewline
Trimmed Mean ( 14 / 28 ) & 15429.5178571429 & 129.909971301486 & 118.770851094525 \tabularnewline
Trimmed Mean ( 15 / 28 ) & 15443.1666666667 & 126.989835867666 & 121.609470247365 \tabularnewline
Trimmed Mean ( 16 / 28 ) & 15457.4230769231 & 123.496277586789 & 125.165093061693 \tabularnewline
Trimmed Mean ( 17 / 28 ) & 15469.3 & 120.578612683737 & 128.292237368613 \tabularnewline
Trimmed Mean ( 18 / 28 ) & 15482.4791666667 & 117.000344719681 & 132.328491884027 \tabularnewline
Trimmed Mean ( 19 / 28 ) & 15496.9130434783 & 113.297815517556 & 136.780333960428 \tabularnewline
Trimmed Mean ( 20 / 28 ) & 15510.7727272727 & 110.286297921044 & 140.64097734405 \tabularnewline
Trimmed Mean ( 21 / 28 ) & 15523.7142857143 & 107.540961516295 & 144.351641149889 \tabularnewline
Trimmed Mean ( 22 / 28 ) & 15535.825 & 104.663734367099 & 148.435607557336 \tabularnewline
Trimmed Mean ( 23 / 28 ) & 15549.8157894737 & 101.201859147086 & 153.651483485829 \tabularnewline
Trimmed Mean ( 24 / 28 ) & 15564.2222222222 & 97.2237160882963 & 160.086683048477 \tabularnewline
Trimmed Mean ( 25 / 28 ) & 15577.5294117647 & 93.0018422688949 & 167.496998250052 \tabularnewline
Trimmed Mean ( 26 / 28 ) & 15593.625 & 87.9987485019146 & 177.202804192843 \tabularnewline
Trimmed Mean ( 27 / 28 ) & 15608.5 & 82.8250996162201 & 188.451327826031 \tabularnewline
Trimmed Mean ( 28 / 28 ) & 15617.6428571429 & 79.6616889971431 & 196.049607455636 \tabularnewline
Median & 15686.5 &  &  \tabularnewline
Midrange & 14713 &  &  \tabularnewline
Midmean - Weighted Average at Xnp & 15488.8837209302 &  &  \tabularnewline
Midmean - Weighted Average at X(n+1)p & 15523.7142857143 &  &  \tabularnewline
Midmean - Empirical Distribution Function & 15488.8837209302 &  &  \tabularnewline
Midmean - Empirical Distribution Function - Averaging & 15523.7142857143 &  &  \tabularnewline
Midmean - Empirical Distribution Function - Interpolation & 15523.7142857143 &  &  \tabularnewline
Midmean - Closest Observation & 15488.8837209302 &  &  \tabularnewline
Midmean - True Basic - Statistics Graphics Toolkit & 15523.7142857143 &  &  \tabularnewline
Midmean - MS Excel (old versions) & 15510.7727272727 &  &  \tabularnewline
Number of observations & 84 &  &  \tabularnewline
\hline
\end{tabular}
%Source: https://freestatistics.org/blog/index.php?pk=240555&T=1

[TABLE]
[ROW][C]Central Tendency - Ungrouped Data[/C][/ROW]
[ROW][C]Measure[/C][C]Value[/C][C]S.E.[/C][C]Value/S.E.[/C][/ROW]
[ROW][C]Arithmetic Mean[/C][C]15288.25[/C][C]176.160692167699[/C][C]86.7858193100541[/C][/ROW]
[ROW][C]Geometric Mean[/C][C]15200.2004550434[/C][C][/C][C][/C][/ROW]
[ROW][C]Harmonic Mean[/C][C]15108.2992643026[/C][C][/C][C][/C][/ROW]
[ROW][C]Quadratic Mean[/C][C]15372.2572509081[/C][C][/C][C][/C][/ROW]
[ROW][C]Winsorized Mean ( 1 / 28 )[/C][C]15292.9761904762[/C][C]174.577735757457[/C][C]87.5998083267785[/C][/ROW]
[ROW][C]Winsorized Mean ( 2 / 28 )[/C][C]15294.4047619048[/C][C]173.006544733625[/C][C]88.4036195593253[/C][/ROW]
[ROW][C]Winsorized Mean ( 3 / 28 )[/C][C]15289.9761904762[/C][C]169.5372536401[/C][C]90.18652751645[/C][/ROW]
[ROW][C]Winsorized Mean ( 4 / 28 )[/C][C]15305.119047619[/C][C]163.940091282655[/C][C]93.3580000344816[/C][/ROW]
[ROW][C]Winsorized Mean ( 5 / 28 )[/C][C]15317.6785714286[/C][C]161.178952300158[/C][C]95.0352285632368[/C][/ROW]
[ROW][C]Winsorized Mean ( 6 / 28 )[/C][C]15300.1785714286[/C][C]158.441725280986[/C][C]96.5665991347586[/C][/ROW]
[ROW][C]Winsorized Mean ( 7 / 28 )[/C][C]15296.6785714286[/C][C]157.873294439446[/C][C]96.8921224184356[/C][/ROW]
[ROW][C]Winsorized Mean ( 8 / 28 )[/C][C]15302.869047619[/C][C]152.838142912003[/C][C]100.124672781648[/C][/ROW]
[ROW][C]Winsorized Mean ( 9 / 28 )[/C][C]15320.2261904762[/C][C]149.069986827674[/C][C]102.772036923747[/C][/ROW]
[ROW][C]Winsorized Mean ( 10 / 28 )[/C][C]15318.9166666667[/C][C]148.551840203559[/C][C]103.121689005503[/C][/ROW]
[ROW][C]Winsorized Mean ( 11 / 28 )[/C][C]15314.2023809524[/C][C]143.289710482529[/C][C]106.875799590785[/C][/ROW]
[ROW][C]Winsorized Mean ( 12 / 28 )[/C][C]15301.3452380952[/C][C]140.77861358138[/C][C]108.690836262924[/C][/ROW]
[ROW][C]Winsorized Mean ( 13 / 28 )[/C][C]15299.1785714286[/C][C]140.004966882545[/C][C]109.275970075144[/C][/ROW]
[ROW][C]Winsorized Mean ( 14 / 28 )[/C][C]15306.6785714286[/C][C]137.668305339678[/C][C]111.185203694209[/C][/ROW]
[ROW][C]Winsorized Mean ( 15 / 28 )[/C][C]15310.7857142857[/C][C]136.619928623681[/C][C]112.068465183138[/C][/ROW]
[ROW][C]Winsorized Mean ( 16 / 28 )[/C][C]15344.3095238095[/C][C]129.247498786949[/C][C]118.720359525897[/C][/ROW]
[ROW][C]Winsorized Mean ( 17 / 28 )[/C][C]15341.2738095238[/C][C]128.239227946803[/C][C]119.630116736884[/C][/ROW]
[ROW][C]Winsorized Mean ( 18 / 28 )[/C][C]15340.2023809524[/C][C]123.658485555362[/C][C]124.052969855308[/C][/ROW]
[ROW][C]Winsorized Mean ( 19 / 28 )[/C][C]15358.9761904762[/C][C]115.140402924416[/C][C]133.393455297865[/C][/ROW]
[ROW][C]Winsorized Mean ( 20 / 28 )[/C][C]15381.3571428571[/C][C]109.381269370825[/C][C]140.621490601934[/C][/ROW]
[ROW][C]Winsorized Mean ( 21 / 28 )[/C][C]15402.6071428571[/C][C]105.707812931772[/C][C]145.709259473551[/C][/ROW]
[ROW][C]Winsorized Mean ( 22 / 28 )[/C][C]15396.5833333333[/C][C]103.340121843621[/C][C]148.989405650519[/C][/ROW]
[ROW][C]Winsorized Mean ( 23 / 28 )[/C][C]15407.8095238095[/C][C]100.058823026553[/C][C]153.987515121187[/C][/ROW]
[ROW][C]Winsorized Mean ( 24 / 28 )[/C][C]15434.9523809524[/C][C]95.2805666200286[/C][C]161.994758516768[/C][/ROW]
[ROW][C]Winsorized Mean ( 25 / 28 )[/C][C]15424.2380952381[/C][C]91.280636003444[/C][C]168.976014744859[/C][/ROW]
[ROW][C]Winsorized Mean ( 26 / 28 )[/C][C]15455.5[/C][C]85.0745336545238[/C][C]181.670111325708[/C][/ROW]
[ROW][C]Winsorized Mean ( 27 / 28 )[/C][C]15526.2142857143[/C][C]72.7929578174348[/C][C]213.292806766475[/C][/ROW]
[ROW][C]Winsorized Mean ( 28 / 28 )[/C][C]15545.2142857143[/C][C]69.3863646915901[/C][C]224.038459930996[/C][/ROW]
[ROW][C]Trimmed Mean ( 1 / 28 )[/C][C]15302.2804878049[/C][C]170.148121943501[/C][C]89.9350537226978[/C][/ROW]
[ROW][C]Trimmed Mean ( 2 / 28 )[/C][C]15312.05[/C][C]165.005586690998[/C][C]92.7971610359745[/C][/ROW]
[ROW][C]Trimmed Mean ( 3 / 28 )[/C][C]15321.5512820513[/C][C]159.998111926335[/C][C]95.7608255346508[/C][/ROW]
[ROW][C]Trimmed Mean ( 4 / 28 )[/C][C]15333.1842105263[/C][C]155.689359753759[/C][C]98.4857554477551[/C][/ROW]
[ROW][C]Trimmed Mean ( 5 / 28 )[/C][C]15341.1486486486[/C][C]152.625677521466[/C][C]100.514860263215[/C][/ROW]
[ROW][C]Trimmed Mean ( 6 / 28 )[/C][C]15346.625[/C][C]149.836144773923[/C][C]102.42271664928[/C][/ROW]
[ROW][C]Trimmed Mean ( 7 / 28 )[/C][C]15355.9142857143[/C][C]147.224252186333[/C][C]104.302885276532[/C][/ROW]
[ROW][C]Trimmed Mean ( 8 / 28 )[/C][C]15366.3676470588[/C][C]144.22758589806[/C][C]106.542500530514[/C][/ROW]
[ROW][C]Trimmed Mean ( 9 / 28 )[/C][C]15376.4696969697[/C][C]141.760253009058[/C][C]108.468131021093[/C][/ROW]
[ROW][C]Trimmed Mean ( 10 / 28 )[/C][C]15384.671875[/C][C]139.569937265293[/C][C]110.229123666918[/C][/ROW]
[ROW][C]Trimmed Mean ( 11 / 28 )[/C][C]15393.5806451613[/C][C]136.98600782455[/C][C]112.373379512433[/C][/ROW]
[ROW][C]Trimmed Mean ( 12 / 28 )[/C][C]15403.6833333333[/C][C]134.829780721112[/C][C]114.245408180222[/C][/ROW]
[ROW][C]Trimmed Mean ( 13 / 28 )[/C][C]15416.0344827586[/C][C]132.590135228005[/C][C]116.268336677151[/C][/ROW]
[ROW][C]Trimmed Mean ( 14 / 28 )[/C][C]15429.5178571429[/C][C]129.909971301486[/C][C]118.770851094525[/C][/ROW]
[ROW][C]Trimmed Mean ( 15 / 28 )[/C][C]15443.1666666667[/C][C]126.989835867666[/C][C]121.609470247365[/C][/ROW]
[ROW][C]Trimmed Mean ( 16 / 28 )[/C][C]15457.4230769231[/C][C]123.496277586789[/C][C]125.165093061693[/C][/ROW]
[ROW][C]Trimmed Mean ( 17 / 28 )[/C][C]15469.3[/C][C]120.578612683737[/C][C]128.292237368613[/C][/ROW]
[ROW][C]Trimmed Mean ( 18 / 28 )[/C][C]15482.4791666667[/C][C]117.000344719681[/C][C]132.328491884027[/C][/ROW]
[ROW][C]Trimmed Mean ( 19 / 28 )[/C][C]15496.9130434783[/C][C]113.297815517556[/C][C]136.780333960428[/C][/ROW]
[ROW][C]Trimmed Mean ( 20 / 28 )[/C][C]15510.7727272727[/C][C]110.286297921044[/C][C]140.64097734405[/C][/ROW]
[ROW][C]Trimmed Mean ( 21 / 28 )[/C][C]15523.7142857143[/C][C]107.540961516295[/C][C]144.351641149889[/C][/ROW]
[ROW][C]Trimmed Mean ( 22 / 28 )[/C][C]15535.825[/C][C]104.663734367099[/C][C]148.435607557336[/C][/ROW]
[ROW][C]Trimmed Mean ( 23 / 28 )[/C][C]15549.8157894737[/C][C]101.201859147086[/C][C]153.651483485829[/C][/ROW]
[ROW][C]Trimmed Mean ( 24 / 28 )[/C][C]15564.2222222222[/C][C]97.2237160882963[/C][C]160.086683048477[/C][/ROW]
[ROW][C]Trimmed Mean ( 25 / 28 )[/C][C]15577.5294117647[/C][C]93.0018422688949[/C][C]167.496998250052[/C][/ROW]
[ROW][C]Trimmed Mean ( 26 / 28 )[/C][C]15593.625[/C][C]87.9987485019146[/C][C]177.202804192843[/C][/ROW]
[ROW][C]Trimmed Mean ( 27 / 28 )[/C][C]15608.5[/C][C]82.8250996162201[/C][C]188.451327826031[/C][/ROW]
[ROW][C]Trimmed Mean ( 28 / 28 )[/C][C]15617.6428571429[/C][C]79.6616889971431[/C][C]196.049607455636[/C][/ROW]
[ROW][C]Median[/C][C]15686.5[/C][C][/C][C][/C][/ROW]
[ROW][C]Midrange[/C][C]14713[/C][C][/C][C][/C][/ROW]
[ROW][C]Midmean - Weighted Average at Xnp[/C][C]15488.8837209302[/C][C][/C][C][/C][/ROW]
[ROW][C]Midmean - Weighted Average at X(n+1)p[/C][C]15523.7142857143[/C][C][/C][C][/C][/ROW]
[ROW][C]Midmean - Empirical Distribution Function[/C][C]15488.8837209302[/C][C][/C][C][/C][/ROW]
[ROW][C]Midmean - Empirical Distribution Function - Averaging[/C][C]15523.7142857143[/C][C][/C][C][/C][/ROW]
[ROW][C]Midmean - Empirical Distribution Function - Interpolation[/C][C]15523.7142857143[/C][C][/C][C][/C][/ROW]
[ROW][C]Midmean - Closest Observation[/C][C]15488.8837209302[/C][C][/C][C][/C][/ROW]
[ROW][C]Midmean - True Basic - Statistics Graphics Toolkit[/C][C]15523.7142857143[/C][C][/C][C][/C][/ROW]
[ROW][C]Midmean - MS Excel (old versions)[/C][C]15510.7727272727[/C][C][/C][C][/C][/ROW]
[ROW][C]Number of observations[/C][C]84[/C][C][/C][C][/C][/ROW]
[/TABLE]
Source: https://freestatistics.org/blog/index.php?pk=240555&T=1

Globally Unique Identifier (entire table): ba.freestatistics.org/blog/index.php?pk=240555&T=1

As an alternative you can also use a QR Code:  

The GUIDs for individual cells are displayed in the table below:

Central Tendency - Ungrouped Data
MeasureValueS.E.Value/S.E.
Arithmetic Mean15288.25176.16069216769986.7858193100541
Geometric Mean15200.2004550434
Harmonic Mean15108.2992643026
Quadratic Mean15372.2572509081
Winsorized Mean ( 1 / 28 )15292.9761904762174.57773575745787.5998083267785
Winsorized Mean ( 2 / 28 )15294.4047619048173.00654473362588.4036195593253
Winsorized Mean ( 3 / 28 )15289.9761904762169.537253640190.18652751645
Winsorized Mean ( 4 / 28 )15305.119047619163.94009128265593.3580000344816
Winsorized Mean ( 5 / 28 )15317.6785714286161.17895230015895.0352285632368
Winsorized Mean ( 6 / 28 )15300.1785714286158.44172528098696.5665991347586
Winsorized Mean ( 7 / 28 )15296.6785714286157.87329443944696.8921224184356
Winsorized Mean ( 8 / 28 )15302.869047619152.838142912003100.124672781648
Winsorized Mean ( 9 / 28 )15320.2261904762149.069986827674102.772036923747
Winsorized Mean ( 10 / 28 )15318.9166666667148.551840203559103.121689005503
Winsorized Mean ( 11 / 28 )15314.2023809524143.289710482529106.875799590785
Winsorized Mean ( 12 / 28 )15301.3452380952140.77861358138108.690836262924
Winsorized Mean ( 13 / 28 )15299.1785714286140.004966882545109.275970075144
Winsorized Mean ( 14 / 28 )15306.6785714286137.668305339678111.185203694209
Winsorized Mean ( 15 / 28 )15310.7857142857136.619928623681112.068465183138
Winsorized Mean ( 16 / 28 )15344.3095238095129.247498786949118.720359525897
Winsorized Mean ( 17 / 28 )15341.2738095238128.239227946803119.630116736884
Winsorized Mean ( 18 / 28 )15340.2023809524123.658485555362124.052969855308
Winsorized Mean ( 19 / 28 )15358.9761904762115.140402924416133.393455297865
Winsorized Mean ( 20 / 28 )15381.3571428571109.381269370825140.621490601934
Winsorized Mean ( 21 / 28 )15402.6071428571105.707812931772145.709259473551
Winsorized Mean ( 22 / 28 )15396.5833333333103.340121843621148.989405650519
Winsorized Mean ( 23 / 28 )15407.8095238095100.058823026553153.987515121187
Winsorized Mean ( 24 / 28 )15434.952380952495.2805666200286161.994758516768
Winsorized Mean ( 25 / 28 )15424.238095238191.280636003444168.976014744859
Winsorized Mean ( 26 / 28 )15455.585.0745336545238181.670111325708
Winsorized Mean ( 27 / 28 )15526.214285714372.7929578174348213.292806766475
Winsorized Mean ( 28 / 28 )15545.214285714369.3863646915901224.038459930996
Trimmed Mean ( 1 / 28 )15302.2804878049170.14812194350189.9350537226978
Trimmed Mean ( 2 / 28 )15312.05165.00558669099892.7971610359745
Trimmed Mean ( 3 / 28 )15321.5512820513159.99811192633595.7608255346508
Trimmed Mean ( 4 / 28 )15333.1842105263155.68935975375998.4857554477551
Trimmed Mean ( 5 / 28 )15341.1486486486152.625677521466100.514860263215
Trimmed Mean ( 6 / 28 )15346.625149.836144773923102.42271664928
Trimmed Mean ( 7 / 28 )15355.9142857143147.224252186333104.302885276532
Trimmed Mean ( 8 / 28 )15366.3676470588144.22758589806106.542500530514
Trimmed Mean ( 9 / 28 )15376.4696969697141.760253009058108.468131021093
Trimmed Mean ( 10 / 28 )15384.671875139.569937265293110.229123666918
Trimmed Mean ( 11 / 28 )15393.5806451613136.98600782455112.373379512433
Trimmed Mean ( 12 / 28 )15403.6833333333134.829780721112114.245408180222
Trimmed Mean ( 13 / 28 )15416.0344827586132.590135228005116.268336677151
Trimmed Mean ( 14 / 28 )15429.5178571429129.909971301486118.770851094525
Trimmed Mean ( 15 / 28 )15443.1666666667126.989835867666121.609470247365
Trimmed Mean ( 16 / 28 )15457.4230769231123.496277586789125.165093061693
Trimmed Mean ( 17 / 28 )15469.3120.578612683737128.292237368613
Trimmed Mean ( 18 / 28 )15482.4791666667117.000344719681132.328491884027
Trimmed Mean ( 19 / 28 )15496.9130434783113.297815517556136.780333960428
Trimmed Mean ( 20 / 28 )15510.7727272727110.286297921044140.64097734405
Trimmed Mean ( 21 / 28 )15523.7142857143107.540961516295144.351641149889
Trimmed Mean ( 22 / 28 )15535.825104.663734367099148.435607557336
Trimmed Mean ( 23 / 28 )15549.8157894737101.201859147086153.651483485829
Trimmed Mean ( 24 / 28 )15564.222222222297.2237160882963160.086683048477
Trimmed Mean ( 25 / 28 )15577.529411764793.0018422688949167.496998250052
Trimmed Mean ( 26 / 28 )15593.62587.9987485019146177.202804192843
Trimmed Mean ( 27 / 28 )15608.582.8250996162201188.451327826031
Trimmed Mean ( 28 / 28 )15617.642857142979.6616889971431196.049607455636
Median15686.5
Midrange14713
Midmean - Weighted Average at Xnp15488.8837209302
Midmean - Weighted Average at X(n+1)p15523.7142857143
Midmean - Empirical Distribution Function15488.8837209302
Midmean - Empirical Distribution Function - Averaging15523.7142857143
Midmean - Empirical Distribution Function - Interpolation15523.7142857143
Midmean - Closest Observation15488.8837209302
Midmean - True Basic - Statistics Graphics Toolkit15523.7142857143
Midmean - MS Excel (old versions)15510.7727272727
Number of observations84


Parameters (Session):
Parameters (R input):
R code (references can be found in the software module):
geomean <- function(x) {
return(exp(mean(log(x))))
}
harmean <- function(x) {
return(1/mean(1/x))
}
quamean <- function(x) {
return(sqrt(mean(x*x)))
}
winmean <- function(x) {
x <-sort(x[!is.na(x)])
n<-length(x)
denom <- 3
nodenom <- n/denom
if (nodenom>40) denom <- n/40
sqrtn = sqrt(n)
roundnodenom = floor(nodenom)
win <- array(NA,dim=c(roundnodenom,2))
for (j in 1:roundnodenom) {
win[j,1] <- (j*x[j+1]+sum(x[(j+1):(n-j)])+j*x[n-j])/n
win[j,2] <- sd(c(rep(x[j+1],j),x[(j+1):(n-j)],rep(x[n-j],j)))/sqrtn
}
return(win)
}
trimean <- function(x) {
x <-sort(x[!is.na(x)])
n<-length(x)
denom <- 3
nodenom <- n/denom
if (nodenom>40) denom <- n/40
sqrtn = sqrt(n)
roundnodenom = floor(nodenom)
tri <- array(NA,dim=c(roundnodenom,2))
for (j in 1:roundnodenom) {
tri[j,1] <- mean(x,trim=j/n)
tri[j,2] <- sd(x[(j+1):(n-j)]) / sqrt(n-j*2)
}
return(tri)
}
midrange <- function(x) {
return((max(x)+min(x))/2)
}
q1 <- function(data,n,p,i,f) {
np <- n*p;
i <<- floor(np)
f <<- np - i
qvalue <- (1-f)*data[i] + f*data[i+1]
}
q2 <- function(data,n,p,i,f) {
np <- (n+1)*p
i <<- floor(np)
f <<- np - i
qvalue <- (1-f)*data[i] + f*data[i+1]
}
q3 <- function(data,n,p,i,f) {
np <- n*p
i <<- floor(np)
f <<- np - i
if (f==0) {
qvalue <- data[i]
} else {
qvalue <- data[i+1]
}
}
q4 <- function(data,n,p,i,f) {
np <- n*p
i <<- floor(np)
f <<- np - i
if (f==0) {
qvalue <- (data[i]+data[i+1])/2
} else {
qvalue <- data[i+1]
}
}
q5 <- function(data,n,p,i,f) {
np <- (n-1)*p
i <<- floor(np)
f <<- np - i
if (f==0) {
qvalue <- data[i+1]
} else {
qvalue <- data[i+1] + f*(data[i+2]-data[i+1])
}
}
q6 <- function(data,n,p,i,f) {
np <- n*p+0.5
i <<- floor(np)
f <<- np - i
qvalue <- data[i]
}
q7 <- function(data,n,p,i,f) {
np <- (n+1)*p
i <<- floor(np)
f <<- np - i
if (f==0) {
qvalue <- data[i]
} else {
qvalue <- f*data[i] + (1-f)*data[i+1]
}
}
q8 <- function(data,n,p,i,f) {
np <- (n+1)*p
i <<- floor(np)
f <<- np - i
if (f==0) {
qvalue <- data[i]
} else {
if (f == 0.5) {
qvalue <- (data[i]+data[i+1])/2
} else {
if (f < 0.5) {
qvalue <- data[i]
} else {
qvalue <- data[i+1]
}
}
}
}
midmean <- function(x,def) {
x <-sort(x[!is.na(x)])
n<-length(x)
if (def==1) {
qvalue1 <- q1(x,n,0.25,i,f)
qvalue3 <- q1(x,n,0.75,i,f)
}
if (def==2) {
qvalue1 <- q2(x,n,0.25,i,f)
qvalue3 <- q2(x,n,0.75,i,f)
}
if (def==3) {
qvalue1 <- q3(x,n,0.25,i,f)
qvalue3 <- q3(x,n,0.75,i,f)
}
if (def==4) {
qvalue1 <- q4(x,n,0.25,i,f)
qvalue3 <- q4(x,n,0.75,i,f)
}
if (def==5) {
qvalue1 <- q5(x,n,0.25,i,f)
qvalue3 <- q5(x,n,0.75,i,f)
}
if (def==6) {
qvalue1 <- q6(x,n,0.25,i,f)
qvalue3 <- q6(x,n,0.75,i,f)
}
if (def==7) {
qvalue1 <- q7(x,n,0.25,i,f)
qvalue3 <- q7(x,n,0.75,i,f)
}
if (def==8) {
qvalue1 <- q8(x,n,0.25,i,f)
qvalue3 <- q8(x,n,0.75,i,f)
}
midm <- 0
myn <- 0
roundno4 <- round(n/4)
round3no4 <- round(3*n/4)
for (i in 1:n) {
if ((x[i]>=qvalue1) & (x[i]<=qvalue3)){
midm = midm + x[i]
myn = myn + 1
}
}
midm = midm / myn
return(midm)
}
(arm <- mean(x))
sqrtn <- sqrt(length(x))
(armse <- sd(x) / sqrtn)
(armose <- arm / armse)
(geo <- geomean(x))
(har <- harmean(x))
(qua <- quamean(x))
(win <- winmean(x))
(tri <- trimean(x))
(midr <- midrange(x))
midm <- array(NA,dim=8)
for (j in 1:8) midm[j] <- midmean(x,j)
midm
bitmap(file='test1.png')
lb <- win[,1] - 2*win[,2]
ub <- win[,1] + 2*win[,2]
if ((ylimmin == '') | (ylimmax == '')) plot(win[,1],type='b',main=main, xlab='j', pch=19, ylab='Winsorized Mean(j/n)', ylim=c(min(lb),max(ub))) else plot(win[,1],type='l',main=main, xlab='j', pch=19, ylab='Winsorized Mean(j/n)', ylim=c(ylimmin,ylimmax))
lines(ub,lty=3)
lines(lb,lty=3)
grid()
dev.off()
bitmap(file='test2.png')
lb <- tri[,1] - 2*tri[,2]
ub <- tri[,1] + 2*tri[,2]
if ((ylimmin == '') | (ylimmax == '')) plot(tri[,1],type='b',main=main, xlab='j', pch=19, ylab='Trimmed Mean(j/n)', ylim=c(min(lb),max(ub))) else plot(tri[,1],type='l',main=main, xlab='j', pch=19, ylab='Trimmed Mean(j/n)', ylim=c(ylimmin,ylimmax))
lines(ub,lty=3)
lines(lb,lty=3)
grid()
dev.off()
load(file='createtable')
a<-table.start()
a<-table.row.start(a)
a<-table.element(a,'Central Tendency - Ungrouped Data',4,TRUE)
a<-table.row.end(a)
a<-table.row.start(a)
a<-table.element(a,'Measure',header=TRUE)
a<-table.element(a,'Value',header=TRUE)
a<-table.element(a,'S.E.',header=TRUE)
a<-table.element(a,'Value/S.E.',header=TRUE)
a<-table.row.end(a)
a<-table.row.start(a)
a<-table.element(a,hyperlink('arithmetic_mean.htm', 'Arithmetic Mean', 'click to view the definition of the Arithmetic Mean'),header=TRUE)
a<-table.element(a,arm)
a<-table.element(a,hyperlink('arithmetic_mean_standard_error.htm', armse, 'click to view the definition of the Standard Error of the Arithmetic Mean'))
a<-table.element(a,armose)
a<-table.row.end(a)
a<-table.row.start(a)
a<-table.element(a,hyperlink('geometric_mean.htm', 'Geometric Mean', 'click to view the definition of the Geometric Mean'),header=TRUE)
a<-table.element(a,geo)
a<-table.element(a,'')
a<-table.row.end(a)
a<-table.row.start(a)
a<-table.element(a,hyperlink('harmonic_mean.htm', 'Harmonic Mean', 'click to view the definition of the Harmonic Mean'),header=TRUE)
a<-table.element(a,har)
a<-table.element(a,'')
a<-table.row.end(a)
a<-table.row.start(a)
a<-table.element(a,hyperlink('quadratic_mean.htm', 'Quadratic Mean', 'click to view the definition of the Quadratic Mean'),header=TRUE)
a<-table.element(a,qua)
a<-table.element(a,'')
a<-table.row.end(a)
for (j in 1:length(win[,1])) {
a<-table.row.start(a)
mylabel <- paste('Winsorized Mean (',j)
mylabel <- paste(mylabel,'/')
mylabel <- paste(mylabel,length(win[,1]))
mylabel <- paste(mylabel,')')
a<-table.element(a,hyperlink('winsorized_mean.htm', mylabel, 'click to view the definition of the Winsorized Mean'),header=TRUE)
a<-table.element(a,win[j,1])
a<-table.element(a,win[j,2])
a<-table.element(a,win[j,1]/win[j,2])
a<-table.row.end(a)
}
for (j in 1:length(tri[,1])) {
a<-table.row.start(a)
mylabel <- paste('Trimmed Mean (',j)
mylabel <- paste(mylabel,'/')
mylabel <- paste(mylabel,length(tri[,1]))
mylabel <- paste(mylabel,')')
a<-table.element(a,hyperlink('arithmetic_mean.htm', mylabel, 'click to view the definition of the Trimmed Mean'),header=TRUE)
a<-table.element(a,tri[j,1])
a<-table.element(a,tri[j,2])
a<-table.element(a,tri[j,1]/tri[j,2])
a<-table.row.end(a)
}
a<-table.row.start(a)
a<-table.element(a,hyperlink('median_1.htm', 'Median', 'click to view the definition of the Median'),header=TRUE)
a<-table.element(a,median(x))
a<-table.element(a,'')
a<-table.row.end(a)
a<-table.row.start(a)
a<-table.element(a,hyperlink('midrange.htm', 'Midrange', 'click to view the definition of the Midrange'),header=TRUE)
a<-table.element(a,midr)
a<-table.element(a,'')
a<-table.row.end(a)
a<-table.row.start(a)
mymid <- hyperlink('midmean.htm', 'Midmean', 'click to view the definition of the Midmean')
mylabel <- paste(mymid,hyperlink('method_1.htm','Weighted Average at Xnp',''),sep=' - ')
a<-table.element(a,mylabel,header=TRUE)
a<-table.element(a,midm[1])
a<-table.element(a,'')
a<-table.row.end(a)
a<-table.row.start(a)
mymid <- hyperlink('midmean.htm', 'Midmean', 'click to view the definition of the Midmean')
mylabel <- paste(mymid,hyperlink('method_2.htm','Weighted Average at X(n+1)p',''),sep=' - ')
a<-table.element(a,mylabel,header=TRUE)
a<-table.element(a,midm[2])
a<-table.element(a,'')
a<-table.row.end(a)
a<-table.row.start(a)
mymid <- hyperlink('midmean.htm', 'Midmean', 'click to view the definition of the Midmean')
mylabel <- paste(mymid,hyperlink('method_3.htm','Empirical Distribution Function',''),sep=' - ')
a<-table.element(a,mylabel,header=TRUE)
a<-table.element(a,midm[3])
a<-table.element(a,'')
a<-table.row.end(a)
a<-table.row.start(a)
mymid <- hyperlink('midmean.htm', 'Midmean', 'click to view the definition of the Midmean')
mylabel <- paste(mymid,hyperlink('method_4.htm','Empirical Distribution Function - Averaging',''),sep=' - ')
a<-table.element(a,mylabel,header=TRUE)
a<-table.element(a,midm[4])
a<-table.element(a,'')
a<-table.row.end(a)
a<-table.row.start(a)
mymid <- hyperlink('midmean.htm', 'Midmean', 'click to view the definition of the Midmean')
mylabel <- paste(mymid,hyperlink('method_5.htm','Empirical Distribution Function - Interpolation',''),sep=' - ')
a<-table.element(a,mylabel,header=TRUE)
a<-table.element(a,midm[5])
a<-table.element(a,'')
a<-table.row.end(a)
a<-table.row.start(a)
mymid <- hyperlink('midmean.htm', 'Midmean', 'click to view the definition of the Midmean')
mylabel <- paste(mymid,hyperlink('method_6.htm','Closest Observation',''),sep=' - ')
a<-table.element(a,mylabel,header=TRUE)
a<-table.element(a,midm[6])
a<-table.element(a,'')
a<-table.row.end(a)
a<-table.row.start(a)
mymid <- hyperlink('midmean.htm', 'Midmean', 'click to view the definition of the Midmean')
mylabel <- paste(mymid,hyperlink('method_7.htm','True Basic - Statistics Graphics Toolkit',''),sep=' - ')
a<-table.element(a,mylabel,header=TRUE)
a<-table.element(a,midm[7])
a<-table.element(a,'')
a<-table.row.end(a)
a<-table.row.start(a)
mymid <- hyperlink('midmean.htm', 'Midmean', 'click to view the definition of the Midmean')
mylabel <- paste(mymid,hyperlink('method_8.htm','MS Excel (old versions)',''),sep=' - ')
a<-table.element(a,mylabel,header=TRUE)
a<-table.element(a,midm[8])
a<-table.element(a,'')
a<-table.row.end(a)
a<-table.row.start(a)
a<-table.element(a,'Number of observations',header=TRUE)
a<-table.element(a,length(x))
a<-table.element(a,'')
a<-table.row.end(a)
a<-table.end(a)
table.save(a,file='mytable.tab')