Free Statistics

of Irreproducible Research!

Author's title

Author*Unverified author*
R Software Modulerwasp_centraltendency.wasp
Title produced by softwareCentral Tendency
Date of computationSun, 12 Oct 2014 12:15:05 +0100
Cite this page as followsStatistical Computations at FreeStatistics.org, Office for Research Development and Education, URL https://freestatistics.org/blog/index.php?v=date/2014/Oct/12/t14131125368kcpmlq3oj8wlr2.htm/, Retrieved Thu, 16 May 2024 02:52:47 +0000
Statistical Computations at FreeStatistics.org, Office for Research Development and Education, URL https://freestatistics.org/blog/index.php?pk=240549, Retrieved Thu, 16 May 2024 02:52:47 +0000
QR Codes:

Original text written by user:
IsPrivate?No (this computation is public)
User-defined keywords
Estimated Impact126
Family? (F = Feedback message, R = changed R code, M = changed R Module, P = changed Parameters, D = changed Data)
-       [Central Tendency] [] [2014-10-12 11:15:05] [ce030e64aa9efcfbf032d2aff4cc4bf0] [Current]
Feedback Forum

Post a new message
Dataseries X:
1,5
1,439
1,49
1,502
1,531
1,611
1,644
1,559
1,553
1,494
1,298
1,215
1,179
1,267
1,282
1,304
1,32
1,413
1,38
1,426
1,394
1,354
1,415
1,406
1,44
1,449
1,489
1,53
1,548
1,518
1,507
1,499
1,487
1,487
1,491
1,56
1,587
1,584
1,647
1,666
1,699
1,671
1,622
1,669
1,663
1,624
1,621
1,607
1,671
1,699
1,751
1,821
1,77
1,734
1,703
1,752
1,823
1,827
1,773
1,75
1,733
1,765
1,791
1,773
1,712
1,735
1,729
1,769
1,776
1,709
1,678
1,691


Summary of computational transaction
Raw Inputview raw input (R code)
Raw Outputview raw output of R engine
Computing time1 seconds
R Server'Gertrude Mary Cox' @ cox.wessa.net

\begin{tabular}{lllllllll}
\hline
Summary of computational transaction \tabularnewline
Raw Input & view raw input (R code)  \tabularnewline
Raw Output & view raw output of R engine  \tabularnewline
Computing time & 1 seconds \tabularnewline
R Server & 'Gertrude Mary Cox' @ cox.wessa.net \tabularnewline
\hline
\end{tabular}
%Source: https://freestatistics.org/blog/index.php?pk=240549&T=0

[TABLE]
[ROW][C]Summary of computational transaction[/C][/ROW]
[ROW][C]Raw Input[/C][C]view raw input (R code) [/C][/ROW]
[ROW][C]Raw Output[/C][C]view raw output of R engine [/C][/ROW]
[ROW][C]Computing time[/C][C]1 seconds[/C][/ROW]
[ROW][C]R Server[/C][C]'Gertrude Mary Cox' @ cox.wessa.net[/C][/ROW]
[/TABLE]
Source: https://freestatistics.org/blog/index.php?pk=240549&T=0

Globally Unique Identifier (entire table): ba.freestatistics.org/blog/index.php?pk=240549&T=0

As an alternative you can also use a QR Code:  

The GUIDs for individual cells are displayed in the table below:

Summary of computational transaction
Raw Inputview raw input (R code)
Raw Outputview raw output of R engine
Computing time1 seconds
R Server'Gertrude Mary Cox' @ cox.wessa.net


Central Tendency - Ungrouped Data
MeasureValueS.E.Value/S.E.
Arithmetic Mean1.577444444444440.019056294669870982.7781303643713
Geometric Mean1.56892969817092
Harmonic Mean1.56006753668801
Quadratic Mean1.5855958133564
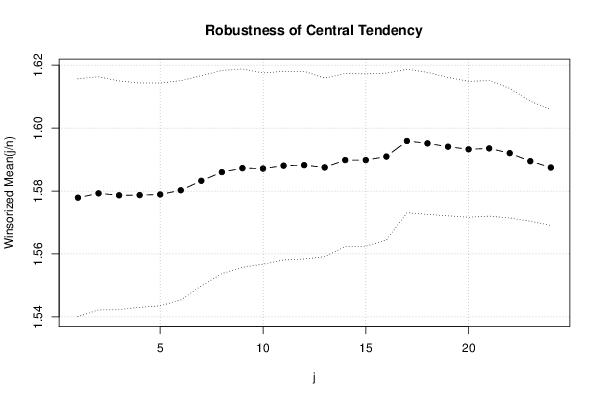
Winsorized Mean ( 1 / 24 )1.577888888888890.018904861837053383.4647141295816
Winsorized Mean ( 2 / 24 )1.579277777777780.018527738184855985.2385629600834
Winsorized Mean ( 3 / 24 )1.578652777777780.018163771571466186.9121686300945
Winsorized Mean ( 4 / 24 )1.578708333333330.017829366825566988.5453952896129
Winsorized Mean ( 5 / 24 )1.578916666666670.017705287641976789.1776907890093
Winsorized Mean ( 6 / 24 )1.580250.017419159917684790.719070693855
Winsorized Mean ( 7 / 24 )1.583263888888890.01670562340375694.7743074666053
Winsorized Mean ( 8 / 24 )1.586041666666670.016148911375539398.213534632993
Winsorized Mean ( 9 / 24 )1.587291666666670.0157608600497258100.710980343632
Winsorized Mean ( 10 / 24 )1.587152777777780.015195513243702104.448777235977
Winsorized Mean ( 11 / 24 )1.588069444444440.0149944215812382105.910683906041
Winsorized Mean ( 12 / 24 )1.588236111111110.0149142632293492106.49108753731
Winsorized Mean ( 13 / 24 )1.587513888888890.0141871295606407111.898173771044
Winsorized Mean ( 14 / 24 )1.589847222222220.0137606362293859115.535880443311
Winsorized Mean ( 15 / 24 )1.589847222222220.0136978011857675116.06587076721
Winsorized Mean ( 16 / 24 )1.590958333333330.0132623320457256119.960677190713
Winsorized Mean ( 17 / 24 )1.595916666666670.0113938550758656140.068190795856
Winsorized Mean ( 18 / 24 )1.595166666666670.0112867726258098141.330628298381
Winsorized Mean ( 19 / 24 )1.594111111111110.0109926806555604145.015684623274
Winsorized Mean ( 20 / 24 )1.593277777777780.0108011660788473147.509793493316
Winsorized Mean ( 21 / 24 )1.593569444444440.0107619502015029148.074411663966
Winsorized Mean ( 22 / 24 )1.592041666666670.0103049822624202154.492421832928
Winsorized Mean ( 23 / 24 )1.589486111111110.00953867412234769166.635959120061
Winsorized Mean ( 24 / 24 )1.587486111111110.00919223904328723172.698523573579
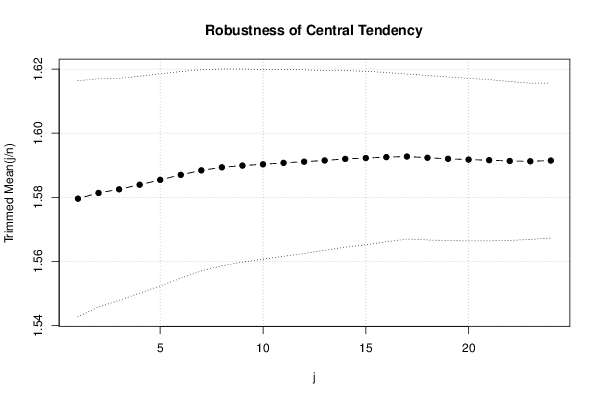
Trimmed Mean ( 1 / 24 )1.579571428571430.018398797910915285.8518820750969
Trimmed Mean ( 2 / 24 )1.581352941176470.017794588911107688.8670679090188
Trimmed Mean ( 3 / 24 )1.582484848484850.017315881151645891.3892186384313
Trimmed Mean ( 4 / 24 )1.5839218750.016906097224282693.6893863786008
Trimmed Mean ( 5 / 24 )1.585435483870970.016531808689769195.9021189769836
Trimmed Mean ( 6 / 24 )1.5870.016113036445773598.4916781725691
Trimmed Mean ( 7 / 24 )1.588396551724140.0156826116164183101.283930927756
Trimmed Mean ( 8 / 24 )1.589339285714290.0153436876649505103.582614585202
Trimmed Mean ( 9 / 24 )1.589888888888890.0150587404863788105.579141252019
Trimmed Mean ( 10 / 24 )1.590288461538460.0147880790658341107.538541987689
Trimmed Mean ( 11 / 24 )1.590740.014566324316094109.206685604441
Trimmed Mean ( 12 / 24 )1.591104166666670.0143189739092929111.118588297311
Trimmed Mean ( 13 / 24 )1.591478260869570.0140097874390505113.597602232959
Trimmed Mean ( 14 / 24 )1.591977272727270.0137613104984458115.685004920649
Trimmed Mean ( 15 / 24 )1.59223809523810.0135190238706637117.77759329897
Trimmed Mean ( 16 / 24 )1.5925250.0131978527536752120.665462005289
Trimmed Mean ( 17 / 24 )1.592710526315790.012859339024023123.856329111503
Trimmed Mean ( 18 / 24 )1.592333333333330.0128201849774932124.2051761444
Trimmed Mean ( 19 / 24 )1.5920.0127494713462105124.867922501993
Trimmed Mean ( 20 / 24 )1.591750.0126780862502091125.551283418169
Trimmed Mean ( 21 / 24 )1.591566666666670.0125758099607374126.557786069895
Trimmed Mean ( 22 / 24 )1.591321428571430.0123835371996537128.502979634601
Trimmed Mean ( 23 / 24 )1.591230769230770.0121861595758098130.576885960812
Trimmed Mean ( 24 / 24 )1.591458333333330.012075394068444131.793490490899
Median1.597
Midrange1.503
Midmean - Weighted Average at Xnp1.58948648648649
Midmean - Weighted Average at X(n+1)p1.58948648648649
Midmean - Empirical Distribution Function1.58948648648649
Midmean - Empirical Distribution Function - Averaging1.58948648648649
Midmean - Empirical Distribution Function - Interpolation1.58948648648649
Midmean - Closest Observation1.58948648648649
Midmean - True Basic - Statistics Graphics Toolkit1.58948648648649
Midmean - MS Excel (old versions)1.59271052631579
Number of observations72

\begin{tabular}{lllllllll}
\hline
Central Tendency - Ungrouped Data \tabularnewline
Measure & Value & S.E. & Value/S.E. \tabularnewline
Arithmetic Mean & 1.57744444444444 & 0.0190562946698709 & 82.7781303643713 \tabularnewline
Geometric Mean & 1.56892969817092 &  &  \tabularnewline
Harmonic Mean & 1.56006753668801 &  &  \tabularnewline
Quadratic Mean & 1.5855958133564 &  &  \tabularnewline
Winsorized Mean ( 1 / 24 ) & 1.57788888888889 & 0.0189048618370533 & 83.4647141295816 \tabularnewline
Winsorized Mean ( 2 / 24 ) & 1.57927777777778 & 0.0185277381848559 & 85.2385629600834 \tabularnewline
Winsorized Mean ( 3 / 24 ) & 1.57865277777778 & 0.0181637715714661 & 86.9121686300945 \tabularnewline
Winsorized Mean ( 4 / 24 ) & 1.57870833333333 & 0.0178293668255669 & 88.5453952896129 \tabularnewline
Winsorized Mean ( 5 / 24 ) & 1.57891666666667 & 0.0177052876419767 & 89.1776907890093 \tabularnewline
Winsorized Mean ( 6 / 24 ) & 1.58025 & 0.0174191599176847 & 90.719070693855 \tabularnewline
Winsorized Mean ( 7 / 24 ) & 1.58326388888889 & 0.016705623403756 & 94.7743074666053 \tabularnewline
Winsorized Mean ( 8 / 24 ) & 1.58604166666667 & 0.0161489113755393 & 98.213534632993 \tabularnewline
Winsorized Mean ( 9 / 24 ) & 1.58729166666667 & 0.0157608600497258 & 100.710980343632 \tabularnewline
Winsorized Mean ( 10 / 24 ) & 1.58715277777778 & 0.015195513243702 & 104.448777235977 \tabularnewline
Winsorized Mean ( 11 / 24 ) & 1.58806944444444 & 0.0149944215812382 & 105.910683906041 \tabularnewline
Winsorized Mean ( 12 / 24 ) & 1.58823611111111 & 0.0149142632293492 & 106.49108753731 \tabularnewline
Winsorized Mean ( 13 / 24 ) & 1.58751388888889 & 0.0141871295606407 & 111.898173771044 \tabularnewline
Winsorized Mean ( 14 / 24 ) & 1.58984722222222 & 0.0137606362293859 & 115.535880443311 \tabularnewline
Winsorized Mean ( 15 / 24 ) & 1.58984722222222 & 0.0136978011857675 & 116.06587076721 \tabularnewline
Winsorized Mean ( 16 / 24 ) & 1.59095833333333 & 0.0132623320457256 & 119.960677190713 \tabularnewline
Winsorized Mean ( 17 / 24 ) & 1.59591666666667 & 0.0113938550758656 & 140.068190795856 \tabularnewline
Winsorized Mean ( 18 / 24 ) & 1.59516666666667 & 0.0112867726258098 & 141.330628298381 \tabularnewline
Winsorized Mean ( 19 / 24 ) & 1.59411111111111 & 0.0109926806555604 & 145.015684623274 \tabularnewline
Winsorized Mean ( 20 / 24 ) & 1.59327777777778 & 0.0108011660788473 & 147.509793493316 \tabularnewline
Winsorized Mean ( 21 / 24 ) & 1.59356944444444 & 0.0107619502015029 & 148.074411663966 \tabularnewline
Winsorized Mean ( 22 / 24 ) & 1.59204166666667 & 0.0103049822624202 & 154.492421832928 \tabularnewline
Winsorized Mean ( 23 / 24 ) & 1.58948611111111 & 0.00953867412234769 & 166.635959120061 \tabularnewline
Winsorized Mean ( 24 / 24 ) & 1.58748611111111 & 0.00919223904328723 & 172.698523573579 \tabularnewline
Trimmed Mean ( 1 / 24 ) & 1.57957142857143 & 0.0183987979109152 & 85.8518820750969 \tabularnewline
Trimmed Mean ( 2 / 24 ) & 1.58135294117647 & 0.0177945889111076 & 88.8670679090188 \tabularnewline
Trimmed Mean ( 3 / 24 ) & 1.58248484848485 & 0.0173158811516458 & 91.3892186384313 \tabularnewline
Trimmed Mean ( 4 / 24 ) & 1.583921875 & 0.0169060972242826 & 93.6893863786008 \tabularnewline
Trimmed Mean ( 5 / 24 ) & 1.58543548387097 & 0.0165318086897691 & 95.9021189769836 \tabularnewline
Trimmed Mean ( 6 / 24 ) & 1.587 & 0.0161130364457735 & 98.4916781725691 \tabularnewline
Trimmed Mean ( 7 / 24 ) & 1.58839655172414 & 0.0156826116164183 & 101.283930927756 \tabularnewline
Trimmed Mean ( 8 / 24 ) & 1.58933928571429 & 0.0153436876649505 & 103.582614585202 \tabularnewline
Trimmed Mean ( 9 / 24 ) & 1.58988888888889 & 0.0150587404863788 & 105.579141252019 \tabularnewline
Trimmed Mean ( 10 / 24 ) & 1.59028846153846 & 0.0147880790658341 & 107.538541987689 \tabularnewline
Trimmed Mean ( 11 / 24 ) & 1.59074 & 0.014566324316094 & 109.206685604441 \tabularnewline
Trimmed Mean ( 12 / 24 ) & 1.59110416666667 & 0.0143189739092929 & 111.118588297311 \tabularnewline
Trimmed Mean ( 13 / 24 ) & 1.59147826086957 & 0.0140097874390505 & 113.597602232959 \tabularnewline
Trimmed Mean ( 14 / 24 ) & 1.59197727272727 & 0.0137613104984458 & 115.685004920649 \tabularnewline
Trimmed Mean ( 15 / 24 ) & 1.5922380952381 & 0.0135190238706637 & 117.77759329897 \tabularnewline
Trimmed Mean ( 16 / 24 ) & 1.592525 & 0.0131978527536752 & 120.665462005289 \tabularnewline
Trimmed Mean ( 17 / 24 ) & 1.59271052631579 & 0.012859339024023 & 123.856329111503 \tabularnewline
Trimmed Mean ( 18 / 24 ) & 1.59233333333333 & 0.0128201849774932 & 124.2051761444 \tabularnewline
Trimmed Mean ( 19 / 24 ) & 1.592 & 0.0127494713462105 & 124.867922501993 \tabularnewline
Trimmed Mean ( 20 / 24 ) & 1.59175 & 0.0126780862502091 & 125.551283418169 \tabularnewline
Trimmed Mean ( 21 / 24 ) & 1.59156666666667 & 0.0125758099607374 & 126.557786069895 \tabularnewline
Trimmed Mean ( 22 / 24 ) & 1.59132142857143 & 0.0123835371996537 & 128.502979634601 \tabularnewline
Trimmed Mean ( 23 / 24 ) & 1.59123076923077 & 0.0121861595758098 & 130.576885960812 \tabularnewline
Trimmed Mean ( 24 / 24 ) & 1.59145833333333 & 0.012075394068444 & 131.793490490899 \tabularnewline
Median & 1.597 &  &  \tabularnewline
Midrange & 1.503 &  &  \tabularnewline
Midmean - Weighted Average at Xnp & 1.58948648648649 &  &  \tabularnewline
Midmean - Weighted Average at X(n+1)p & 1.58948648648649 &  &  \tabularnewline
Midmean - Empirical Distribution Function & 1.58948648648649 &  &  \tabularnewline
Midmean - Empirical Distribution Function - Averaging & 1.58948648648649 &  &  \tabularnewline
Midmean - Empirical Distribution Function - Interpolation & 1.58948648648649 &  &  \tabularnewline
Midmean - Closest Observation & 1.58948648648649 &  &  \tabularnewline
Midmean - True Basic - Statistics Graphics Toolkit & 1.58948648648649 &  &  \tabularnewline
Midmean - MS Excel (old versions) & 1.59271052631579 &  &  \tabularnewline
Number of observations & 72 &  &  \tabularnewline
\hline
\end{tabular}
%Source: https://freestatistics.org/blog/index.php?pk=240549&T=1

[TABLE]
[ROW][C]Central Tendency - Ungrouped Data[/C][/ROW]
[ROW][C]Measure[/C][C]Value[/C][C]S.E.[/C][C]Value/S.E.[/C][/ROW]
[ROW][C]Arithmetic Mean[/C][C]1.57744444444444[/C][C]0.0190562946698709[/C][C]82.7781303643713[/C][/ROW]
[ROW][C]Geometric Mean[/C][C]1.56892969817092[/C][C][/C][C][/C][/ROW]
[ROW][C]Harmonic Mean[/C][C]1.56006753668801[/C][C][/C][C][/C][/ROW]
[ROW][C]Quadratic Mean[/C][C]1.5855958133564[/C][C][/C][C][/C][/ROW]
[ROW][C]Winsorized Mean ( 1 / 24 )[/C][C]1.57788888888889[/C][C]0.0189048618370533[/C][C]83.4647141295816[/C][/ROW]
[ROW][C]Winsorized Mean ( 2 / 24 )[/C][C]1.57927777777778[/C][C]0.0185277381848559[/C][C]85.2385629600834[/C][/ROW]
[ROW][C]Winsorized Mean ( 3 / 24 )[/C][C]1.57865277777778[/C][C]0.0181637715714661[/C][C]86.9121686300945[/C][/ROW]
[ROW][C]Winsorized Mean ( 4 / 24 )[/C][C]1.57870833333333[/C][C]0.0178293668255669[/C][C]88.5453952896129[/C][/ROW]
[ROW][C]Winsorized Mean ( 5 / 24 )[/C][C]1.57891666666667[/C][C]0.0177052876419767[/C][C]89.1776907890093[/C][/ROW]
[ROW][C]Winsorized Mean ( 6 / 24 )[/C][C]1.58025[/C][C]0.0174191599176847[/C][C]90.719070693855[/C][/ROW]
[ROW][C]Winsorized Mean ( 7 / 24 )[/C][C]1.58326388888889[/C][C]0.016705623403756[/C][C]94.7743074666053[/C][/ROW]
[ROW][C]Winsorized Mean ( 8 / 24 )[/C][C]1.58604166666667[/C][C]0.0161489113755393[/C][C]98.213534632993[/C][/ROW]
[ROW][C]Winsorized Mean ( 9 / 24 )[/C][C]1.58729166666667[/C][C]0.0157608600497258[/C][C]100.710980343632[/C][/ROW]
[ROW][C]Winsorized Mean ( 10 / 24 )[/C][C]1.58715277777778[/C][C]0.015195513243702[/C][C]104.448777235977[/C][/ROW]
[ROW][C]Winsorized Mean ( 11 / 24 )[/C][C]1.58806944444444[/C][C]0.0149944215812382[/C][C]105.910683906041[/C][/ROW]
[ROW][C]Winsorized Mean ( 12 / 24 )[/C][C]1.58823611111111[/C][C]0.0149142632293492[/C][C]106.49108753731[/C][/ROW]
[ROW][C]Winsorized Mean ( 13 / 24 )[/C][C]1.58751388888889[/C][C]0.0141871295606407[/C][C]111.898173771044[/C][/ROW]
[ROW][C]Winsorized Mean ( 14 / 24 )[/C][C]1.58984722222222[/C][C]0.0137606362293859[/C][C]115.535880443311[/C][/ROW]
[ROW][C]Winsorized Mean ( 15 / 24 )[/C][C]1.58984722222222[/C][C]0.0136978011857675[/C][C]116.06587076721[/C][/ROW]
[ROW][C]Winsorized Mean ( 16 / 24 )[/C][C]1.59095833333333[/C][C]0.0132623320457256[/C][C]119.960677190713[/C][/ROW]
[ROW][C]Winsorized Mean ( 17 / 24 )[/C][C]1.59591666666667[/C][C]0.0113938550758656[/C][C]140.068190795856[/C][/ROW]
[ROW][C]Winsorized Mean ( 18 / 24 )[/C][C]1.59516666666667[/C][C]0.0112867726258098[/C][C]141.330628298381[/C][/ROW]
[ROW][C]Winsorized Mean ( 19 / 24 )[/C][C]1.59411111111111[/C][C]0.0109926806555604[/C][C]145.015684623274[/C][/ROW]
[ROW][C]Winsorized Mean ( 20 / 24 )[/C][C]1.59327777777778[/C][C]0.0108011660788473[/C][C]147.509793493316[/C][/ROW]
[ROW][C]Winsorized Mean ( 21 / 24 )[/C][C]1.59356944444444[/C][C]0.0107619502015029[/C][C]148.074411663966[/C][/ROW]
[ROW][C]Winsorized Mean ( 22 / 24 )[/C][C]1.59204166666667[/C][C]0.0103049822624202[/C][C]154.492421832928[/C][/ROW]
[ROW][C]Winsorized Mean ( 23 / 24 )[/C][C]1.58948611111111[/C][C]0.00953867412234769[/C][C]166.635959120061[/C][/ROW]
[ROW][C]Winsorized Mean ( 24 / 24 )[/C][C]1.58748611111111[/C][C]0.00919223904328723[/C][C]172.698523573579[/C][/ROW]
[ROW][C]Trimmed Mean ( 1 / 24 )[/C][C]1.57957142857143[/C][C]0.0183987979109152[/C][C]85.8518820750969[/C][/ROW]
[ROW][C]Trimmed Mean ( 2 / 24 )[/C][C]1.58135294117647[/C][C]0.0177945889111076[/C][C]88.8670679090188[/C][/ROW]
[ROW][C]Trimmed Mean ( 3 / 24 )[/C][C]1.58248484848485[/C][C]0.0173158811516458[/C][C]91.3892186384313[/C][/ROW]
[ROW][C]Trimmed Mean ( 4 / 24 )[/C][C]1.583921875[/C][C]0.0169060972242826[/C][C]93.6893863786008[/C][/ROW]
[ROW][C]Trimmed Mean ( 5 / 24 )[/C][C]1.58543548387097[/C][C]0.0165318086897691[/C][C]95.9021189769836[/C][/ROW]
[ROW][C]Trimmed Mean ( 6 / 24 )[/C][C]1.587[/C][C]0.0161130364457735[/C][C]98.4916781725691[/C][/ROW]
[ROW][C]Trimmed Mean ( 7 / 24 )[/C][C]1.58839655172414[/C][C]0.0156826116164183[/C][C]101.283930927756[/C][/ROW]
[ROW][C]Trimmed Mean ( 8 / 24 )[/C][C]1.58933928571429[/C][C]0.0153436876649505[/C][C]103.582614585202[/C][/ROW]
[ROW][C]Trimmed Mean ( 9 / 24 )[/C][C]1.58988888888889[/C][C]0.0150587404863788[/C][C]105.579141252019[/C][/ROW]
[ROW][C]Trimmed Mean ( 10 / 24 )[/C][C]1.59028846153846[/C][C]0.0147880790658341[/C][C]107.538541987689[/C][/ROW]
[ROW][C]Trimmed Mean ( 11 / 24 )[/C][C]1.59074[/C][C]0.014566324316094[/C][C]109.206685604441[/C][/ROW]
[ROW][C]Trimmed Mean ( 12 / 24 )[/C][C]1.59110416666667[/C][C]0.0143189739092929[/C][C]111.118588297311[/C][/ROW]
[ROW][C]Trimmed Mean ( 13 / 24 )[/C][C]1.59147826086957[/C][C]0.0140097874390505[/C][C]113.597602232959[/C][/ROW]
[ROW][C]Trimmed Mean ( 14 / 24 )[/C][C]1.59197727272727[/C][C]0.0137613104984458[/C][C]115.685004920649[/C][/ROW]
[ROW][C]Trimmed Mean ( 15 / 24 )[/C][C]1.5922380952381[/C][C]0.0135190238706637[/C][C]117.77759329897[/C][/ROW]
[ROW][C]Trimmed Mean ( 16 / 24 )[/C][C]1.592525[/C][C]0.0131978527536752[/C][C]120.665462005289[/C][/ROW]
[ROW][C]Trimmed Mean ( 17 / 24 )[/C][C]1.59271052631579[/C][C]0.012859339024023[/C][C]123.856329111503[/C][/ROW]
[ROW][C]Trimmed Mean ( 18 / 24 )[/C][C]1.59233333333333[/C][C]0.0128201849774932[/C][C]124.2051761444[/C][/ROW]
[ROW][C]Trimmed Mean ( 19 / 24 )[/C][C]1.592[/C][C]0.0127494713462105[/C][C]124.867922501993[/C][/ROW]
[ROW][C]Trimmed Mean ( 20 / 24 )[/C][C]1.59175[/C][C]0.0126780862502091[/C][C]125.551283418169[/C][/ROW]
[ROW][C]Trimmed Mean ( 21 / 24 )[/C][C]1.59156666666667[/C][C]0.0125758099607374[/C][C]126.557786069895[/C][/ROW]
[ROW][C]Trimmed Mean ( 22 / 24 )[/C][C]1.59132142857143[/C][C]0.0123835371996537[/C][C]128.502979634601[/C][/ROW]
[ROW][C]Trimmed Mean ( 23 / 24 )[/C][C]1.59123076923077[/C][C]0.0121861595758098[/C][C]130.576885960812[/C][/ROW]
[ROW][C]Trimmed Mean ( 24 / 24 )[/C][C]1.59145833333333[/C][C]0.012075394068444[/C][C]131.793490490899[/C][/ROW]
[ROW][C]Median[/C][C]1.597[/C][C][/C][C][/C][/ROW]
[ROW][C]Midrange[/C][C]1.503[/C][C][/C][C][/C][/ROW]
[ROW][C]Midmean - Weighted Average at Xnp[/C][C]1.58948648648649[/C][C][/C][C][/C][/ROW]
[ROW][C]Midmean - Weighted Average at X(n+1)p[/C][C]1.58948648648649[/C][C][/C][C][/C][/ROW]
[ROW][C]Midmean - Empirical Distribution Function[/C][C]1.58948648648649[/C][C][/C][C][/C][/ROW]
[ROW][C]Midmean - Empirical Distribution Function - Averaging[/C][C]1.58948648648649[/C][C][/C][C][/C][/ROW]
[ROW][C]Midmean - Empirical Distribution Function - Interpolation[/C][C]1.58948648648649[/C][C][/C][C][/C][/ROW]
[ROW][C]Midmean - Closest Observation[/C][C]1.58948648648649[/C][C][/C][C][/C][/ROW]
[ROW][C]Midmean - True Basic - Statistics Graphics Toolkit[/C][C]1.58948648648649[/C][C][/C][C][/C][/ROW]
[ROW][C]Midmean - MS Excel (old versions)[/C][C]1.59271052631579[/C][C][/C][C][/C][/ROW]
[ROW][C]Number of observations[/C][C]72[/C][C][/C][C][/C][/ROW]
[/TABLE]
Source: https://freestatistics.org/blog/index.php?pk=240549&T=1

Globally Unique Identifier (entire table): ba.freestatistics.org/blog/index.php?pk=240549&T=1

As an alternative you can also use a QR Code:  

The GUIDs for individual cells are displayed in the table below:

Central Tendency - Ungrouped Data
MeasureValueS.E.Value/S.E.
Arithmetic Mean1.577444444444440.019056294669870982.7781303643713
Geometric Mean1.56892969817092
Harmonic Mean1.56006753668801
Quadratic Mean1.5855958133564
Winsorized Mean ( 1 / 24 )1.577888888888890.018904861837053383.4647141295816
Winsorized Mean ( 2 / 24 )1.579277777777780.018527738184855985.2385629600834
Winsorized Mean ( 3 / 24 )1.578652777777780.018163771571466186.9121686300945
Winsorized Mean ( 4 / 24 )1.578708333333330.017829366825566988.5453952896129
Winsorized Mean ( 5 / 24 )1.578916666666670.017705287641976789.1776907890093
Winsorized Mean ( 6 / 24 )1.580250.017419159917684790.719070693855
Winsorized Mean ( 7 / 24 )1.583263888888890.01670562340375694.7743074666053
Winsorized Mean ( 8 / 24 )1.586041666666670.016148911375539398.213534632993
Winsorized Mean ( 9 / 24 )1.587291666666670.0157608600497258100.710980343632
Winsorized Mean ( 10 / 24 )1.587152777777780.015195513243702104.448777235977
Winsorized Mean ( 11 / 24 )1.588069444444440.0149944215812382105.910683906041
Winsorized Mean ( 12 / 24 )1.588236111111110.0149142632293492106.49108753731
Winsorized Mean ( 13 / 24 )1.587513888888890.0141871295606407111.898173771044
Winsorized Mean ( 14 / 24 )1.589847222222220.0137606362293859115.535880443311
Winsorized Mean ( 15 / 24 )1.589847222222220.0136978011857675116.06587076721
Winsorized Mean ( 16 / 24 )1.590958333333330.0132623320457256119.960677190713
Winsorized Mean ( 17 / 24 )1.595916666666670.0113938550758656140.068190795856
Winsorized Mean ( 18 / 24 )1.595166666666670.0112867726258098141.330628298381
Winsorized Mean ( 19 / 24 )1.594111111111110.0109926806555604145.015684623274
Winsorized Mean ( 20 / 24 )1.593277777777780.0108011660788473147.509793493316
Winsorized Mean ( 21 / 24 )1.593569444444440.0107619502015029148.074411663966
Winsorized Mean ( 22 / 24 )1.592041666666670.0103049822624202154.492421832928
Winsorized Mean ( 23 / 24 )1.589486111111110.00953867412234769166.635959120061
Winsorized Mean ( 24 / 24 )1.587486111111110.00919223904328723172.698523573579
Trimmed Mean ( 1 / 24 )1.579571428571430.018398797910915285.8518820750969
Trimmed Mean ( 2 / 24 )1.581352941176470.017794588911107688.8670679090188
Trimmed Mean ( 3 / 24 )1.582484848484850.017315881151645891.3892186384313
Trimmed Mean ( 4 / 24 )1.5839218750.016906097224282693.6893863786008
Trimmed Mean ( 5 / 24 )1.585435483870970.016531808689769195.9021189769836
Trimmed Mean ( 6 / 24 )1.5870.016113036445773598.4916781725691
Trimmed Mean ( 7 / 24 )1.588396551724140.0156826116164183101.283930927756
Trimmed Mean ( 8 / 24 )1.589339285714290.0153436876649505103.582614585202
Trimmed Mean ( 9 / 24 )1.589888888888890.0150587404863788105.579141252019
Trimmed Mean ( 10 / 24 )1.590288461538460.0147880790658341107.538541987689
Trimmed Mean ( 11 / 24 )1.590740.014566324316094109.206685604441
Trimmed Mean ( 12 / 24 )1.591104166666670.0143189739092929111.118588297311
Trimmed Mean ( 13 / 24 )1.591478260869570.0140097874390505113.597602232959
Trimmed Mean ( 14 / 24 )1.591977272727270.0137613104984458115.685004920649
Trimmed Mean ( 15 / 24 )1.59223809523810.0135190238706637117.77759329897
Trimmed Mean ( 16 / 24 )1.5925250.0131978527536752120.665462005289
Trimmed Mean ( 17 / 24 )1.592710526315790.012859339024023123.856329111503
Trimmed Mean ( 18 / 24 )1.592333333333330.0128201849774932124.2051761444
Trimmed Mean ( 19 / 24 )1.5920.0127494713462105124.867922501993
Trimmed Mean ( 20 / 24 )1.591750.0126780862502091125.551283418169
Trimmed Mean ( 21 / 24 )1.591566666666670.0125758099607374126.557786069895
Trimmed Mean ( 22 / 24 )1.591321428571430.0123835371996537128.502979634601
Trimmed Mean ( 23 / 24 )1.591230769230770.0121861595758098130.576885960812
Trimmed Mean ( 24 / 24 )1.591458333333330.012075394068444131.793490490899
Median1.597
Midrange1.503
Midmean - Weighted Average at Xnp1.58948648648649
Midmean - Weighted Average at X(n+1)p1.58948648648649
Midmean - Empirical Distribution Function1.58948648648649
Midmean - Empirical Distribution Function - Averaging1.58948648648649
Midmean - Empirical Distribution Function - Interpolation1.58948648648649
Midmean - Closest Observation1.58948648648649
Midmean - True Basic - Statistics Graphics Toolkit1.58948648648649
Midmean - MS Excel (old versions)1.59271052631579
Number of observations72


Parameters (Session):
Parameters (R input):
R code (references can be found in the software module):
geomean <- function(x) {
return(exp(mean(log(x))))
}
harmean <- function(x) {
return(1/mean(1/x))
}
quamean <- function(x) {
return(sqrt(mean(x*x)))
}
winmean <- function(x) {
x <-sort(x[!is.na(x)])
n<-length(x)
denom <- 3
nodenom <- n/denom
if (nodenom>40) denom <- n/40
sqrtn = sqrt(n)
roundnodenom = floor(nodenom)
win <- array(NA,dim=c(roundnodenom,2))
for (j in 1:roundnodenom) {
win[j,1] <- (j*x[j+1]+sum(x[(j+1):(n-j)])+j*x[n-j])/n
win[j,2] <- sd(c(rep(x[j+1],j),x[(j+1):(n-j)],rep(x[n-j],j)))/sqrtn
}
return(win)
}
trimean <- function(x) {
x <-sort(x[!is.na(x)])
n<-length(x)
denom <- 3
nodenom <- n/denom
if (nodenom>40) denom <- n/40
sqrtn = sqrt(n)
roundnodenom = floor(nodenom)
tri <- array(NA,dim=c(roundnodenom,2))
for (j in 1:roundnodenom) {
tri[j,1] <- mean(x,trim=j/n)
tri[j,2] <- sd(x[(j+1):(n-j)]) / sqrt(n-j*2)
}
return(tri)
}
midrange <- function(x) {
return((max(x)+min(x))/2)
}
q1 <- function(data,n,p,i,f) {
np <- n*p;
i <<- floor(np)
f <<- np - i
qvalue <- (1-f)*data[i] + f*data[i+1]
}
q2 <- function(data,n,p,i,f) {
np <- (n+1)*p
i <<- floor(np)
f <<- np - i
qvalue <- (1-f)*data[i] + f*data[i+1]
}
q3 <- function(data,n,p,i,f) {
np <- n*p
i <<- floor(np)
f <<- np - i
if (f==0) {
qvalue <- data[i]
} else {
qvalue <- data[i+1]
}
}
q4 <- function(data,n,p,i,f) {
np <- n*p
i <<- floor(np)
f <<- np - i
if (f==0) {
qvalue <- (data[i]+data[i+1])/2
} else {
qvalue <- data[i+1]
}
}
q5 <- function(data,n,p,i,f) {
np <- (n-1)*p
i <<- floor(np)
f <<- np - i
if (f==0) {
qvalue <- data[i+1]
} else {
qvalue <- data[i+1] + f*(data[i+2]-data[i+1])
}
}
q6 <- function(data,n,p,i,f) {
np <- n*p+0.5
i <<- floor(np)
f <<- np - i
qvalue <- data[i]
}
q7 <- function(data,n,p,i,f) {
np <- (n+1)*p
i <<- floor(np)
f <<- np - i
if (f==0) {
qvalue <- data[i]
} else {
qvalue <- f*data[i] + (1-f)*data[i+1]
}
}
q8 <- function(data,n,p,i,f) {
np <- (n+1)*p
i <<- floor(np)
f <<- np - i
if (f==0) {
qvalue <- data[i]
} else {
if (f == 0.5) {
qvalue <- (data[i]+data[i+1])/2
} else {
if (f < 0.5) {
qvalue <- data[i]
} else {
qvalue <- data[i+1]
}
}
}
}
midmean <- function(x,def) {
x <-sort(x[!is.na(x)])
n<-length(x)
if (def==1) {
qvalue1 <- q1(x,n,0.25,i,f)
qvalue3 <- q1(x,n,0.75,i,f)
}
if (def==2) {
qvalue1 <- q2(x,n,0.25,i,f)
qvalue3 <- q2(x,n,0.75,i,f)
}
if (def==3) {
qvalue1 <- q3(x,n,0.25,i,f)
qvalue3 <- q3(x,n,0.75,i,f)
}
if (def==4) {
qvalue1 <- q4(x,n,0.25,i,f)
qvalue3 <- q4(x,n,0.75,i,f)
}
if (def==5) {
qvalue1 <- q5(x,n,0.25,i,f)
qvalue3 <- q5(x,n,0.75,i,f)
}
if (def==6) {
qvalue1 <- q6(x,n,0.25,i,f)
qvalue3 <- q6(x,n,0.75,i,f)
}
if (def==7) {
qvalue1 <- q7(x,n,0.25,i,f)
qvalue3 <- q7(x,n,0.75,i,f)
}
if (def==8) {
qvalue1 <- q8(x,n,0.25,i,f)
qvalue3 <- q8(x,n,0.75,i,f)
}
midm <- 0
myn <- 0
roundno4 <- round(n/4)
round3no4 <- round(3*n/4)
for (i in 1:n) {
if ((x[i]>=qvalue1) & (x[i]<=qvalue3)){
midm = midm + x[i]
myn = myn + 1
}
}
midm = midm / myn
return(midm)
}
(arm <- mean(x))
sqrtn <- sqrt(length(x))
(armse <- sd(x) / sqrtn)
(armose <- arm / armse)
(geo <- geomean(x))
(har <- harmean(x))
(qua <- quamean(x))
(win <- winmean(x))
(tri <- trimean(x))
(midr <- midrange(x))
midm <- array(NA,dim=8)
for (j in 1:8) midm[j] <- midmean(x,j)
midm
bitmap(file='test1.png')
lb <- win[,1] - 2*win[,2]
ub <- win[,1] + 2*win[,2]
if ((ylimmin == '') | (ylimmax == '')) plot(win[,1],type='b',main=main, xlab='j', pch=19, ylab='Winsorized Mean(j/n)', ylim=c(min(lb),max(ub))) else plot(win[,1],type='l',main=main, xlab='j', pch=19, ylab='Winsorized Mean(j/n)', ylim=c(ylimmin,ylimmax))
lines(ub,lty=3)
lines(lb,lty=3)
grid()
dev.off()
bitmap(file='test2.png')
lb <- tri[,1] - 2*tri[,2]
ub <- tri[,1] + 2*tri[,2]
if ((ylimmin == '') | (ylimmax == '')) plot(tri[,1],type='b',main=main, xlab='j', pch=19, ylab='Trimmed Mean(j/n)', ylim=c(min(lb),max(ub))) else plot(tri[,1],type='l',main=main, xlab='j', pch=19, ylab='Trimmed Mean(j/n)', ylim=c(ylimmin,ylimmax))
lines(ub,lty=3)
lines(lb,lty=3)
grid()
dev.off()
load(file='createtable')
a<-table.start()
a<-table.row.start(a)
a<-table.element(a,'Central Tendency - Ungrouped Data',4,TRUE)
a<-table.row.end(a)
a<-table.row.start(a)
a<-table.element(a,'Measure',header=TRUE)
a<-table.element(a,'Value',header=TRUE)
a<-table.element(a,'S.E.',header=TRUE)
a<-table.element(a,'Value/S.E.',header=TRUE)
a<-table.row.end(a)
a<-table.row.start(a)
a<-table.element(a,hyperlink('arithmetic_mean.htm', 'Arithmetic Mean', 'click to view the definition of the Arithmetic Mean'),header=TRUE)
a<-table.element(a,arm)
a<-table.element(a,hyperlink('arithmetic_mean_standard_error.htm', armse, 'click to view the definition of the Standard Error of the Arithmetic Mean'))
a<-table.element(a,armose)
a<-table.row.end(a)
a<-table.row.start(a)
a<-table.element(a,hyperlink('geometric_mean.htm', 'Geometric Mean', 'click to view the definition of the Geometric Mean'),header=TRUE)
a<-table.element(a,geo)
a<-table.element(a,'')
a<-table.row.end(a)
a<-table.row.start(a)
a<-table.element(a,hyperlink('harmonic_mean.htm', 'Harmonic Mean', 'click to view the definition of the Harmonic Mean'),header=TRUE)
a<-table.element(a,har)
a<-table.element(a,'')
a<-table.row.end(a)
a<-table.row.start(a)
a<-table.element(a,hyperlink('quadratic_mean.htm', 'Quadratic Mean', 'click to view the definition of the Quadratic Mean'),header=TRUE)
a<-table.element(a,qua)
a<-table.element(a,'')
a<-table.row.end(a)
for (j in 1:length(win[,1])) {
a<-table.row.start(a)
mylabel <- paste('Winsorized Mean (',j)
mylabel <- paste(mylabel,'/')
mylabel <- paste(mylabel,length(win[,1]))
mylabel <- paste(mylabel,')')
a<-table.element(a,hyperlink('winsorized_mean.htm', mylabel, 'click to view the definition of the Winsorized Mean'),header=TRUE)
a<-table.element(a,win[j,1])
a<-table.element(a,win[j,2])
a<-table.element(a,win[j,1]/win[j,2])
a<-table.row.end(a)
}
for (j in 1:length(tri[,1])) {
a<-table.row.start(a)
mylabel <- paste('Trimmed Mean (',j)
mylabel <- paste(mylabel,'/')
mylabel <- paste(mylabel,length(tri[,1]))
mylabel <- paste(mylabel,')')
a<-table.element(a,hyperlink('arithmetic_mean.htm', mylabel, 'click to view the definition of the Trimmed Mean'),header=TRUE)
a<-table.element(a,tri[j,1])
a<-table.element(a,tri[j,2])
a<-table.element(a,tri[j,1]/tri[j,2])
a<-table.row.end(a)
}
a<-table.row.start(a)
a<-table.element(a,hyperlink('median_1.htm', 'Median', 'click to view the definition of the Median'),header=TRUE)
a<-table.element(a,median(x))
a<-table.element(a,'')
a<-table.row.end(a)
a<-table.row.start(a)
a<-table.element(a,hyperlink('midrange.htm', 'Midrange', 'click to view the definition of the Midrange'),header=TRUE)
a<-table.element(a,midr)
a<-table.element(a,'')
a<-table.row.end(a)
a<-table.row.start(a)
mymid <- hyperlink('midmean.htm', 'Midmean', 'click to view the definition of the Midmean')
mylabel <- paste(mymid,hyperlink('method_1.htm','Weighted Average at Xnp',''),sep=' - ')
a<-table.element(a,mylabel,header=TRUE)
a<-table.element(a,midm[1])
a<-table.element(a,'')
a<-table.row.end(a)
a<-table.row.start(a)
mymid <- hyperlink('midmean.htm', 'Midmean', 'click to view the definition of the Midmean')
mylabel <- paste(mymid,hyperlink('method_2.htm','Weighted Average at X(n+1)p',''),sep=' - ')
a<-table.element(a,mylabel,header=TRUE)
a<-table.element(a,midm[2])
a<-table.element(a,'')
a<-table.row.end(a)
a<-table.row.start(a)
mymid <- hyperlink('midmean.htm', 'Midmean', 'click to view the definition of the Midmean')
mylabel <- paste(mymid,hyperlink('method_3.htm','Empirical Distribution Function',''),sep=' - ')
a<-table.element(a,mylabel,header=TRUE)
a<-table.element(a,midm[3])
a<-table.element(a,'')
a<-table.row.end(a)
a<-table.row.start(a)
mymid <- hyperlink('midmean.htm', 'Midmean', 'click to view the definition of the Midmean')
mylabel <- paste(mymid,hyperlink('method_4.htm','Empirical Distribution Function - Averaging',''),sep=' - ')
a<-table.element(a,mylabel,header=TRUE)
a<-table.element(a,midm[4])
a<-table.element(a,'')
a<-table.row.end(a)
a<-table.row.start(a)
mymid <- hyperlink('midmean.htm', 'Midmean', 'click to view the definition of the Midmean')
mylabel <- paste(mymid,hyperlink('method_5.htm','Empirical Distribution Function - Interpolation',''),sep=' - ')
a<-table.element(a,mylabel,header=TRUE)
a<-table.element(a,midm[5])
a<-table.element(a,'')
a<-table.row.end(a)
a<-table.row.start(a)
mymid <- hyperlink('midmean.htm', 'Midmean', 'click to view the definition of the Midmean')
mylabel <- paste(mymid,hyperlink('method_6.htm','Closest Observation',''),sep=' - ')
a<-table.element(a,mylabel,header=TRUE)
a<-table.element(a,midm[6])
a<-table.element(a,'')
a<-table.row.end(a)
a<-table.row.start(a)
mymid <- hyperlink('midmean.htm', 'Midmean', 'click to view the definition of the Midmean')
mylabel <- paste(mymid,hyperlink('method_7.htm','True Basic - Statistics Graphics Toolkit',''),sep=' - ')
a<-table.element(a,mylabel,header=TRUE)
a<-table.element(a,midm[7])
a<-table.element(a,'')
a<-table.row.end(a)
a<-table.row.start(a)
mymid <- hyperlink('midmean.htm', 'Midmean', 'click to view the definition of the Midmean')
mylabel <- paste(mymid,hyperlink('method_8.htm','MS Excel (old versions)',''),sep=' - ')
a<-table.element(a,mylabel,header=TRUE)
a<-table.element(a,midm[8])
a<-table.element(a,'')
a<-table.row.end(a)
a<-table.row.start(a)
a<-table.element(a,'Number of observations',header=TRUE)
a<-table.element(a,length(x))
a<-table.element(a,'')
a<-table.row.end(a)
a<-table.end(a)
table.save(a,file='mytable.tab')