Free Statistics

of Irreproducible Research!

Author's title

Author*Unverified author*
R Software Modulerwasp_centraltendency.wasp
Title produced by softwareCentral Tendency
Date of computationSun, 12 Oct 2014 11:56:30 +0100
Cite this page as followsStatistical Computations at FreeStatistics.org, Office for Research Development and Education, URL https://freestatistics.org/blog/index.php?v=date/2014/Oct/12/t1413111432rqf73n5n174vze1.htm/, Retrieved Wed, 15 May 2024 04:14:35 +0000
Statistical Computations at FreeStatistics.org, Office for Research Development and Education, URL https://freestatistics.org/blog/index.php?pk=240542, Retrieved Wed, 15 May 2024 04:14:35 +0000
QR Codes:

Original text written by user:
IsPrivate?No (this computation is public)
User-defined keywords
Estimated Impact117
Family? (F = Feedback message, R = changed R code, M = changed R Module, P = changed Parameters, D = changed Data)
-       [Central Tendency] [] [2014-10-12 10:56:30] [e5757b82694375e1f239be852782e5f7] [Current]
Feedback Forum

Post a new message
Dataseries X:
220,05
220,05
220,62
221,53
221,61
221,5
221,5
221,87
222,27
220,86
221,49
221,67
221,67
221,72
221,67
220,29
220,75
219,59
219,59
219,59
219,82
221,59
220,9
221,01
221,01
219,69
221
219,82
218,04
217,97
217,97
217,53
217
217,18
217,68
217,71
217,71
218,5
218,8
218,94
220
219,89
219,89
220,08
220,16
221
222,16
221,5
221,5
221,6
221,85
223,11
222,79
222,45
222,45
222,4
223,15
224,4
224,24
223,92
212,42
212,34
212,95
213,37
214,26
214,1
213,54
213,69
211,82
212,82
212,36
212,7


Summary of computational transaction
Raw Inputview raw input (R code)
Raw Outputview raw output of R engine
Computing time1 seconds
R Server'Gertrude Mary Cox' @ cox.wessa.net

\begin{tabular}{lllllllll}
\hline
Summary of computational transaction \tabularnewline
Raw Input & view raw input (R code)  \tabularnewline
Raw Output & view raw output of R engine  \tabularnewline
Computing time & 1 seconds \tabularnewline
R Server & 'Gertrude Mary Cox' @ cox.wessa.net \tabularnewline
\hline
\end{tabular}
%Source: https://freestatistics.org/blog/index.php?pk=240542&T=0

[TABLE]
[ROW][C]Summary of computational transaction[/C][/ROW]
[ROW][C]Raw Input[/C][C]view raw input (R code) [/C][/ROW]
[ROW][C]Raw Output[/C][C]view raw output of R engine [/C][/ROW]
[ROW][C]Computing time[/C][C]1 seconds[/C][/ROW]
[ROW][C]R Server[/C][C]'Gertrude Mary Cox' @ cox.wessa.net[/C][/ROW]
[/TABLE]
Source: https://freestatistics.org/blog/index.php?pk=240542&T=0

Globally Unique Identifier (entire table): ba.freestatistics.org/blog/index.php?pk=240542&T=0

As an alternative you can also use a QR Code:  

The GUIDs for individual cells are displayed in the table below:

Summary of computational transaction
Raw Inputview raw input (R code)
Raw Outputview raw output of R engine
Computing time1 seconds
R Server'Gertrude Mary Cox' @ cox.wessa.net


Central Tendency - Ungrouped Data
MeasureValueS.E.Value/S.E.
Arithmetic Mean219.3704166666670.388358088105587564.866352434571
Geometric Mean219.345770944391
Harmonic Mean219.320885350274
Quadratic Mean219.39482234281
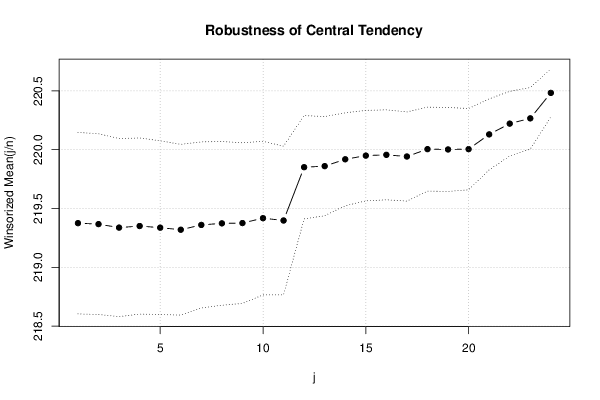
Winsorized Mean ( 1 / 24 )219.3754166666670.386042272364602568.267861762752
Winsorized Mean ( 2 / 24 )219.3670833333330.384369259439047570.719634690558
Winsorized Mean ( 3 / 24 )219.33750.378773386299796579.073155436523
Winsorized Mean ( 4 / 24 )219.3508333333330.374512450405334585.697039166336
Winsorized Mean ( 5 / 24 )219.3369444444440.369400480693377593.764642733387
Winsorized Mean ( 6 / 24 )219.3194444444440.363129755652298603.969906157859
Winsorized Mean ( 7 / 24 )219.3602777777780.353206637098876621.053668695276
Winsorized Mean ( 8 / 24 )219.3736111111110.348038394440213630.314398111027
Winsorized Mean ( 9 / 24 )219.3761111111110.341662919683768642.083464351818
Winsorized Mean ( 10 / 24 )219.4177777777780.326642426415842671.736920967031
Winsorized Mean ( 11 / 24 )219.3979166666670.315977315991892694.347048230185
Winsorized Mean ( 12 / 24 )219.851250.2196498260142151000.91702319751
Winsorized Mean ( 13 / 24 )219.8602777777780.2108042179809341042.95957587368
Winsorized Mean ( 14 / 24 )219.9186111111110.1976999300598731112.38588220294
Winsorized Mean ( 15 / 24 )219.9498611111110.1924444814616751142.926310178
Winsorized Mean ( 16 / 24 )219.9565277777780.1913395002893511149.5615251694
Winsorized Mean ( 17 / 24 )219.9423611111110.1895683769115131160.22706262752
Winsorized Mean ( 18 / 24 )220.0048611111110.1786467774403181231.5075830831
Winsorized Mean ( 19 / 24 )220.0022222222220.1783153672471551233.78161747152
Winsorized Mean ( 20 / 24 )220.0050.173121258850671270.81446530937
Winsorized Mean ( 21 / 24 )220.1304166666670.1510631905499271457.20751604218
Winsorized Mean ( 22 / 24 )220.2220833333330.1374011150331861602.76780345009
Winsorized Mean ( 23 / 24 )220.2668055555560.1309487210422511682.08443581885
Winsorized Mean ( 24 / 24 )220.4834722222220.1018433698215682164.92710923169
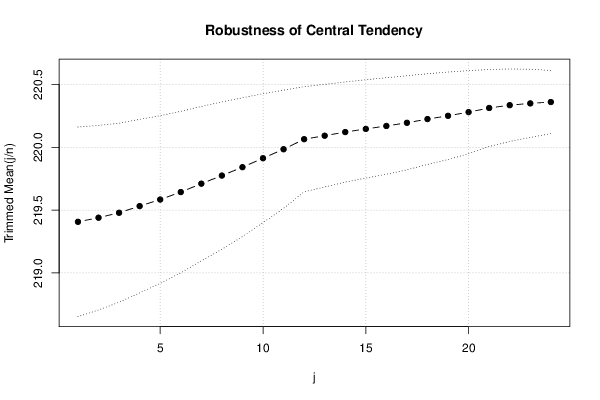
Trimmed Mean ( 1 / 24 )219.4064285714290.377582428208317581.082201342217
Trimmed Mean ( 2 / 24 )219.4392647058820.367475627722431597.15324813768
Trimmed Mean ( 3 / 24 )219.4786363636360.356406363394046615.810094616574
Trimmed Mean ( 4 / 24 )219.53156250.345555985944569635.299550375074
Trimmed Mean ( 5 / 24 )219.5840322580650.333962750868425657.510550763719
Trimmed Mean ( 6 / 24 )219.6433333333330.321353657607944683.494113520566
Trimmed Mean ( 7 / 24 )219.7103448275860.30751368784228714.473382857262
Trimmed Mean ( 8 / 24 )219.7746428571430.293154358999438749.689152183354
Trimmed Mean ( 9 / 24 )219.8414814814810.276425902085232795.299860914251
Trimmed Mean ( 10 / 24 )219.9130769230770.256649213691572856.862461255609
Trimmed Mean ( 11 / 24 )219.98440.235249959986116935.109191997239
Trimmed Mean ( 12 / 24 )220.0643750.2094381851309771050.73664032362
Trimmed Mean ( 13 / 24 )220.0921739130430.204234854166411077.64257384645
Trimmed Mean ( 14 / 24 )220.1213636363640.1993322868007451104.29357516176
Trimmed Mean ( 15 / 24 )220.146190476190.1958278393617721124.18229805157
Trimmed Mean ( 16 / 24 )220.169750.1921702929028291145.70127710285
Trimmed Mean ( 17 / 24 )220.1950.1872245249949961176.10126133788
Trimmed Mean ( 18 / 24 )220.2247222222220.1805531562722151219.72236192978
Trimmed Mean ( 19 / 24 )220.2505882352940.1742756545670451263.80582980718
Trimmed Mean ( 20 / 24 )220.280.1651447312452461333.86029538463
Trimmed Mean ( 21 / 24 )220.3130.1532852123390871437.27497674491
Trimmed Mean ( 22 / 24 )220.3353571428570.1442545902572241527.40621112972
Trimmed Mean ( 23 / 24 )220.3496153846150.1359462345864161620.85854054712
Trimmed Mean ( 24 / 24 )220.3604166666670.1255401072910461755.29893530992
Median220.12
Midrange218.11
Midmean - Weighted Average at Xnp220.092368421053
Midmean - Weighted Average at X(n+1)p220.224722222222
Midmean - Empirical Distribution Function220.092368421053
Midmean - Empirical Distribution Function - Averaging220.224722222222
Midmean - Empirical Distribution Function - Interpolation220.224722222222
Midmean - Closest Observation220.092368421053
Midmean - True Basic - Statistics Graphics Toolkit220.224722222222
Midmean - MS Excel (old versions)220.131282051282
Number of observations72

\begin{tabular}{lllllllll}
\hline
Central Tendency - Ungrouped Data \tabularnewline
Measure & Value & S.E. & Value/S.E. \tabularnewline
Arithmetic Mean & 219.370416666667 & 0.388358088105587 & 564.866352434571 \tabularnewline
Geometric Mean & 219.345770944391 &  &  \tabularnewline
Harmonic Mean & 219.320885350274 &  &  \tabularnewline
Quadratic Mean & 219.39482234281 &  &  \tabularnewline
Winsorized Mean ( 1 / 24 ) & 219.375416666667 & 0.386042272364602 & 568.267861762752 \tabularnewline
Winsorized Mean ( 2 / 24 ) & 219.367083333333 & 0.384369259439047 & 570.719634690558 \tabularnewline
Winsorized Mean ( 3 / 24 ) & 219.3375 & 0.378773386299796 & 579.073155436523 \tabularnewline
Winsorized Mean ( 4 / 24 ) & 219.350833333333 & 0.374512450405334 & 585.697039166336 \tabularnewline
Winsorized Mean ( 5 / 24 ) & 219.336944444444 & 0.369400480693377 & 593.764642733387 \tabularnewline
Winsorized Mean ( 6 / 24 ) & 219.319444444444 & 0.363129755652298 & 603.969906157859 \tabularnewline
Winsorized Mean ( 7 / 24 ) & 219.360277777778 & 0.353206637098876 & 621.053668695276 \tabularnewline
Winsorized Mean ( 8 / 24 ) & 219.373611111111 & 0.348038394440213 & 630.314398111027 \tabularnewline
Winsorized Mean ( 9 / 24 ) & 219.376111111111 & 0.341662919683768 & 642.083464351818 \tabularnewline
Winsorized Mean ( 10 / 24 ) & 219.417777777778 & 0.326642426415842 & 671.736920967031 \tabularnewline
Winsorized Mean ( 11 / 24 ) & 219.397916666667 & 0.315977315991892 & 694.347048230185 \tabularnewline
Winsorized Mean ( 12 / 24 ) & 219.85125 & 0.219649826014215 & 1000.91702319751 \tabularnewline
Winsorized Mean ( 13 / 24 ) & 219.860277777778 & 0.210804217980934 & 1042.95957587368 \tabularnewline
Winsorized Mean ( 14 / 24 ) & 219.918611111111 & 0.197699930059873 & 1112.38588220294 \tabularnewline
Winsorized Mean ( 15 / 24 ) & 219.949861111111 & 0.192444481461675 & 1142.926310178 \tabularnewline
Winsorized Mean ( 16 / 24 ) & 219.956527777778 & 0.191339500289351 & 1149.5615251694 \tabularnewline
Winsorized Mean ( 17 / 24 ) & 219.942361111111 & 0.189568376911513 & 1160.22706262752 \tabularnewline
Winsorized Mean ( 18 / 24 ) & 220.004861111111 & 0.178646777440318 & 1231.5075830831 \tabularnewline
Winsorized Mean ( 19 / 24 ) & 220.002222222222 & 0.178315367247155 & 1233.78161747152 \tabularnewline
Winsorized Mean ( 20 / 24 ) & 220.005 & 0.17312125885067 & 1270.81446530937 \tabularnewline
Winsorized Mean ( 21 / 24 ) & 220.130416666667 & 0.151063190549927 & 1457.20751604218 \tabularnewline
Winsorized Mean ( 22 / 24 ) & 220.222083333333 & 0.137401115033186 & 1602.76780345009 \tabularnewline
Winsorized Mean ( 23 / 24 ) & 220.266805555556 & 0.130948721042251 & 1682.08443581885 \tabularnewline
Winsorized Mean ( 24 / 24 ) & 220.483472222222 & 0.101843369821568 & 2164.92710923169 \tabularnewline
Trimmed Mean ( 1 / 24 ) & 219.406428571429 & 0.377582428208317 & 581.082201342217 \tabularnewline
Trimmed Mean ( 2 / 24 ) & 219.439264705882 & 0.367475627722431 & 597.15324813768 \tabularnewline
Trimmed Mean ( 3 / 24 ) & 219.478636363636 & 0.356406363394046 & 615.810094616574 \tabularnewline
Trimmed Mean ( 4 / 24 ) & 219.5315625 & 0.345555985944569 & 635.299550375074 \tabularnewline
Trimmed Mean ( 5 / 24 ) & 219.584032258065 & 0.333962750868425 & 657.510550763719 \tabularnewline
Trimmed Mean ( 6 / 24 ) & 219.643333333333 & 0.321353657607944 & 683.494113520566 \tabularnewline
Trimmed Mean ( 7 / 24 ) & 219.710344827586 & 0.30751368784228 & 714.473382857262 \tabularnewline
Trimmed Mean ( 8 / 24 ) & 219.774642857143 & 0.293154358999438 & 749.689152183354 \tabularnewline
Trimmed Mean ( 9 / 24 ) & 219.841481481481 & 0.276425902085232 & 795.299860914251 \tabularnewline
Trimmed Mean ( 10 / 24 ) & 219.913076923077 & 0.256649213691572 & 856.862461255609 \tabularnewline
Trimmed Mean ( 11 / 24 ) & 219.9844 & 0.235249959986116 & 935.109191997239 \tabularnewline
Trimmed Mean ( 12 / 24 ) & 220.064375 & 0.209438185130977 & 1050.73664032362 \tabularnewline
Trimmed Mean ( 13 / 24 ) & 220.092173913043 & 0.20423485416641 & 1077.64257384645 \tabularnewline
Trimmed Mean ( 14 / 24 ) & 220.121363636364 & 0.199332286800745 & 1104.29357516176 \tabularnewline
Trimmed Mean ( 15 / 24 ) & 220.14619047619 & 0.195827839361772 & 1124.18229805157 \tabularnewline
Trimmed Mean ( 16 / 24 ) & 220.16975 & 0.192170292902829 & 1145.70127710285 \tabularnewline
Trimmed Mean ( 17 / 24 ) & 220.195 & 0.187224524994996 & 1176.10126133788 \tabularnewline
Trimmed Mean ( 18 / 24 ) & 220.224722222222 & 0.180553156272215 & 1219.72236192978 \tabularnewline
Trimmed Mean ( 19 / 24 ) & 220.250588235294 & 0.174275654567045 & 1263.80582980718 \tabularnewline
Trimmed Mean ( 20 / 24 ) & 220.28 & 0.165144731245246 & 1333.86029538463 \tabularnewline
Trimmed Mean ( 21 / 24 ) & 220.313 & 0.153285212339087 & 1437.27497674491 \tabularnewline
Trimmed Mean ( 22 / 24 ) & 220.335357142857 & 0.144254590257224 & 1527.40621112972 \tabularnewline
Trimmed Mean ( 23 / 24 ) & 220.349615384615 & 0.135946234586416 & 1620.85854054712 \tabularnewline
Trimmed Mean ( 24 / 24 ) & 220.360416666667 & 0.125540107291046 & 1755.29893530992 \tabularnewline
Median & 220.12 &  &  \tabularnewline
Midrange & 218.11 &  &  \tabularnewline
Midmean - Weighted Average at Xnp & 220.092368421053 &  &  \tabularnewline
Midmean - Weighted Average at X(n+1)p & 220.224722222222 &  &  \tabularnewline
Midmean - Empirical Distribution Function & 220.092368421053 &  &  \tabularnewline
Midmean - Empirical Distribution Function - Averaging & 220.224722222222 &  &  \tabularnewline
Midmean - Empirical Distribution Function - Interpolation & 220.224722222222 &  &  \tabularnewline
Midmean - Closest Observation & 220.092368421053 &  &  \tabularnewline
Midmean - True Basic - Statistics Graphics Toolkit & 220.224722222222 &  &  \tabularnewline
Midmean - MS Excel (old versions) & 220.131282051282 &  &  \tabularnewline
Number of observations & 72 &  &  \tabularnewline
\hline
\end{tabular}
%Source: https://freestatistics.org/blog/index.php?pk=240542&T=1

[TABLE]
[ROW][C]Central Tendency - Ungrouped Data[/C][/ROW]
[ROW][C]Measure[/C][C]Value[/C][C]S.E.[/C][C]Value/S.E.[/C][/ROW]
[ROW][C]Arithmetic Mean[/C][C]219.370416666667[/C][C]0.388358088105587[/C][C]564.866352434571[/C][/ROW]
[ROW][C]Geometric Mean[/C][C]219.345770944391[/C][C][/C][C][/C][/ROW]
[ROW][C]Harmonic Mean[/C][C]219.320885350274[/C][C][/C][C][/C][/ROW]
[ROW][C]Quadratic Mean[/C][C]219.39482234281[/C][C][/C][C][/C][/ROW]
[ROW][C]Winsorized Mean ( 1 / 24 )[/C][C]219.375416666667[/C][C]0.386042272364602[/C][C]568.267861762752[/C][/ROW]
[ROW][C]Winsorized Mean ( 2 / 24 )[/C][C]219.367083333333[/C][C]0.384369259439047[/C][C]570.719634690558[/C][/ROW]
[ROW][C]Winsorized Mean ( 3 / 24 )[/C][C]219.3375[/C][C]0.378773386299796[/C][C]579.073155436523[/C][/ROW]
[ROW][C]Winsorized Mean ( 4 / 24 )[/C][C]219.350833333333[/C][C]0.374512450405334[/C][C]585.697039166336[/C][/ROW]
[ROW][C]Winsorized Mean ( 5 / 24 )[/C][C]219.336944444444[/C][C]0.369400480693377[/C][C]593.764642733387[/C][/ROW]
[ROW][C]Winsorized Mean ( 6 / 24 )[/C][C]219.319444444444[/C][C]0.363129755652298[/C][C]603.969906157859[/C][/ROW]
[ROW][C]Winsorized Mean ( 7 / 24 )[/C][C]219.360277777778[/C][C]0.353206637098876[/C][C]621.053668695276[/C][/ROW]
[ROW][C]Winsorized Mean ( 8 / 24 )[/C][C]219.373611111111[/C][C]0.348038394440213[/C][C]630.314398111027[/C][/ROW]
[ROW][C]Winsorized Mean ( 9 / 24 )[/C][C]219.376111111111[/C][C]0.341662919683768[/C][C]642.083464351818[/C][/ROW]
[ROW][C]Winsorized Mean ( 10 / 24 )[/C][C]219.417777777778[/C][C]0.326642426415842[/C][C]671.736920967031[/C][/ROW]
[ROW][C]Winsorized Mean ( 11 / 24 )[/C][C]219.397916666667[/C][C]0.315977315991892[/C][C]694.347048230185[/C][/ROW]
[ROW][C]Winsorized Mean ( 12 / 24 )[/C][C]219.85125[/C][C]0.219649826014215[/C][C]1000.91702319751[/C][/ROW]
[ROW][C]Winsorized Mean ( 13 / 24 )[/C][C]219.860277777778[/C][C]0.210804217980934[/C][C]1042.95957587368[/C][/ROW]
[ROW][C]Winsorized Mean ( 14 / 24 )[/C][C]219.918611111111[/C][C]0.197699930059873[/C][C]1112.38588220294[/C][/ROW]
[ROW][C]Winsorized Mean ( 15 / 24 )[/C][C]219.949861111111[/C][C]0.192444481461675[/C][C]1142.926310178[/C][/ROW]
[ROW][C]Winsorized Mean ( 16 / 24 )[/C][C]219.956527777778[/C][C]0.191339500289351[/C][C]1149.5615251694[/C][/ROW]
[ROW][C]Winsorized Mean ( 17 / 24 )[/C][C]219.942361111111[/C][C]0.189568376911513[/C][C]1160.22706262752[/C][/ROW]
[ROW][C]Winsorized Mean ( 18 / 24 )[/C][C]220.004861111111[/C][C]0.178646777440318[/C][C]1231.5075830831[/C][/ROW]
[ROW][C]Winsorized Mean ( 19 / 24 )[/C][C]220.002222222222[/C][C]0.178315367247155[/C][C]1233.78161747152[/C][/ROW]
[ROW][C]Winsorized Mean ( 20 / 24 )[/C][C]220.005[/C][C]0.17312125885067[/C][C]1270.81446530937[/C][/ROW]
[ROW][C]Winsorized Mean ( 21 / 24 )[/C][C]220.130416666667[/C][C]0.151063190549927[/C][C]1457.20751604218[/C][/ROW]
[ROW][C]Winsorized Mean ( 22 / 24 )[/C][C]220.222083333333[/C][C]0.137401115033186[/C][C]1602.76780345009[/C][/ROW]
[ROW][C]Winsorized Mean ( 23 / 24 )[/C][C]220.266805555556[/C][C]0.130948721042251[/C][C]1682.08443581885[/C][/ROW]
[ROW][C]Winsorized Mean ( 24 / 24 )[/C][C]220.483472222222[/C][C]0.101843369821568[/C][C]2164.92710923169[/C][/ROW]
[ROW][C]Trimmed Mean ( 1 / 24 )[/C][C]219.406428571429[/C][C]0.377582428208317[/C][C]581.082201342217[/C][/ROW]
[ROW][C]Trimmed Mean ( 2 / 24 )[/C][C]219.439264705882[/C][C]0.367475627722431[/C][C]597.15324813768[/C][/ROW]
[ROW][C]Trimmed Mean ( 3 / 24 )[/C][C]219.478636363636[/C][C]0.356406363394046[/C][C]615.810094616574[/C][/ROW]
[ROW][C]Trimmed Mean ( 4 / 24 )[/C][C]219.5315625[/C][C]0.345555985944569[/C][C]635.299550375074[/C][/ROW]
[ROW][C]Trimmed Mean ( 5 / 24 )[/C][C]219.584032258065[/C][C]0.333962750868425[/C][C]657.510550763719[/C][/ROW]
[ROW][C]Trimmed Mean ( 6 / 24 )[/C][C]219.643333333333[/C][C]0.321353657607944[/C][C]683.494113520566[/C][/ROW]
[ROW][C]Trimmed Mean ( 7 / 24 )[/C][C]219.710344827586[/C][C]0.30751368784228[/C][C]714.473382857262[/C][/ROW]
[ROW][C]Trimmed Mean ( 8 / 24 )[/C][C]219.774642857143[/C][C]0.293154358999438[/C][C]749.689152183354[/C][/ROW]
[ROW][C]Trimmed Mean ( 9 / 24 )[/C][C]219.841481481481[/C][C]0.276425902085232[/C][C]795.299860914251[/C][/ROW]
[ROW][C]Trimmed Mean ( 10 / 24 )[/C][C]219.913076923077[/C][C]0.256649213691572[/C][C]856.862461255609[/C][/ROW]
[ROW][C]Trimmed Mean ( 11 / 24 )[/C][C]219.9844[/C][C]0.235249959986116[/C][C]935.109191997239[/C][/ROW]
[ROW][C]Trimmed Mean ( 12 / 24 )[/C][C]220.064375[/C][C]0.209438185130977[/C][C]1050.73664032362[/C][/ROW]
[ROW][C]Trimmed Mean ( 13 / 24 )[/C][C]220.092173913043[/C][C]0.20423485416641[/C][C]1077.64257384645[/C][/ROW]
[ROW][C]Trimmed Mean ( 14 / 24 )[/C][C]220.121363636364[/C][C]0.199332286800745[/C][C]1104.29357516176[/C][/ROW]
[ROW][C]Trimmed Mean ( 15 / 24 )[/C][C]220.14619047619[/C][C]0.195827839361772[/C][C]1124.18229805157[/C][/ROW]
[ROW][C]Trimmed Mean ( 16 / 24 )[/C][C]220.16975[/C][C]0.192170292902829[/C][C]1145.70127710285[/C][/ROW]
[ROW][C]Trimmed Mean ( 17 / 24 )[/C][C]220.195[/C][C]0.187224524994996[/C][C]1176.10126133788[/C][/ROW]
[ROW][C]Trimmed Mean ( 18 / 24 )[/C][C]220.224722222222[/C][C]0.180553156272215[/C][C]1219.72236192978[/C][/ROW]
[ROW][C]Trimmed Mean ( 19 / 24 )[/C][C]220.250588235294[/C][C]0.174275654567045[/C][C]1263.80582980718[/C][/ROW]
[ROW][C]Trimmed Mean ( 20 / 24 )[/C][C]220.28[/C][C]0.165144731245246[/C][C]1333.86029538463[/C][/ROW]
[ROW][C]Trimmed Mean ( 21 / 24 )[/C][C]220.313[/C][C]0.153285212339087[/C][C]1437.27497674491[/C][/ROW]
[ROW][C]Trimmed Mean ( 22 / 24 )[/C][C]220.335357142857[/C][C]0.144254590257224[/C][C]1527.40621112972[/C][/ROW]
[ROW][C]Trimmed Mean ( 23 / 24 )[/C][C]220.349615384615[/C][C]0.135946234586416[/C][C]1620.85854054712[/C][/ROW]
[ROW][C]Trimmed Mean ( 24 / 24 )[/C][C]220.360416666667[/C][C]0.125540107291046[/C][C]1755.29893530992[/C][/ROW]
[ROW][C]Median[/C][C]220.12[/C][C][/C][C][/C][/ROW]
[ROW][C]Midrange[/C][C]218.11[/C][C][/C][C][/C][/ROW]
[ROW][C]Midmean - Weighted Average at Xnp[/C][C]220.092368421053[/C][C][/C][C][/C][/ROW]
[ROW][C]Midmean - Weighted Average at X(n+1)p[/C][C]220.224722222222[/C][C][/C][C][/C][/ROW]
[ROW][C]Midmean - Empirical Distribution Function[/C][C]220.092368421053[/C][C][/C][C][/C][/ROW]
[ROW][C]Midmean - Empirical Distribution Function - Averaging[/C][C]220.224722222222[/C][C][/C][C][/C][/ROW]
[ROW][C]Midmean - Empirical Distribution Function - Interpolation[/C][C]220.224722222222[/C][C][/C][C][/C][/ROW]
[ROW][C]Midmean - Closest Observation[/C][C]220.092368421053[/C][C][/C][C][/C][/ROW]
[ROW][C]Midmean - True Basic - Statistics Graphics Toolkit[/C][C]220.224722222222[/C][C][/C][C][/C][/ROW]
[ROW][C]Midmean - MS Excel (old versions)[/C][C]220.131282051282[/C][C][/C][C][/C][/ROW]
[ROW][C]Number of observations[/C][C]72[/C][C][/C][C][/C][/ROW]
[/TABLE]
Source: https://freestatistics.org/blog/index.php?pk=240542&T=1

Globally Unique Identifier (entire table): ba.freestatistics.org/blog/index.php?pk=240542&T=1

As an alternative you can also use a QR Code:  

The GUIDs for individual cells are displayed in the table below:

Central Tendency - Ungrouped Data
MeasureValueS.E.Value/S.E.
Arithmetic Mean219.3704166666670.388358088105587564.866352434571
Geometric Mean219.345770944391
Harmonic Mean219.320885350274
Quadratic Mean219.39482234281
Winsorized Mean ( 1 / 24 )219.3754166666670.386042272364602568.267861762752
Winsorized Mean ( 2 / 24 )219.3670833333330.384369259439047570.719634690558
Winsorized Mean ( 3 / 24 )219.33750.378773386299796579.073155436523
Winsorized Mean ( 4 / 24 )219.3508333333330.374512450405334585.697039166336
Winsorized Mean ( 5 / 24 )219.3369444444440.369400480693377593.764642733387
Winsorized Mean ( 6 / 24 )219.3194444444440.363129755652298603.969906157859
Winsorized Mean ( 7 / 24 )219.3602777777780.353206637098876621.053668695276
Winsorized Mean ( 8 / 24 )219.3736111111110.348038394440213630.314398111027
Winsorized Mean ( 9 / 24 )219.3761111111110.341662919683768642.083464351818
Winsorized Mean ( 10 / 24 )219.4177777777780.326642426415842671.736920967031
Winsorized Mean ( 11 / 24 )219.3979166666670.315977315991892694.347048230185
Winsorized Mean ( 12 / 24 )219.851250.2196498260142151000.91702319751
Winsorized Mean ( 13 / 24 )219.8602777777780.2108042179809341042.95957587368
Winsorized Mean ( 14 / 24 )219.9186111111110.1976999300598731112.38588220294
Winsorized Mean ( 15 / 24 )219.9498611111110.1924444814616751142.926310178
Winsorized Mean ( 16 / 24 )219.9565277777780.1913395002893511149.5615251694
Winsorized Mean ( 17 / 24 )219.9423611111110.1895683769115131160.22706262752
Winsorized Mean ( 18 / 24 )220.0048611111110.1786467774403181231.5075830831
Winsorized Mean ( 19 / 24 )220.0022222222220.1783153672471551233.78161747152
Winsorized Mean ( 20 / 24 )220.0050.173121258850671270.81446530937
Winsorized Mean ( 21 / 24 )220.1304166666670.1510631905499271457.20751604218
Winsorized Mean ( 22 / 24 )220.2220833333330.1374011150331861602.76780345009
Winsorized Mean ( 23 / 24 )220.2668055555560.1309487210422511682.08443581885
Winsorized Mean ( 24 / 24 )220.4834722222220.1018433698215682164.92710923169
Trimmed Mean ( 1 / 24 )219.4064285714290.377582428208317581.082201342217
Trimmed Mean ( 2 / 24 )219.4392647058820.367475627722431597.15324813768
Trimmed Mean ( 3 / 24 )219.4786363636360.356406363394046615.810094616574
Trimmed Mean ( 4 / 24 )219.53156250.345555985944569635.299550375074
Trimmed Mean ( 5 / 24 )219.5840322580650.333962750868425657.510550763719
Trimmed Mean ( 6 / 24 )219.6433333333330.321353657607944683.494113520566
Trimmed Mean ( 7 / 24 )219.7103448275860.30751368784228714.473382857262
Trimmed Mean ( 8 / 24 )219.7746428571430.293154358999438749.689152183354
Trimmed Mean ( 9 / 24 )219.8414814814810.276425902085232795.299860914251
Trimmed Mean ( 10 / 24 )219.9130769230770.256649213691572856.862461255609
Trimmed Mean ( 11 / 24 )219.98440.235249959986116935.109191997239
Trimmed Mean ( 12 / 24 )220.0643750.2094381851309771050.73664032362
Trimmed Mean ( 13 / 24 )220.0921739130430.204234854166411077.64257384645
Trimmed Mean ( 14 / 24 )220.1213636363640.1993322868007451104.29357516176
Trimmed Mean ( 15 / 24 )220.146190476190.1958278393617721124.18229805157
Trimmed Mean ( 16 / 24 )220.169750.1921702929028291145.70127710285
Trimmed Mean ( 17 / 24 )220.1950.1872245249949961176.10126133788
Trimmed Mean ( 18 / 24 )220.2247222222220.1805531562722151219.72236192978
Trimmed Mean ( 19 / 24 )220.2505882352940.1742756545670451263.80582980718
Trimmed Mean ( 20 / 24 )220.280.1651447312452461333.86029538463
Trimmed Mean ( 21 / 24 )220.3130.1532852123390871437.27497674491
Trimmed Mean ( 22 / 24 )220.3353571428570.1442545902572241527.40621112972
Trimmed Mean ( 23 / 24 )220.3496153846150.1359462345864161620.85854054712
Trimmed Mean ( 24 / 24 )220.3604166666670.1255401072910461755.29893530992
Median220.12
Midrange218.11
Midmean - Weighted Average at Xnp220.092368421053
Midmean - Weighted Average at X(n+1)p220.224722222222
Midmean - Empirical Distribution Function220.092368421053
Midmean - Empirical Distribution Function - Averaging220.224722222222
Midmean - Empirical Distribution Function - Interpolation220.224722222222
Midmean - Closest Observation220.092368421053
Midmean - True Basic - Statistics Graphics Toolkit220.224722222222
Midmean - MS Excel (old versions)220.131282051282
Number of observations72


Parameters (Session):
Parameters (R input):
R code (references can be found in the software module):
geomean <- function(x) {
return(exp(mean(log(x))))
}
harmean <- function(x) {
return(1/mean(1/x))
}
quamean <- function(x) {
return(sqrt(mean(x*x)))
}
winmean <- function(x) {
x <-sort(x[!is.na(x)])
n<-length(x)
denom <- 3
nodenom <- n/denom
if (nodenom>40) denom <- n/40
sqrtn = sqrt(n)
roundnodenom = floor(nodenom)
win <- array(NA,dim=c(roundnodenom,2))
for (j in 1:roundnodenom) {
win[j,1] <- (j*x[j+1]+sum(x[(j+1):(n-j)])+j*x[n-j])/n
win[j,2] <- sd(c(rep(x[j+1],j),x[(j+1):(n-j)],rep(x[n-j],j)))/sqrtn
}
return(win)
}
trimean <- function(x) {
x <-sort(x[!is.na(x)])
n<-length(x)
denom <- 3
nodenom <- n/denom
if (nodenom>40) denom <- n/40
sqrtn = sqrt(n)
roundnodenom = floor(nodenom)
tri <- array(NA,dim=c(roundnodenom,2))
for (j in 1:roundnodenom) {
tri[j,1] <- mean(x,trim=j/n)
tri[j,2] <- sd(x[(j+1):(n-j)]) / sqrt(n-j*2)
}
return(tri)
}
midrange <- function(x) {
return((max(x)+min(x))/2)
}
q1 <- function(data,n,p,i,f) {
np <- n*p;
i <<- floor(np)
f <<- np - i
qvalue <- (1-f)*data[i] + f*data[i+1]
}
q2 <- function(data,n,p,i,f) {
np <- (n+1)*p
i <<- floor(np)
f <<- np - i
qvalue <- (1-f)*data[i] + f*data[i+1]
}
q3 <- function(data,n,p,i,f) {
np <- n*p
i <<- floor(np)
f <<- np - i
if (f==0) {
qvalue <- data[i]
} else {
qvalue <- data[i+1]
}
}
q4 <- function(data,n,p,i,f) {
np <- n*p
i <<- floor(np)
f <<- np - i
if (f==0) {
qvalue <- (data[i]+data[i+1])/2
} else {
qvalue <- data[i+1]
}
}
q5 <- function(data,n,p,i,f) {
np <- (n-1)*p
i <<- floor(np)
f <<- np - i
if (f==0) {
qvalue <- data[i+1]
} else {
qvalue <- data[i+1] + f*(data[i+2]-data[i+1])
}
}
q6 <- function(data,n,p,i,f) {
np <- n*p+0.5
i <<- floor(np)
f <<- np - i
qvalue <- data[i]
}
q7 <- function(data,n,p,i,f) {
np <- (n+1)*p
i <<- floor(np)
f <<- np - i
if (f==0) {
qvalue <- data[i]
} else {
qvalue <- f*data[i] + (1-f)*data[i+1]
}
}
q8 <- function(data,n,p,i,f) {
np <- (n+1)*p
i <<- floor(np)
f <<- np - i
if (f==0) {
qvalue <- data[i]
} else {
if (f == 0.5) {
qvalue <- (data[i]+data[i+1])/2
} else {
if (f < 0.5) {
qvalue <- data[i]
} else {
qvalue <- data[i+1]
}
}
}
}
midmean <- function(x,def) {
x <-sort(x[!is.na(x)])
n<-length(x)
if (def==1) {
qvalue1 <- q1(x,n,0.25,i,f)
qvalue3 <- q1(x,n,0.75,i,f)
}
if (def==2) {
qvalue1 <- q2(x,n,0.25,i,f)
qvalue3 <- q2(x,n,0.75,i,f)
}
if (def==3) {
qvalue1 <- q3(x,n,0.25,i,f)
qvalue3 <- q3(x,n,0.75,i,f)
}
if (def==4) {
qvalue1 <- q4(x,n,0.25,i,f)
qvalue3 <- q4(x,n,0.75,i,f)
}
if (def==5) {
qvalue1 <- q5(x,n,0.25,i,f)
qvalue3 <- q5(x,n,0.75,i,f)
}
if (def==6) {
qvalue1 <- q6(x,n,0.25,i,f)
qvalue3 <- q6(x,n,0.75,i,f)
}
if (def==7) {
qvalue1 <- q7(x,n,0.25,i,f)
qvalue3 <- q7(x,n,0.75,i,f)
}
if (def==8) {
qvalue1 <- q8(x,n,0.25,i,f)
qvalue3 <- q8(x,n,0.75,i,f)
}
midm <- 0
myn <- 0
roundno4 <- round(n/4)
round3no4 <- round(3*n/4)
for (i in 1:n) {
if ((x[i]>=qvalue1) & (x[i]<=qvalue3)){
midm = midm + x[i]
myn = myn + 1
}
}
midm = midm / myn
return(midm)
}
(arm <- mean(x))
sqrtn <- sqrt(length(x))
(armse <- sd(x) / sqrtn)
(armose <- arm / armse)
(geo <- geomean(x))
(har <- harmean(x))
(qua <- quamean(x))
(win <- winmean(x))
(tri <- trimean(x))
(midr <- midrange(x))
midm <- array(NA,dim=8)
for (j in 1:8) midm[j] <- midmean(x,j)
midm
bitmap(file='test1.png')
lb <- win[,1] - 2*win[,2]
ub <- win[,1] + 2*win[,2]
if ((ylimmin == '') | (ylimmax == '')) plot(win[,1],type='b',main=main, xlab='j', pch=19, ylab='Winsorized Mean(j/n)', ylim=c(min(lb),max(ub))) else plot(win[,1],type='l',main=main, xlab='j', pch=19, ylab='Winsorized Mean(j/n)', ylim=c(ylimmin,ylimmax))
lines(ub,lty=3)
lines(lb,lty=3)
grid()
dev.off()
bitmap(file='test2.png')
lb <- tri[,1] - 2*tri[,2]
ub <- tri[,1] + 2*tri[,2]
if ((ylimmin == '') | (ylimmax == '')) plot(tri[,1],type='b',main=main, xlab='j', pch=19, ylab='Trimmed Mean(j/n)', ylim=c(min(lb),max(ub))) else plot(tri[,1],type='l',main=main, xlab='j', pch=19, ylab='Trimmed Mean(j/n)', ylim=c(ylimmin,ylimmax))
lines(ub,lty=3)
lines(lb,lty=3)
grid()
dev.off()
load(file='createtable')
a<-table.start()
a<-table.row.start(a)
a<-table.element(a,'Central Tendency - Ungrouped Data',4,TRUE)
a<-table.row.end(a)
a<-table.row.start(a)
a<-table.element(a,'Measure',header=TRUE)
a<-table.element(a,'Value',header=TRUE)
a<-table.element(a,'S.E.',header=TRUE)
a<-table.element(a,'Value/S.E.',header=TRUE)
a<-table.row.end(a)
a<-table.row.start(a)
a<-table.element(a,hyperlink('arithmetic_mean.htm', 'Arithmetic Mean', 'click to view the definition of the Arithmetic Mean'),header=TRUE)
a<-table.element(a,arm)
a<-table.element(a,hyperlink('arithmetic_mean_standard_error.htm', armse, 'click to view the definition of the Standard Error of the Arithmetic Mean'))
a<-table.element(a,armose)
a<-table.row.end(a)
a<-table.row.start(a)
a<-table.element(a,hyperlink('geometric_mean.htm', 'Geometric Mean', 'click to view the definition of the Geometric Mean'),header=TRUE)
a<-table.element(a,geo)
a<-table.element(a,'')
a<-table.row.end(a)
a<-table.row.start(a)
a<-table.element(a,hyperlink('harmonic_mean.htm', 'Harmonic Mean', 'click to view the definition of the Harmonic Mean'),header=TRUE)
a<-table.element(a,har)
a<-table.element(a,'')
a<-table.row.end(a)
a<-table.row.start(a)
a<-table.element(a,hyperlink('quadratic_mean.htm', 'Quadratic Mean', 'click to view the definition of the Quadratic Mean'),header=TRUE)
a<-table.element(a,qua)
a<-table.element(a,'')
a<-table.row.end(a)
for (j in 1:length(win[,1])) {
a<-table.row.start(a)
mylabel <- paste('Winsorized Mean (',j)
mylabel <- paste(mylabel,'/')
mylabel <- paste(mylabel,length(win[,1]))
mylabel <- paste(mylabel,')')
a<-table.element(a,hyperlink('winsorized_mean.htm', mylabel, 'click to view the definition of the Winsorized Mean'),header=TRUE)
a<-table.element(a,win[j,1])
a<-table.element(a,win[j,2])
a<-table.element(a,win[j,1]/win[j,2])
a<-table.row.end(a)
}
for (j in 1:length(tri[,1])) {
a<-table.row.start(a)
mylabel <- paste('Trimmed Mean (',j)
mylabel <- paste(mylabel,'/')
mylabel <- paste(mylabel,length(tri[,1]))
mylabel <- paste(mylabel,')')
a<-table.element(a,hyperlink('arithmetic_mean.htm', mylabel, 'click to view the definition of the Trimmed Mean'),header=TRUE)
a<-table.element(a,tri[j,1])
a<-table.element(a,tri[j,2])
a<-table.element(a,tri[j,1]/tri[j,2])
a<-table.row.end(a)
}
a<-table.row.start(a)
a<-table.element(a,hyperlink('median_1.htm', 'Median', 'click to view the definition of the Median'),header=TRUE)
a<-table.element(a,median(x))
a<-table.element(a,'')
a<-table.row.end(a)
a<-table.row.start(a)
a<-table.element(a,hyperlink('midrange.htm', 'Midrange', 'click to view the definition of the Midrange'),header=TRUE)
a<-table.element(a,midr)
a<-table.element(a,'')
a<-table.row.end(a)
a<-table.row.start(a)
mymid <- hyperlink('midmean.htm', 'Midmean', 'click to view the definition of the Midmean')
mylabel <- paste(mymid,hyperlink('method_1.htm','Weighted Average at Xnp',''),sep=' - ')
a<-table.element(a,mylabel,header=TRUE)
a<-table.element(a,midm[1])
a<-table.element(a,'')
a<-table.row.end(a)
a<-table.row.start(a)
mymid <- hyperlink('midmean.htm', 'Midmean', 'click to view the definition of the Midmean')
mylabel <- paste(mymid,hyperlink('method_2.htm','Weighted Average at X(n+1)p',''),sep=' - ')
a<-table.element(a,mylabel,header=TRUE)
a<-table.element(a,midm[2])
a<-table.element(a,'')
a<-table.row.end(a)
a<-table.row.start(a)
mymid <- hyperlink('midmean.htm', 'Midmean', 'click to view the definition of the Midmean')
mylabel <- paste(mymid,hyperlink('method_3.htm','Empirical Distribution Function',''),sep=' - ')
a<-table.element(a,mylabel,header=TRUE)
a<-table.element(a,midm[3])
a<-table.element(a,'')
a<-table.row.end(a)
a<-table.row.start(a)
mymid <- hyperlink('midmean.htm', 'Midmean', 'click to view the definition of the Midmean')
mylabel <- paste(mymid,hyperlink('method_4.htm','Empirical Distribution Function - Averaging',''),sep=' - ')
a<-table.element(a,mylabel,header=TRUE)
a<-table.element(a,midm[4])
a<-table.element(a,'')
a<-table.row.end(a)
a<-table.row.start(a)
mymid <- hyperlink('midmean.htm', 'Midmean', 'click to view the definition of the Midmean')
mylabel <- paste(mymid,hyperlink('method_5.htm','Empirical Distribution Function - Interpolation',''),sep=' - ')
a<-table.element(a,mylabel,header=TRUE)
a<-table.element(a,midm[5])
a<-table.element(a,'')
a<-table.row.end(a)
a<-table.row.start(a)
mymid <- hyperlink('midmean.htm', 'Midmean', 'click to view the definition of the Midmean')
mylabel <- paste(mymid,hyperlink('method_6.htm','Closest Observation',''),sep=' - ')
a<-table.element(a,mylabel,header=TRUE)
a<-table.element(a,midm[6])
a<-table.element(a,'')
a<-table.row.end(a)
a<-table.row.start(a)
mymid <- hyperlink('midmean.htm', 'Midmean', 'click to view the definition of the Midmean')
mylabel <- paste(mymid,hyperlink('method_7.htm','True Basic - Statistics Graphics Toolkit',''),sep=' - ')
a<-table.element(a,mylabel,header=TRUE)
a<-table.element(a,midm[7])
a<-table.element(a,'')
a<-table.row.end(a)
a<-table.row.start(a)
mymid <- hyperlink('midmean.htm', 'Midmean', 'click to view the definition of the Midmean')
mylabel <- paste(mymid,hyperlink('method_8.htm','MS Excel (old versions)',''),sep=' - ')
a<-table.element(a,mylabel,header=TRUE)
a<-table.element(a,midm[8])
a<-table.element(a,'')
a<-table.row.end(a)
a<-table.row.start(a)
a<-table.element(a,'Number of observations',header=TRUE)
a<-table.element(a,length(x))
a<-table.element(a,'')
a<-table.row.end(a)
a<-table.end(a)
table.save(a,file='mytable.tab')