Free Statistics

of Irreproducible Research!

Author's title

Author*Unverified author*
R Software Modulerwasp_centraltendency.wasp
Title produced by softwareCentral Tendency
Date of computationSun, 12 Oct 2014 11:40:25 +0100
Cite this page as followsStatistical Computations at FreeStatistics.org, Office for Research Development and Education, URL https://freestatistics.org/blog/index.php?v=date/2014/Oct/12/t1413110452bbaiy4hghronjkd.htm/, Retrieved Wed, 15 May 2024 16:39:53 +0000
Statistical Computations at FreeStatistics.org, Office for Research Development and Education, URL https://freestatistics.org/blog/index.php?pk=240536, Retrieved Wed, 15 May 2024 16:39:53 +0000
QR Codes:

Original text written by user:
IsPrivate?No (this computation is public)
User-defined keywords
Estimated Impact96
Family? (F = Feedback message, R = changed R code, M = changed R Module, P = changed Parameters, D = changed Data)
-       [Central Tendency] [Robuustheid begon...] [2014-10-12 10:40:25] [8ab2f7883acfec92c4c89513940c9803] [Current]
Feedback Forum

Post a new message
Dataseries X:
876
819
610
757
840
745
662
563
624
588
754
705
661
737
542
709
787
689
601
467
555
471
718
676
700
781
596
779
727
692
560
517
572
491
639
585
596
617
445
615
571
592
580
487
540
546
649
620
593
528
492
570
592
512
475
405
540
472
567
538
508
578
466
540
515
550
485
355
386
365
417
356


Summary of computational transaction
Raw Inputview raw input (R code)
Raw Outputview raw output of R engine
Computing time1 seconds
R Server'Herman Ole Andreas Wold' @ wold.wessa.net

\begin{tabular}{lllllllll}
\hline
Summary of computational transaction \tabularnewline
Raw Input & view raw input (R code)  \tabularnewline
Raw Output & view raw output of R engine  \tabularnewline
Computing time & 1 seconds \tabularnewline
R Server & 'Herman Ole Andreas Wold' @ wold.wessa.net \tabularnewline
\hline
\end{tabular}
%Source: https://freestatistics.org/blog/index.php?pk=240536&T=0

[TABLE]
[ROW][C]Summary of computational transaction[/C][/ROW]
[ROW][C]Raw Input[/C][C]view raw input (R code) [/C][/ROW]
[ROW][C]Raw Output[/C][C]view raw output of R engine [/C][/ROW]
[ROW][C]Computing time[/C][C]1 seconds[/C][/ROW]
[ROW][C]R Server[/C][C]'Herman Ole Andreas Wold' @ wold.wessa.net[/C][/ROW]
[/TABLE]
Source: https://freestatistics.org/blog/index.php?pk=240536&T=0

Globally Unique Identifier (entire table): ba.freestatistics.org/blog/index.php?pk=240536&T=0

As an alternative you can also use a QR Code:  

The GUIDs for individual cells are displayed in the table below:

Summary of computational transaction
Raw Inputview raw input (R code)
Raw Outputview raw output of R engine
Computing time1 seconds
R Server'Herman Ole Andreas Wold' @ wold.wessa.net


Central Tendency - Ungrouped Data
MeasureValueS.E.Value/S.E.
Arithmetic Mean589.69444444444413.839944668346142.6081504352511
Geometric Mean578.008431508621
Harmonic Mean566.098319686208
Quadratic Mean601.114936319725
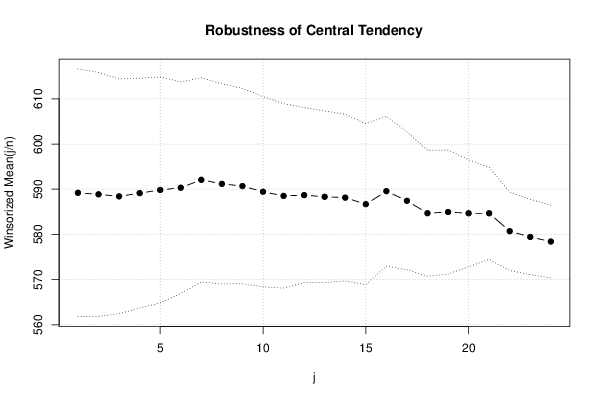
Winsorized Mean ( 1 / 24 )589.20833333333313.699276015219143.0101804415617
Winsorized Mean ( 2 / 24 )588.87513.49479609751943.6371913843339
Winsorized Mean ( 3 / 24 )588.41666666666712.992500394849845.2889473761274
Winsorized Mean ( 4 / 24 )589.13888888888912.697443853815546.3982275229244
Winsorized Mean ( 5 / 24 )589.83333333333312.501596142224747.1806421054626
Winsorized Mean ( 6 / 24 )590.33333333333311.689548319165450.5009532631352
Winsorized Mean ( 7 / 24 )592.08333333333311.291186994991752.4376519134755
Winsorized Mean ( 8 / 24 )591.19444444444411.074856246464253.3816811060813
Winsorized Mean ( 9 / 24 )590.69444444444410.803147524467254.6779948257325
Winsorized Mean ( 10 / 24 )589.44444444444410.520991924875256.0255581083373
Winsorized Mean ( 11 / 24 )588.52777777777810.199457859073857.7018686590485
Winsorized Mean ( 12 / 24 )588.6944444444449.6774393367333460.8316336543589
Winsorized Mean ( 13 / 24 )588.3333333333339.4973433399257561.9471479840101
Winsorized Mean ( 14 / 24 )588.1388888888899.2139052896606863.8316620802327
Winsorized Mean ( 15 / 24 )586.6805555555568.9014080401571565.908736337987
Winsorized Mean ( 16 / 24 )589.5694444444448.2756412927515571.2415417232783
Winsorized Mean ( 17 / 24 )587.4444444444447.6335242223730476.9558630236226
Winsorized Mean ( 18 / 24 )584.6944444444446.9685925996846183.9042369144822
Winsorized Mean ( 19 / 24 )584.9583333333336.8533269138960885.3539223624731
Winsorized Mean ( 20 / 24 )584.6805555555565.9172973408794598.8087165260919
Winsorized Mean ( 21 / 24 )584.6805555555565.08868249260257114.898219019463
Winsorized Mean ( 22 / 24 )580.7083333333334.34065999881955133.783418533416
Winsorized Mean ( 23 / 24 )579.4305555555564.16318288109509139.179702670938
Winsorized Mean ( 24 / 24 )578.4305555555564.02709069472883143.634846941162
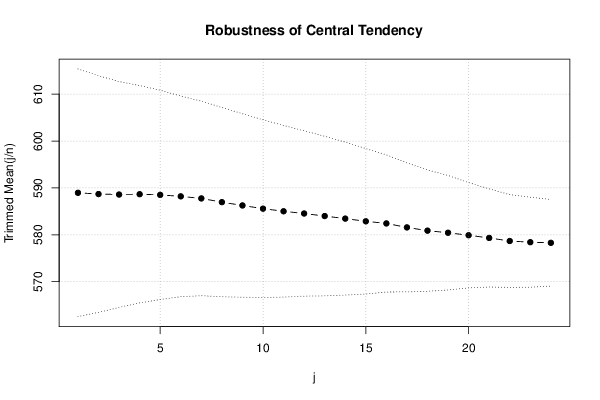
Trimmed Mean ( 1 / 24 )588.95714285714313.203949401556944.6046197956269
Trimmed Mean ( 2 / 24 )588.69117647058812.612848942712646.6739258627782
Trimmed Mean ( 3 / 24 )588.59090909090912.038264115907648.8933373968041
Trimmed Mean ( 4 / 24 )588.6562511.586634908675850.8047638196685
Trimmed Mean ( 5 / 24 )588.51612903225811.154525939486752.7602994717083
Trimmed Mean ( 6 / 24 )588.210.694282753687655.0013510534102
Trimmed Mean ( 7 / 24 )587.75862068965510.374864640107956.6521724454559
Trimmed Mean ( 8 / 24 )586.96428571428610.086539966570258.1928280321758
Trimmed Mean ( 9 / 24 )586.2592592592599.7838335968006359.9212214168247
Trimmed Mean ( 10 / 24 )585.5769230769239.4718900686974261.8226055021616
Trimmed Mean ( 11 / 24 )585.029.1476099253815463.9533172896635
Trimmed Mean ( 12 / 24 )584.5416666666678.8128169845577666.328583436026
Trimmed Mean ( 13 / 24 )5848.5069451592230868.6497901502089
Trimmed Mean ( 14 / 24 )583.4545454545458.1521897177339271.5702854884896
Trimmed Mean ( 15 / 24 )582.8809523809527.7562460223248375.1498792976969
Trimmed Mean ( 16 / 24 )582.4257.312606562887879.646702580153
Trimmed Mean ( 17 / 24 )581.5789473684216.8770581121078184.5679850144771
Trimmed Mean ( 18 / 24 )580.8888888888896.4685782370758389.8016330017342
Trimmed Mean ( 19 / 24 )580.4411764705886.1032692178228495.103321802613
Trimmed Mean ( 20 / 24 )579.906255.61452597872036103.286769390311
Trimmed Mean ( 21 / 24 )579.3333333333335.22952127066202110.781332238466
Trimmed Mean ( 22 / 24 )578.6785714285714.94842542735853116.941960614221
Trimmed Mean ( 23 / 24 )578.4230769230774.79749071492205120.567836665938
Trimmed Mean ( 24 / 24 )578.2916666666674.61467380992207125.315827398954
Median579
Midrange615.5
Midmean - Weighted Average at Xnp579.027027027027
Midmean - Weighted Average at X(n+1)p580.888888888889
Midmean - Empirical Distribution Function579.027027027027
Midmean - Empirical Distribution Function - Averaging580.888888888889
Midmean - Empirical Distribution Function - Interpolation580.888888888889
Midmean - Closest Observation579.027027027027
Midmean - True Basic - Statistics Graphics Toolkit580.888888888889
Midmean - MS Excel (old versions)581.578947368421
Number of observations72

\begin{tabular}{lllllllll}
\hline
Central Tendency - Ungrouped Data \tabularnewline
Measure & Value & S.E. & Value/S.E. \tabularnewline
Arithmetic Mean & 589.694444444444 & 13.8399446683461 & 42.6081504352511 \tabularnewline
Geometric Mean & 578.008431508621 &  &  \tabularnewline
Harmonic Mean & 566.098319686208 &  &  \tabularnewline
Quadratic Mean & 601.114936319725 &  &  \tabularnewline
Winsorized Mean ( 1 / 24 ) & 589.208333333333 & 13.6992760152191 & 43.0101804415617 \tabularnewline
Winsorized Mean ( 2 / 24 ) & 588.875 & 13.494796097519 & 43.6371913843339 \tabularnewline
Winsorized Mean ( 3 / 24 ) & 588.416666666667 & 12.9925003948498 & 45.2889473761274 \tabularnewline
Winsorized Mean ( 4 / 24 ) & 589.138888888889 & 12.6974438538155 & 46.3982275229244 \tabularnewline
Winsorized Mean ( 5 / 24 ) & 589.833333333333 & 12.5015961422247 & 47.1806421054626 \tabularnewline
Winsorized Mean ( 6 / 24 ) & 590.333333333333 & 11.6895483191654 & 50.5009532631352 \tabularnewline
Winsorized Mean ( 7 / 24 ) & 592.083333333333 & 11.2911869949917 & 52.4376519134755 \tabularnewline
Winsorized Mean ( 8 / 24 ) & 591.194444444444 & 11.0748562464642 & 53.3816811060813 \tabularnewline
Winsorized Mean ( 9 / 24 ) & 590.694444444444 & 10.8031475244672 & 54.6779948257325 \tabularnewline
Winsorized Mean ( 10 / 24 ) & 589.444444444444 & 10.5209919248752 & 56.0255581083373 \tabularnewline
Winsorized Mean ( 11 / 24 ) & 588.527777777778 & 10.1994578590738 & 57.7018686590485 \tabularnewline
Winsorized Mean ( 12 / 24 ) & 588.694444444444 & 9.67743933673334 & 60.8316336543589 \tabularnewline
Winsorized Mean ( 13 / 24 ) & 588.333333333333 & 9.49734333992575 & 61.9471479840101 \tabularnewline
Winsorized Mean ( 14 / 24 ) & 588.138888888889 & 9.21390528966068 & 63.8316620802327 \tabularnewline
Winsorized Mean ( 15 / 24 ) & 586.680555555556 & 8.90140804015715 & 65.908736337987 \tabularnewline
Winsorized Mean ( 16 / 24 ) & 589.569444444444 & 8.27564129275155 & 71.2415417232783 \tabularnewline
Winsorized Mean ( 17 / 24 ) & 587.444444444444 & 7.63352422237304 & 76.9558630236226 \tabularnewline
Winsorized Mean ( 18 / 24 ) & 584.694444444444 & 6.96859259968461 & 83.9042369144822 \tabularnewline
Winsorized Mean ( 19 / 24 ) & 584.958333333333 & 6.85332691389608 & 85.3539223624731 \tabularnewline
Winsorized Mean ( 20 / 24 ) & 584.680555555556 & 5.91729734087945 & 98.8087165260919 \tabularnewline
Winsorized Mean ( 21 / 24 ) & 584.680555555556 & 5.08868249260257 & 114.898219019463 \tabularnewline
Winsorized Mean ( 22 / 24 ) & 580.708333333333 & 4.34065999881955 & 133.783418533416 \tabularnewline
Winsorized Mean ( 23 / 24 ) & 579.430555555556 & 4.16318288109509 & 139.179702670938 \tabularnewline
Winsorized Mean ( 24 / 24 ) & 578.430555555556 & 4.02709069472883 & 143.634846941162 \tabularnewline
Trimmed Mean ( 1 / 24 ) & 588.957142857143 & 13.2039494015569 & 44.6046197956269 \tabularnewline
Trimmed Mean ( 2 / 24 ) & 588.691176470588 & 12.6128489427126 & 46.6739258627782 \tabularnewline
Trimmed Mean ( 3 / 24 ) & 588.590909090909 & 12.0382641159076 & 48.8933373968041 \tabularnewline
Trimmed Mean ( 4 / 24 ) & 588.65625 & 11.5866349086758 & 50.8047638196685 \tabularnewline
Trimmed Mean ( 5 / 24 ) & 588.516129032258 & 11.1545259394867 & 52.7602994717083 \tabularnewline
Trimmed Mean ( 6 / 24 ) & 588.2 & 10.6942827536876 & 55.0013510534102 \tabularnewline
Trimmed Mean ( 7 / 24 ) & 587.758620689655 & 10.3748646401079 & 56.6521724454559 \tabularnewline
Trimmed Mean ( 8 / 24 ) & 586.964285714286 & 10.0865399665702 & 58.1928280321758 \tabularnewline
Trimmed Mean ( 9 / 24 ) & 586.259259259259 & 9.78383359680063 & 59.9212214168247 \tabularnewline
Trimmed Mean ( 10 / 24 ) & 585.576923076923 & 9.47189006869742 & 61.8226055021616 \tabularnewline
Trimmed Mean ( 11 / 24 ) & 585.02 & 9.14760992538154 & 63.9533172896635 \tabularnewline
Trimmed Mean ( 12 / 24 ) & 584.541666666667 & 8.81281698455776 & 66.328583436026 \tabularnewline
Trimmed Mean ( 13 / 24 ) & 584 & 8.50694515922308 & 68.6497901502089 \tabularnewline
Trimmed Mean ( 14 / 24 ) & 583.454545454545 & 8.15218971773392 & 71.5702854884896 \tabularnewline
Trimmed Mean ( 15 / 24 ) & 582.880952380952 & 7.75624602232483 & 75.1498792976969 \tabularnewline
Trimmed Mean ( 16 / 24 ) & 582.425 & 7.3126065628878 & 79.646702580153 \tabularnewline
Trimmed Mean ( 17 / 24 ) & 581.578947368421 & 6.87705811210781 & 84.5679850144771 \tabularnewline
Trimmed Mean ( 18 / 24 ) & 580.888888888889 & 6.46857823707583 & 89.8016330017342 \tabularnewline
Trimmed Mean ( 19 / 24 ) & 580.441176470588 & 6.10326921782284 & 95.103321802613 \tabularnewline
Trimmed Mean ( 20 / 24 ) & 579.90625 & 5.61452597872036 & 103.286769390311 \tabularnewline
Trimmed Mean ( 21 / 24 ) & 579.333333333333 & 5.22952127066202 & 110.781332238466 \tabularnewline
Trimmed Mean ( 22 / 24 ) & 578.678571428571 & 4.94842542735853 & 116.941960614221 \tabularnewline
Trimmed Mean ( 23 / 24 ) & 578.423076923077 & 4.79749071492205 & 120.567836665938 \tabularnewline
Trimmed Mean ( 24 / 24 ) & 578.291666666667 & 4.61467380992207 & 125.315827398954 \tabularnewline
Median & 579 &  &  \tabularnewline
Midrange & 615.5 &  &  \tabularnewline
Midmean - Weighted Average at Xnp & 579.027027027027 &  &  \tabularnewline
Midmean - Weighted Average at X(n+1)p & 580.888888888889 &  &  \tabularnewline
Midmean - Empirical Distribution Function & 579.027027027027 &  &  \tabularnewline
Midmean - Empirical Distribution Function - Averaging & 580.888888888889 &  &  \tabularnewline
Midmean - Empirical Distribution Function - Interpolation & 580.888888888889 &  &  \tabularnewline
Midmean - Closest Observation & 579.027027027027 &  &  \tabularnewline
Midmean - True Basic - Statistics Graphics Toolkit & 580.888888888889 &  &  \tabularnewline
Midmean - MS Excel (old versions) & 581.578947368421 &  &  \tabularnewline
Number of observations & 72 &  &  \tabularnewline
\hline
\end{tabular}
%Source: https://freestatistics.org/blog/index.php?pk=240536&T=1

[TABLE]
[ROW][C]Central Tendency - Ungrouped Data[/C][/ROW]
[ROW][C]Measure[/C][C]Value[/C][C]S.E.[/C][C]Value/S.E.[/C][/ROW]
[ROW][C]Arithmetic Mean[/C][C]589.694444444444[/C][C]13.8399446683461[/C][C]42.6081504352511[/C][/ROW]
[ROW][C]Geometric Mean[/C][C]578.008431508621[/C][C][/C][C][/C][/ROW]
[ROW][C]Harmonic Mean[/C][C]566.098319686208[/C][C][/C][C][/C][/ROW]
[ROW][C]Quadratic Mean[/C][C]601.114936319725[/C][C][/C][C][/C][/ROW]
[ROW][C]Winsorized Mean ( 1 / 24 )[/C][C]589.208333333333[/C][C]13.6992760152191[/C][C]43.0101804415617[/C][/ROW]
[ROW][C]Winsorized Mean ( 2 / 24 )[/C][C]588.875[/C][C]13.494796097519[/C][C]43.6371913843339[/C][/ROW]
[ROW][C]Winsorized Mean ( 3 / 24 )[/C][C]588.416666666667[/C][C]12.9925003948498[/C][C]45.2889473761274[/C][/ROW]
[ROW][C]Winsorized Mean ( 4 / 24 )[/C][C]589.138888888889[/C][C]12.6974438538155[/C][C]46.3982275229244[/C][/ROW]
[ROW][C]Winsorized Mean ( 5 / 24 )[/C][C]589.833333333333[/C][C]12.5015961422247[/C][C]47.1806421054626[/C][/ROW]
[ROW][C]Winsorized Mean ( 6 / 24 )[/C][C]590.333333333333[/C][C]11.6895483191654[/C][C]50.5009532631352[/C][/ROW]
[ROW][C]Winsorized Mean ( 7 / 24 )[/C][C]592.083333333333[/C][C]11.2911869949917[/C][C]52.4376519134755[/C][/ROW]
[ROW][C]Winsorized Mean ( 8 / 24 )[/C][C]591.194444444444[/C][C]11.0748562464642[/C][C]53.3816811060813[/C][/ROW]
[ROW][C]Winsorized Mean ( 9 / 24 )[/C][C]590.694444444444[/C][C]10.8031475244672[/C][C]54.6779948257325[/C][/ROW]
[ROW][C]Winsorized Mean ( 10 / 24 )[/C][C]589.444444444444[/C][C]10.5209919248752[/C][C]56.0255581083373[/C][/ROW]
[ROW][C]Winsorized Mean ( 11 / 24 )[/C][C]588.527777777778[/C][C]10.1994578590738[/C][C]57.7018686590485[/C][/ROW]
[ROW][C]Winsorized Mean ( 12 / 24 )[/C][C]588.694444444444[/C][C]9.67743933673334[/C][C]60.8316336543589[/C][/ROW]
[ROW][C]Winsorized Mean ( 13 / 24 )[/C][C]588.333333333333[/C][C]9.49734333992575[/C][C]61.9471479840101[/C][/ROW]
[ROW][C]Winsorized Mean ( 14 / 24 )[/C][C]588.138888888889[/C][C]9.21390528966068[/C][C]63.8316620802327[/C][/ROW]
[ROW][C]Winsorized Mean ( 15 / 24 )[/C][C]586.680555555556[/C][C]8.90140804015715[/C][C]65.908736337987[/C][/ROW]
[ROW][C]Winsorized Mean ( 16 / 24 )[/C][C]589.569444444444[/C][C]8.27564129275155[/C][C]71.2415417232783[/C][/ROW]
[ROW][C]Winsorized Mean ( 17 / 24 )[/C][C]587.444444444444[/C][C]7.63352422237304[/C][C]76.9558630236226[/C][/ROW]
[ROW][C]Winsorized Mean ( 18 / 24 )[/C][C]584.694444444444[/C][C]6.96859259968461[/C][C]83.9042369144822[/C][/ROW]
[ROW][C]Winsorized Mean ( 19 / 24 )[/C][C]584.958333333333[/C][C]6.85332691389608[/C][C]85.3539223624731[/C][/ROW]
[ROW][C]Winsorized Mean ( 20 / 24 )[/C][C]584.680555555556[/C][C]5.91729734087945[/C][C]98.8087165260919[/C][/ROW]
[ROW][C]Winsorized Mean ( 21 / 24 )[/C][C]584.680555555556[/C][C]5.08868249260257[/C][C]114.898219019463[/C][/ROW]
[ROW][C]Winsorized Mean ( 22 / 24 )[/C][C]580.708333333333[/C][C]4.34065999881955[/C][C]133.783418533416[/C][/ROW]
[ROW][C]Winsorized Mean ( 23 / 24 )[/C][C]579.430555555556[/C][C]4.16318288109509[/C][C]139.179702670938[/C][/ROW]
[ROW][C]Winsorized Mean ( 24 / 24 )[/C][C]578.430555555556[/C][C]4.02709069472883[/C][C]143.634846941162[/C][/ROW]
[ROW][C]Trimmed Mean ( 1 / 24 )[/C][C]588.957142857143[/C][C]13.2039494015569[/C][C]44.6046197956269[/C][/ROW]
[ROW][C]Trimmed Mean ( 2 / 24 )[/C][C]588.691176470588[/C][C]12.6128489427126[/C][C]46.6739258627782[/C][/ROW]
[ROW][C]Trimmed Mean ( 3 / 24 )[/C][C]588.590909090909[/C][C]12.0382641159076[/C][C]48.8933373968041[/C][/ROW]
[ROW][C]Trimmed Mean ( 4 / 24 )[/C][C]588.65625[/C][C]11.5866349086758[/C][C]50.8047638196685[/C][/ROW]
[ROW][C]Trimmed Mean ( 5 / 24 )[/C][C]588.516129032258[/C][C]11.1545259394867[/C][C]52.7602994717083[/C][/ROW]
[ROW][C]Trimmed Mean ( 6 / 24 )[/C][C]588.2[/C][C]10.6942827536876[/C][C]55.0013510534102[/C][/ROW]
[ROW][C]Trimmed Mean ( 7 / 24 )[/C][C]587.758620689655[/C][C]10.3748646401079[/C][C]56.6521724454559[/C][/ROW]
[ROW][C]Trimmed Mean ( 8 / 24 )[/C][C]586.964285714286[/C][C]10.0865399665702[/C][C]58.1928280321758[/C][/ROW]
[ROW][C]Trimmed Mean ( 9 / 24 )[/C][C]586.259259259259[/C][C]9.78383359680063[/C][C]59.9212214168247[/C][/ROW]
[ROW][C]Trimmed Mean ( 10 / 24 )[/C][C]585.576923076923[/C][C]9.47189006869742[/C][C]61.8226055021616[/C][/ROW]
[ROW][C]Trimmed Mean ( 11 / 24 )[/C][C]585.02[/C][C]9.14760992538154[/C][C]63.9533172896635[/C][/ROW]
[ROW][C]Trimmed Mean ( 12 / 24 )[/C][C]584.541666666667[/C][C]8.81281698455776[/C][C]66.328583436026[/C][/ROW]
[ROW][C]Trimmed Mean ( 13 / 24 )[/C][C]584[/C][C]8.50694515922308[/C][C]68.6497901502089[/C][/ROW]
[ROW][C]Trimmed Mean ( 14 / 24 )[/C][C]583.454545454545[/C][C]8.15218971773392[/C][C]71.5702854884896[/C][/ROW]
[ROW][C]Trimmed Mean ( 15 / 24 )[/C][C]582.880952380952[/C][C]7.75624602232483[/C][C]75.1498792976969[/C][/ROW]
[ROW][C]Trimmed Mean ( 16 / 24 )[/C][C]582.425[/C][C]7.3126065628878[/C][C]79.646702580153[/C][/ROW]
[ROW][C]Trimmed Mean ( 17 / 24 )[/C][C]581.578947368421[/C][C]6.87705811210781[/C][C]84.5679850144771[/C][/ROW]
[ROW][C]Trimmed Mean ( 18 / 24 )[/C][C]580.888888888889[/C][C]6.46857823707583[/C][C]89.8016330017342[/C][/ROW]
[ROW][C]Trimmed Mean ( 19 / 24 )[/C][C]580.441176470588[/C][C]6.10326921782284[/C][C]95.103321802613[/C][/ROW]
[ROW][C]Trimmed Mean ( 20 / 24 )[/C][C]579.90625[/C][C]5.61452597872036[/C][C]103.286769390311[/C][/ROW]
[ROW][C]Trimmed Mean ( 21 / 24 )[/C][C]579.333333333333[/C][C]5.22952127066202[/C][C]110.781332238466[/C][/ROW]
[ROW][C]Trimmed Mean ( 22 / 24 )[/C][C]578.678571428571[/C][C]4.94842542735853[/C][C]116.941960614221[/C][/ROW]
[ROW][C]Trimmed Mean ( 23 / 24 )[/C][C]578.423076923077[/C][C]4.79749071492205[/C][C]120.567836665938[/C][/ROW]
[ROW][C]Trimmed Mean ( 24 / 24 )[/C][C]578.291666666667[/C][C]4.61467380992207[/C][C]125.315827398954[/C][/ROW]
[ROW][C]Median[/C][C]579[/C][C][/C][C][/C][/ROW]
[ROW][C]Midrange[/C][C]615.5[/C][C][/C][C][/C][/ROW]
[ROW][C]Midmean - Weighted Average at Xnp[/C][C]579.027027027027[/C][C][/C][C][/C][/ROW]
[ROW][C]Midmean - Weighted Average at X(n+1)p[/C][C]580.888888888889[/C][C][/C][C][/C][/ROW]
[ROW][C]Midmean - Empirical Distribution Function[/C][C]579.027027027027[/C][C][/C][C][/C][/ROW]
[ROW][C]Midmean - Empirical Distribution Function - Averaging[/C][C]580.888888888889[/C][C][/C][C][/C][/ROW]
[ROW][C]Midmean - Empirical Distribution Function - Interpolation[/C][C]580.888888888889[/C][C][/C][C][/C][/ROW]
[ROW][C]Midmean - Closest Observation[/C][C]579.027027027027[/C][C][/C][C][/C][/ROW]
[ROW][C]Midmean - True Basic - Statistics Graphics Toolkit[/C][C]580.888888888889[/C][C][/C][C][/C][/ROW]
[ROW][C]Midmean - MS Excel (old versions)[/C][C]581.578947368421[/C][C][/C][C][/C][/ROW]
[ROW][C]Number of observations[/C][C]72[/C][C][/C][C][/C][/ROW]
[/TABLE]
Source: https://freestatistics.org/blog/index.php?pk=240536&T=1

Globally Unique Identifier (entire table): ba.freestatistics.org/blog/index.php?pk=240536&T=1

As an alternative you can also use a QR Code:  

The GUIDs for individual cells are displayed in the table below:

Central Tendency - Ungrouped Data
MeasureValueS.E.Value/S.E.
Arithmetic Mean589.69444444444413.839944668346142.6081504352511
Geometric Mean578.008431508621
Harmonic Mean566.098319686208
Quadratic Mean601.114936319725
Winsorized Mean ( 1 / 24 )589.20833333333313.699276015219143.0101804415617
Winsorized Mean ( 2 / 24 )588.87513.49479609751943.6371913843339
Winsorized Mean ( 3 / 24 )588.41666666666712.992500394849845.2889473761274
Winsorized Mean ( 4 / 24 )589.13888888888912.697443853815546.3982275229244
Winsorized Mean ( 5 / 24 )589.83333333333312.501596142224747.1806421054626
Winsorized Mean ( 6 / 24 )590.33333333333311.689548319165450.5009532631352
Winsorized Mean ( 7 / 24 )592.08333333333311.291186994991752.4376519134755
Winsorized Mean ( 8 / 24 )591.19444444444411.074856246464253.3816811060813
Winsorized Mean ( 9 / 24 )590.69444444444410.803147524467254.6779948257325
Winsorized Mean ( 10 / 24 )589.44444444444410.520991924875256.0255581083373
Winsorized Mean ( 11 / 24 )588.52777777777810.199457859073857.7018686590485
Winsorized Mean ( 12 / 24 )588.6944444444449.6774393367333460.8316336543589
Winsorized Mean ( 13 / 24 )588.3333333333339.4973433399257561.9471479840101
Winsorized Mean ( 14 / 24 )588.1388888888899.2139052896606863.8316620802327
Winsorized Mean ( 15 / 24 )586.6805555555568.9014080401571565.908736337987
Winsorized Mean ( 16 / 24 )589.5694444444448.2756412927515571.2415417232783
Winsorized Mean ( 17 / 24 )587.4444444444447.6335242223730476.9558630236226
Winsorized Mean ( 18 / 24 )584.6944444444446.9685925996846183.9042369144822
Winsorized Mean ( 19 / 24 )584.9583333333336.8533269138960885.3539223624731
Winsorized Mean ( 20 / 24 )584.6805555555565.9172973408794598.8087165260919
Winsorized Mean ( 21 / 24 )584.6805555555565.08868249260257114.898219019463
Winsorized Mean ( 22 / 24 )580.7083333333334.34065999881955133.783418533416
Winsorized Mean ( 23 / 24 )579.4305555555564.16318288109509139.179702670938
Winsorized Mean ( 24 / 24 )578.4305555555564.02709069472883143.634846941162
Trimmed Mean ( 1 / 24 )588.95714285714313.203949401556944.6046197956269
Trimmed Mean ( 2 / 24 )588.69117647058812.612848942712646.6739258627782
Trimmed Mean ( 3 / 24 )588.59090909090912.038264115907648.8933373968041
Trimmed Mean ( 4 / 24 )588.6562511.586634908675850.8047638196685
Trimmed Mean ( 5 / 24 )588.51612903225811.154525939486752.7602994717083
Trimmed Mean ( 6 / 24 )588.210.694282753687655.0013510534102
Trimmed Mean ( 7 / 24 )587.75862068965510.374864640107956.6521724454559
Trimmed Mean ( 8 / 24 )586.96428571428610.086539966570258.1928280321758
Trimmed Mean ( 9 / 24 )586.2592592592599.7838335968006359.9212214168247
Trimmed Mean ( 10 / 24 )585.5769230769239.4718900686974261.8226055021616
Trimmed Mean ( 11 / 24 )585.029.1476099253815463.9533172896635
Trimmed Mean ( 12 / 24 )584.5416666666678.8128169845577666.328583436026
Trimmed Mean ( 13 / 24 )5848.5069451592230868.6497901502089
Trimmed Mean ( 14 / 24 )583.4545454545458.1521897177339271.5702854884896
Trimmed Mean ( 15 / 24 )582.8809523809527.7562460223248375.1498792976969
Trimmed Mean ( 16 / 24 )582.4257.312606562887879.646702580153
Trimmed Mean ( 17 / 24 )581.5789473684216.8770581121078184.5679850144771
Trimmed Mean ( 18 / 24 )580.8888888888896.4685782370758389.8016330017342
Trimmed Mean ( 19 / 24 )580.4411764705886.1032692178228495.103321802613
Trimmed Mean ( 20 / 24 )579.906255.61452597872036103.286769390311
Trimmed Mean ( 21 / 24 )579.3333333333335.22952127066202110.781332238466
Trimmed Mean ( 22 / 24 )578.6785714285714.94842542735853116.941960614221
Trimmed Mean ( 23 / 24 )578.4230769230774.79749071492205120.567836665938
Trimmed Mean ( 24 / 24 )578.2916666666674.61467380992207125.315827398954
Median579
Midrange615.5
Midmean - Weighted Average at Xnp579.027027027027
Midmean - Weighted Average at X(n+1)p580.888888888889
Midmean - Empirical Distribution Function579.027027027027
Midmean - Empirical Distribution Function - Averaging580.888888888889
Midmean - Empirical Distribution Function - Interpolation580.888888888889
Midmean - Closest Observation579.027027027027
Midmean - True Basic - Statistics Graphics Toolkit580.888888888889
Midmean - MS Excel (old versions)581.578947368421
Number of observations72


Parameters (Session):
Parameters (R input):
R code (references can be found in the software module):
geomean <- function(x) {
return(exp(mean(log(x))))
}
harmean <- function(x) {
return(1/mean(1/x))
}
quamean <- function(x) {
return(sqrt(mean(x*x)))
}
winmean <- function(x) {
x <-sort(x[!is.na(x)])
n<-length(x)
denom <- 3
nodenom <- n/denom
if (nodenom>40) denom <- n/40
sqrtn = sqrt(n)
roundnodenom = floor(nodenom)
win <- array(NA,dim=c(roundnodenom,2))
for (j in 1:roundnodenom) {
win[j,1] <- (j*x[j+1]+sum(x[(j+1):(n-j)])+j*x[n-j])/n
win[j,2] <- sd(c(rep(x[j+1],j),x[(j+1):(n-j)],rep(x[n-j],j)))/sqrtn
}
return(win)
}
trimean <- function(x) {
x <-sort(x[!is.na(x)])
n<-length(x)
denom <- 3
nodenom <- n/denom
if (nodenom>40) denom <- n/40
sqrtn = sqrt(n)
roundnodenom = floor(nodenom)
tri <- array(NA,dim=c(roundnodenom,2))
for (j in 1:roundnodenom) {
tri[j,1] <- mean(x,trim=j/n)
tri[j,2] <- sd(x[(j+1):(n-j)]) / sqrt(n-j*2)
}
return(tri)
}
midrange <- function(x) {
return((max(x)+min(x))/2)
}
q1 <- function(data,n,p,i,f) {
np <- n*p;
i <<- floor(np)
f <<- np - i
qvalue <- (1-f)*data[i] + f*data[i+1]
}
q2 <- function(data,n,p,i,f) {
np <- (n+1)*p
i <<- floor(np)
f <<- np - i
qvalue <- (1-f)*data[i] + f*data[i+1]
}
q3 <- function(data,n,p,i,f) {
np <- n*p
i <<- floor(np)
f <<- np - i
if (f==0) {
qvalue <- data[i]
} else {
qvalue <- data[i+1]
}
}
q4 <- function(data,n,p,i,f) {
np <- n*p
i <<- floor(np)
f <<- np - i
if (f==0) {
qvalue <- (data[i]+data[i+1])/2
} else {
qvalue <- data[i+1]
}
}
q5 <- function(data,n,p,i,f) {
np <- (n-1)*p
i <<- floor(np)
f <<- np - i
if (f==0) {
qvalue <- data[i+1]
} else {
qvalue <- data[i+1] + f*(data[i+2]-data[i+1])
}
}
q6 <- function(data,n,p,i,f) {
np <- n*p+0.5
i <<- floor(np)
f <<- np - i
qvalue <- data[i]
}
q7 <- function(data,n,p,i,f) {
np <- (n+1)*p
i <<- floor(np)
f <<- np - i
if (f==0) {
qvalue <- data[i]
} else {
qvalue <- f*data[i] + (1-f)*data[i+1]
}
}
q8 <- function(data,n,p,i,f) {
np <- (n+1)*p
i <<- floor(np)
f <<- np - i
if (f==0) {
qvalue <- data[i]
} else {
if (f == 0.5) {
qvalue <- (data[i]+data[i+1])/2
} else {
if (f < 0.5) {
qvalue <- data[i]
} else {
qvalue <- data[i+1]
}
}
}
}
midmean <- function(x,def) {
x <-sort(x[!is.na(x)])
n<-length(x)
if (def==1) {
qvalue1 <- q1(x,n,0.25,i,f)
qvalue3 <- q1(x,n,0.75,i,f)
}
if (def==2) {
qvalue1 <- q2(x,n,0.25,i,f)
qvalue3 <- q2(x,n,0.75,i,f)
}
if (def==3) {
qvalue1 <- q3(x,n,0.25,i,f)
qvalue3 <- q3(x,n,0.75,i,f)
}
if (def==4) {
qvalue1 <- q4(x,n,0.25,i,f)
qvalue3 <- q4(x,n,0.75,i,f)
}
if (def==5) {
qvalue1 <- q5(x,n,0.25,i,f)
qvalue3 <- q5(x,n,0.75,i,f)
}
if (def==6) {
qvalue1 <- q6(x,n,0.25,i,f)
qvalue3 <- q6(x,n,0.75,i,f)
}
if (def==7) {
qvalue1 <- q7(x,n,0.25,i,f)
qvalue3 <- q7(x,n,0.75,i,f)
}
if (def==8) {
qvalue1 <- q8(x,n,0.25,i,f)
qvalue3 <- q8(x,n,0.75,i,f)
}
midm <- 0
myn <- 0
roundno4 <- round(n/4)
round3no4 <- round(3*n/4)
for (i in 1:n) {
if ((x[i]>=qvalue1) & (x[i]<=qvalue3)){
midm = midm + x[i]
myn = myn + 1
}
}
midm = midm / myn
return(midm)
}
(arm <- mean(x))
sqrtn <- sqrt(length(x))
(armse <- sd(x) / sqrtn)
(armose <- arm / armse)
(geo <- geomean(x))
(har <- harmean(x))
(qua <- quamean(x))
(win <- winmean(x))
(tri <- trimean(x))
(midr <- midrange(x))
midm <- array(NA,dim=8)
for (j in 1:8) midm[j] <- midmean(x,j)
midm
bitmap(file='test1.png')
lb <- win[,1] - 2*win[,2]
ub <- win[,1] + 2*win[,2]
if ((ylimmin == '') | (ylimmax == '')) plot(win[,1],type='b',main=main, xlab='j', pch=19, ylab='Winsorized Mean(j/n)', ylim=c(min(lb),max(ub))) else plot(win[,1],type='l',main=main, xlab='j', pch=19, ylab='Winsorized Mean(j/n)', ylim=c(ylimmin,ylimmax))
lines(ub,lty=3)
lines(lb,lty=3)
grid()
dev.off()
bitmap(file='test2.png')
lb <- tri[,1] - 2*tri[,2]
ub <- tri[,1] + 2*tri[,2]
if ((ylimmin == '') | (ylimmax == '')) plot(tri[,1],type='b',main=main, xlab='j', pch=19, ylab='Trimmed Mean(j/n)', ylim=c(min(lb),max(ub))) else plot(tri[,1],type='l',main=main, xlab='j', pch=19, ylab='Trimmed Mean(j/n)', ylim=c(ylimmin,ylimmax))
lines(ub,lty=3)
lines(lb,lty=3)
grid()
dev.off()
load(file='createtable')
a<-table.start()
a<-table.row.start(a)
a<-table.element(a,'Central Tendency - Ungrouped Data',4,TRUE)
a<-table.row.end(a)
a<-table.row.start(a)
a<-table.element(a,'Measure',header=TRUE)
a<-table.element(a,'Value',header=TRUE)
a<-table.element(a,'S.E.',header=TRUE)
a<-table.element(a,'Value/S.E.',header=TRUE)
a<-table.row.end(a)
a<-table.row.start(a)
a<-table.element(a,hyperlink('arithmetic_mean.htm', 'Arithmetic Mean', 'click to view the definition of the Arithmetic Mean'),header=TRUE)
a<-table.element(a,arm)
a<-table.element(a,hyperlink('arithmetic_mean_standard_error.htm', armse, 'click to view the definition of the Standard Error of the Arithmetic Mean'))
a<-table.element(a,armose)
a<-table.row.end(a)
a<-table.row.start(a)
a<-table.element(a,hyperlink('geometric_mean.htm', 'Geometric Mean', 'click to view the definition of the Geometric Mean'),header=TRUE)
a<-table.element(a,geo)
a<-table.element(a,'')
a<-table.row.end(a)
a<-table.row.start(a)
a<-table.element(a,hyperlink('harmonic_mean.htm', 'Harmonic Mean', 'click to view the definition of the Harmonic Mean'),header=TRUE)
a<-table.element(a,har)
a<-table.element(a,'')
a<-table.row.end(a)
a<-table.row.start(a)
a<-table.element(a,hyperlink('quadratic_mean.htm', 'Quadratic Mean', 'click to view the definition of the Quadratic Mean'),header=TRUE)
a<-table.element(a,qua)
a<-table.element(a,'')
a<-table.row.end(a)
for (j in 1:length(win[,1])) {
a<-table.row.start(a)
mylabel <- paste('Winsorized Mean (',j)
mylabel <- paste(mylabel,'/')
mylabel <- paste(mylabel,length(win[,1]))
mylabel <- paste(mylabel,')')
a<-table.element(a,hyperlink('winsorized_mean.htm', mylabel, 'click to view the definition of the Winsorized Mean'),header=TRUE)
a<-table.element(a,win[j,1])
a<-table.element(a,win[j,2])
a<-table.element(a,win[j,1]/win[j,2])
a<-table.row.end(a)
}
for (j in 1:length(tri[,1])) {
a<-table.row.start(a)
mylabel <- paste('Trimmed Mean (',j)
mylabel <- paste(mylabel,'/')
mylabel <- paste(mylabel,length(tri[,1]))
mylabel <- paste(mylabel,')')
a<-table.element(a,hyperlink('arithmetic_mean.htm', mylabel, 'click to view the definition of the Trimmed Mean'),header=TRUE)
a<-table.element(a,tri[j,1])
a<-table.element(a,tri[j,2])
a<-table.element(a,tri[j,1]/tri[j,2])
a<-table.row.end(a)
}
a<-table.row.start(a)
a<-table.element(a,hyperlink('median_1.htm', 'Median', 'click to view the definition of the Median'),header=TRUE)
a<-table.element(a,median(x))
a<-table.element(a,'')
a<-table.row.end(a)
a<-table.row.start(a)
a<-table.element(a,hyperlink('midrange.htm', 'Midrange', 'click to view the definition of the Midrange'),header=TRUE)
a<-table.element(a,midr)
a<-table.element(a,'')
a<-table.row.end(a)
a<-table.row.start(a)
mymid <- hyperlink('midmean.htm', 'Midmean', 'click to view the definition of the Midmean')
mylabel <- paste(mymid,hyperlink('method_1.htm','Weighted Average at Xnp',''),sep=' - ')
a<-table.element(a,mylabel,header=TRUE)
a<-table.element(a,midm[1])
a<-table.element(a,'')
a<-table.row.end(a)
a<-table.row.start(a)
mymid <- hyperlink('midmean.htm', 'Midmean', 'click to view the definition of the Midmean')
mylabel <- paste(mymid,hyperlink('method_2.htm','Weighted Average at X(n+1)p',''),sep=' - ')
a<-table.element(a,mylabel,header=TRUE)
a<-table.element(a,midm[2])
a<-table.element(a,'')
a<-table.row.end(a)
a<-table.row.start(a)
mymid <- hyperlink('midmean.htm', 'Midmean', 'click to view the definition of the Midmean')
mylabel <- paste(mymid,hyperlink('method_3.htm','Empirical Distribution Function',''),sep=' - ')
a<-table.element(a,mylabel,header=TRUE)
a<-table.element(a,midm[3])
a<-table.element(a,'')
a<-table.row.end(a)
a<-table.row.start(a)
mymid <- hyperlink('midmean.htm', 'Midmean', 'click to view the definition of the Midmean')
mylabel <- paste(mymid,hyperlink('method_4.htm','Empirical Distribution Function - Averaging',''),sep=' - ')
a<-table.element(a,mylabel,header=TRUE)
a<-table.element(a,midm[4])
a<-table.element(a,'')
a<-table.row.end(a)
a<-table.row.start(a)
mymid <- hyperlink('midmean.htm', 'Midmean', 'click to view the definition of the Midmean')
mylabel <- paste(mymid,hyperlink('method_5.htm','Empirical Distribution Function - Interpolation',''),sep=' - ')
a<-table.element(a,mylabel,header=TRUE)
a<-table.element(a,midm[5])
a<-table.element(a,'')
a<-table.row.end(a)
a<-table.row.start(a)
mymid <- hyperlink('midmean.htm', 'Midmean', 'click to view the definition of the Midmean')
mylabel <- paste(mymid,hyperlink('method_6.htm','Closest Observation',''),sep=' - ')
a<-table.element(a,mylabel,header=TRUE)
a<-table.element(a,midm[6])
a<-table.element(a,'')
a<-table.row.end(a)
a<-table.row.start(a)
mymid <- hyperlink('midmean.htm', 'Midmean', 'click to view the definition of the Midmean')
mylabel <- paste(mymid,hyperlink('method_7.htm','True Basic - Statistics Graphics Toolkit',''),sep=' - ')
a<-table.element(a,mylabel,header=TRUE)
a<-table.element(a,midm[7])
a<-table.element(a,'')
a<-table.row.end(a)
a<-table.row.start(a)
mymid <- hyperlink('midmean.htm', 'Midmean', 'click to view the definition of the Midmean')
mylabel <- paste(mymid,hyperlink('method_8.htm','MS Excel (old versions)',''),sep=' - ')
a<-table.element(a,mylabel,header=TRUE)
a<-table.element(a,midm[8])
a<-table.element(a,'')
a<-table.row.end(a)
a<-table.row.start(a)
a<-table.element(a,'Number of observations',header=TRUE)
a<-table.element(a,length(x))
a<-table.element(a,'')
a<-table.row.end(a)
a<-table.end(a)
table.save(a,file='mytable.tab')